Chester, CT (Connecticut) Houses and Residents
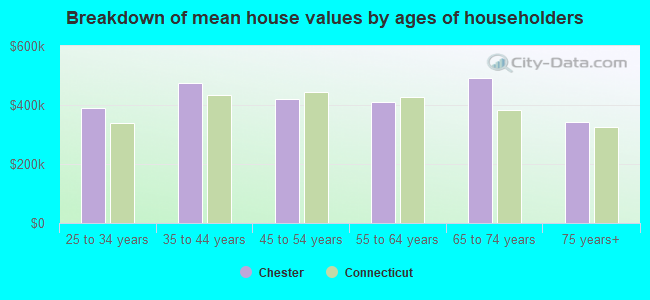
| Chester: | $402,328 |
| Connecticut: | $347,200 |
Total population: 3,994 (Urban population: 2,279, Rural population: 1,464 (all nonfarm))
Houses: 1,613 (1,510 occupied: 1,122 owner occupied, 388 renter occupied)
| % of renters here: | 26% |
| State: | 34% |
Housing density: 101 houses/condos per square mile
Median price asked for vacant for-sale houses and condos in 2022 in this county: $431,754.
Median contract rent in 2022: $1,370 (lower quartile is $1,022, upper quartile is $1,798)
Median rent asked for vacant for-rent units in 2022: $1,341
Median gross rent in Chester, CT in 2022: $1,629
Housing units in Chester with a mortgage: 685 (66 second mortgage, 156 home equity loan, 0 both second mortgage and home equity loan)
Houses without a mortgage: 298
Compare current foreclosures near Chester, CT:
| Photo | Address | Area | Beds / Baths | Price | Details |
|---|---|---|---|---|---|

|
#1
Railroad Ave
Chester, CT 06412
|
2,092 sq. feet
|
2 baths 4 beds |
$499,900
|
show details |

|
#2
Bokum Rd
Chester, CT 06412
|
1,484 sq. feet
|
2 baths 3 beds |
show details | |

|
#3
Ridge Rd
Chester, CT 06412
|
1,022 sq. feet
|
1 baths 2 beds |
show details | |

|
#4
Inspiration Ln
Chester, CT 06412
|
40,000 sq. feet
|
- baths - beds |
show details | |

|
#5
Cross Rd
Chester, CT 06412
|
- sq. feet
|
- baths - beds |
show details | |

|
#6
Denlar Dr # 5b
Chester, CT 06412
|
- sq. feet
|
- baths - beds |
show details | |

|
#7
Lake Dr E
Oakdale, CT 06370
|
1,346 sq. feet
|
1 baths 3 beds |
$365,000
|
show details |

|
#8
Westchester Rd
Colchester, CT 06415
|
900 sq. feet
|
1 baths 2 beds |
$309,900
|
show details |

|
#9
Bokum Road
Chester, CT 06412
|
- sq. feet
|
- baths - beds |
show details | |

|
#10
W Main St
Clinton, CT 06413
|
1,080 sq. feet
|
1 baths 3 beds |
show details |
| Photo | Address | Area | Beds / Baths | Price | Details |
|---|---|---|---|---|---|

|
#11
Ross Rd
Rockfall, CT 06481
|
1,516 sq. feet
|
2 baths 3 beds |
show details | |

|
#12
Avalon Ln
Marlborough, CT 06447
|
3,740 sq. feet
|
2 baths 4 beds |
show details | |

|
#13
Route 79
Killingworth, CT 06419
|
2,199 sq. feet
|
1 baths 3 beds |
show details | |

|
#14
Feather Ln
North Branford, CT 06471
|
4,408 sq. feet
|
2 baths 4 beds |
show details | |

|
#15
Park Rd
Marlborough, CT 06447
|
1,134 sq. feet
|
1 baths 3 beds |
show details | |

|
#16
Poplar Rd
Middletown, CT 06457
|
1,242 sq. feet
|
1 baths 3 beds |
show details | |

|
#17
E Main St
Middletown, CT 06457
|
1,736 sq. feet
|
2 baths 3 beds |
show details | |

|
#18
Old Nod Rd
Clinton, CT 06413
|
2,249 sq. feet
|
1 baths 3 beds |
show details | |

|
#19
Butternut St
Middletown, CT 06457
|
1,498 sq. feet
|
1 baths 4 beds |
show details | |

|
#20
Middlefield St
Middletown, CT 06457
|
1,288 sq. feet
|
1 baths 3 beds |
show details |
| Photo | Address | Area | Beds / Baths | Price | Details |
|---|---|---|---|---|---|

|
#21
Pearl St
Middletown, CT 06457
|
2,832 sq. feet
|
2 baths 4 beds |
show details | |

|
#22
Main St
Middlefield, CT 06455
|
1,526 sq. feet
|
2 baths 3 beds |
show details | |

|
#23
Middlefield St
Middletown, CT 06457
|
1,318 sq. feet
|
1 baths 3 beds |
show details | |

|
#24
Saner Rd
Marlborough, CT 06447
|
2,386 sq. feet
|
2 baths 4 beds |
show details | |

|
#25
River Rd
East Lyme, CT 06333
|
1,204 sq. feet
|
1 baths 3 beds |
show details | |

|
#26
Latimer Dr
East Lyme, CT 06333
|
1,372 sq. feet
|
1 baths 3 beds |
show details | |

|
#27
Longworth Ave
Middletown, CT 06457
|
1,456 sq. feet
|
2 baths 3 beds |
show details | |

|
#28
Barry Ct
Middletown, CT 06457
|
912 sq. feet
|
1 baths 2 beds |
show details | |

|
#29
Woodland Rd
Guilford, CT 06437
|
1,113 sq. feet
|
1 baths 3 beds |
show details | |

|
#30
Fairview St
Portland, CT 06480
|
1,460 sq. feet
|
1 baths 4 beds |
show details |
| Photo | Address | Area | Beds / Baths | Price | Details |
|---|---|---|---|---|---|

|
#31
Riverside St
Portland, CT 06480
|
1,274 sq. feet
|
1 baths 2 beds |
show details | |

|
#32
Tuccitto Rd
Portland, CT 06480
|
816 sq. feet
|
1 baths 2 beds |
show details | |

|
#33
Society Rd
Niantic, CT 06357
|
1,248 sq. feet
|
2 baths 4 beds |
show details | |

|
#34
Jacobs Ter
Middletown, CT 06457
|
982 sq. feet
|
1 baths 2 beds |
show details | |

|
#35
Mohigan Trl
East Hampton, CT 06424
|
864 sq. feet
|
1 baths 3 beds |
show details | |

|
#36
Park Ave
Colchester, CT 06415
|
1,224 sq. feet
|
1 baths 3 beds |
show details | |

|
#37
Pine St
Middletown, CT 06457
|
1,906 sq. feet
|
2 baths 3 beds |
show details | |

|
#38
Durham Rd
Guilford, CT 06437
|
2,139 sq. feet
|
1 baths 4 beds |
show details | |

|
#39
Eastern Dr
Middletown, CT 06457
|
1,554 sq. feet
|
2 baths 3 beds |
show details | |

|
#40
Route 80
Guilford, CT 06437
|
2,164 sq. feet
|
2 baths 4 beds |
show details |
| Photo | Address | Area | Beds / Baths | Price | Details |
|---|---|---|---|---|---|

|
#41
Hunting Hill Ave
Middletown, CT 06457
|
3,372 sq. feet
|
3 baths 6 beds |
show details | |

|
#42
Meech Rd
Middletown, CT 06457
|
1,075 sq. feet
|
1 baths 3 beds |
show details | |

|
#43
Wilderwood Dr
Guilford, CT 06437
|
1,956 sq. feet
|
2 baths 3 beds |
show details | |

|
#44
Oil Mill Rd
Waterford, CT 06385
|
888 sq. feet
|
1 baths 3 beds |
show details | |

|
#45
White Birch Rd
East Hampton, CT 06424
|
1,729 sq. feet
|
1 baths 2 beds |
show details | |

|
#46
Laurelwood Dr
Wallingford, CT 06492
|
2,375 sq. feet
|
2 baths 4 beds |
show details | |

|
#47
Branford Rd Unit 109
North Branford, CT 06471
|
851 sq. feet
|
1 baths 2 beds |
show details | |

|
#48
Branford Rd Unit 520
North Branford, CT 06471
|
1,020 sq. feet
|
1 baths 2 beds |
show details | |

|
#49
East St
Middletown, CT 06457
|
1,598 sq. feet
|
1 baths 3 beds |
show details | |

|
Check over 1 million property listings on Foreclosure.com!
|
browse all offers | |||
Latest news about housing in Chester, CT collected exclusively by city-data.com from local newspapers, TV, and radio stations

 | Current Real estate markets (3987 replies) |
| Old Colonial Homes/Country Living/Schools in CT (58 replies) |
| 2024 Connecticut Town Tournament VI (Celebrating the 10-Year Anniversary & Dazzleman's Memorial) (552 replies) |
| New Yorkers buying Connecticut Homes (31 replies) |
| Would Fairfield be a good fit for us? (133 replies) |
| Where to live with a job in Greenwich? (69 replies) |

Household type by relationship:
Households: 160,591- In family households: 131,621 (30,370 male householders, 13,373 female householders)
34,891 spouses, 44,052 children (41,443 natural, 1,059 adopted, 1,550 stepchildren), 1,876 grandchildren, 1,018 brothers or sisters, 1,359 parents, foster children, 1,032 other relatives, 2,795 non-relatives
- In nonfamily households: 28,970 (10,508 male householders (8,006 living alone)), 12,951 female householders (10,912 living alone)), 5,511 nonrelatives
- In group quarters: 5,085 (1,881 institutionalized population)
26,910 married couples with children.
6,210 single-parent households (1,312 men, 4,898 women).
94.5% of residents of Chester speak English at home.
0.8% of residents speak Spanish at home (100% speak English very well).
4.2% of residents speak other Indo-European language at home (97% speak English very well, 3% speak English not well).
0.2% of residents speak Asian or Pacific Island language at home (100% speak English very well).
0.3% of residents speak other language at home (45% speak English very well, 55% speak English well).
Foreign born population: 261 (6.3%)
(70.9% of them are naturalized citizens)
| Here: | 6.7 |
| State: | 6.5 |
| Here: | 3.2 |
| State: | 4.0 |
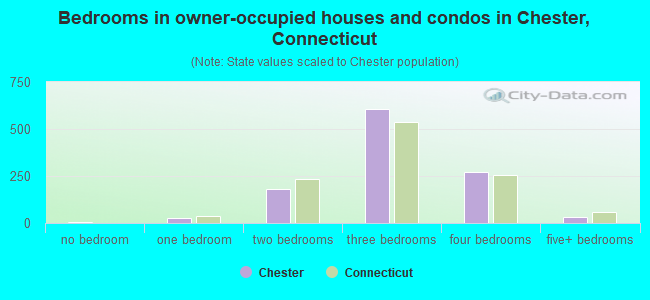
- Bedrooms in owner-occupied houses and condos in Chester, Connecticut
- 6no bedroom
- 241 bedroom
- 1812 bedrooms
- 6093 bedrooms
- 2704 bedrooms
- 325+ bedrooms
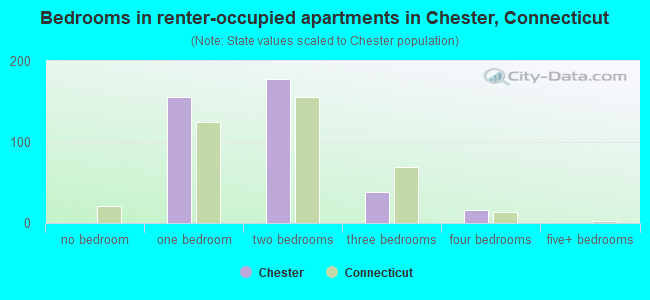
- Bedrooms in renter-occupied apartments in Chester, Connecticut
- 0no bedroom
- 1561 bedroom
- 1782 bedrooms
- 383 bedrooms
- 164 bedrooms
- 05+ bedrooms
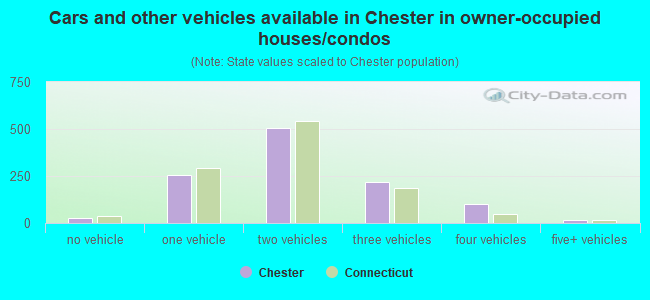
- Cars and other vehicles available in Chester in owner-occupied houses/condos
- 29no vehicle
- 2561 vehicle
- 5032 vehicles
- 2163 vehicles
- 1004 vehicles
- 185+ vehicles
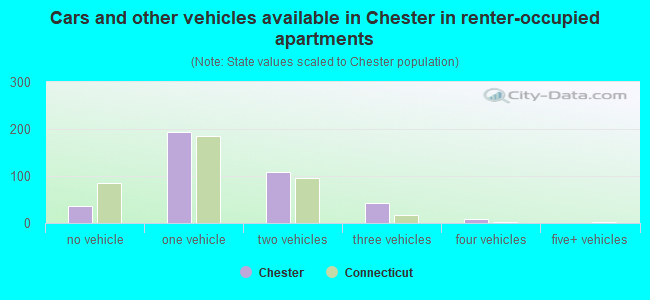
- Cars and other vehicles available in Chester in renter-occupied apartments
- 37no vehicle
- 1931 vehicle
- 1082 vehicles
- 423 vehicles
- 84 vehicles
- 05+ vehicles
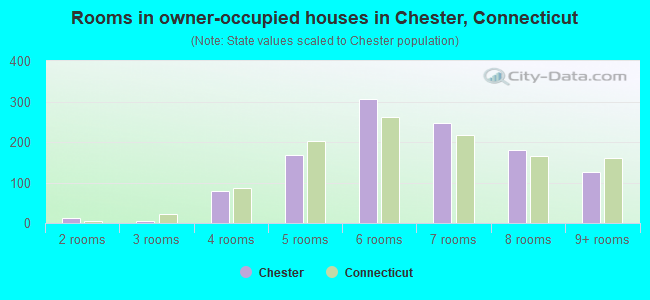
- Rooms in owner-occupied houses in Chester, Connecticut
- 01 room
- 122 rooms
- 53 rooms
- 794 rooms
- 1675 rooms
- 3066 rooms
- 2477 rooms
- 1818 rooms
- 1259+ rooms
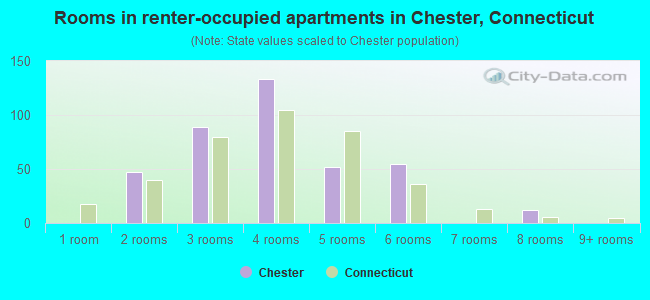
- Rooms in renter-occupied apartments in Chester, Connecticut
- 01 room
- 472 rooms
- 893 rooms
- 1334 rooms
- 525 rooms
- 556 rooms
- 07 rooms
- 128 rooms
- 09+ rooms
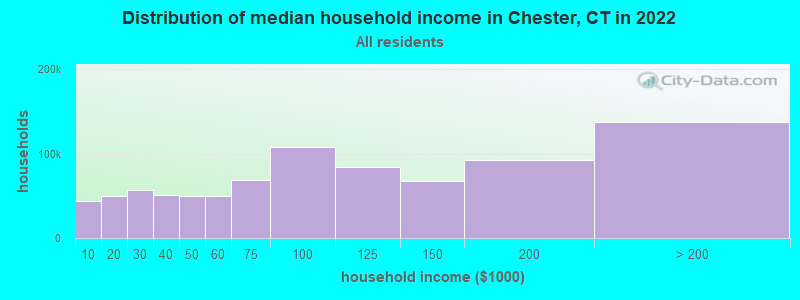
Chester, CT household income distribution

- 50,683Less than $10,000
- 57,378$10,000 to $19,999
- 64,697$20,000 to $29,999
- 57,706$30,000 to $39,999
- 57,551$40,000 to $49,999
- 56,214$50,000 to $59,999
- 78,153$60,000 to $74,999
- 122,316$75,000 to $99,999
- 94,662$100,000 to $124,999
- 75,574$125,000 to $149,999
- 103,203$150,000 to $199,999
- 152,958$200,000 or more
Percentage of workers working in this county: 71.7%
Number of people working at home: 385 (16.9% of all workers)
Travel time to work (commute)
- Less than 5 minutes: 150
- 5 to 9 minutes: 218
- 10 to 14 minutes: 315
- 15 to 19 minutes: 295
- 20 to 24 minutes: 229
- 25 to 29 minutes: 104
- 30 to 34 minutes: 181
- 35 to 39 minutes: 76
- 40 to 44 minutes: 113
- 45 to 59 minutes: 115
- 60 to 89 minutes: 59
- 90 or more minutes: 44
Means of transportation to work:
- Drove a car alone: 1,698 (84.5%)
- Carpooled: 132 (6.6%)
- Railroad: 9 (0.4%)
- Taxi: 10 (0.5%)
- Walked: 50 (2.5%)
- Worked at home: 111 (5.5%)
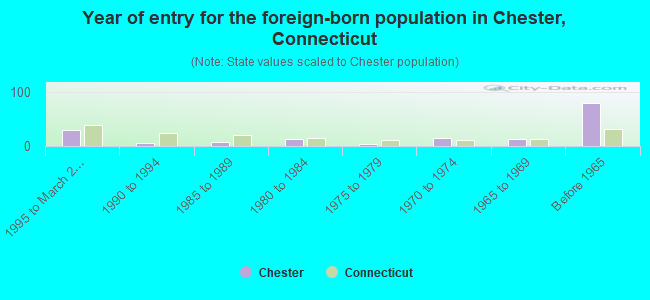
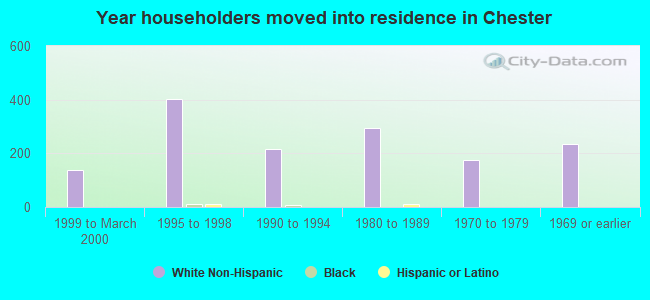
- Year of entry for the foreign-born population in Chester, Connecticut
- 301995 to March 2000
- 51990 to 1994
- 71985 to 1989
- 131980 to 1984
- 41975 to 1979
- 141970 to 1974
- 131965 to 1969
- 79Before 1965
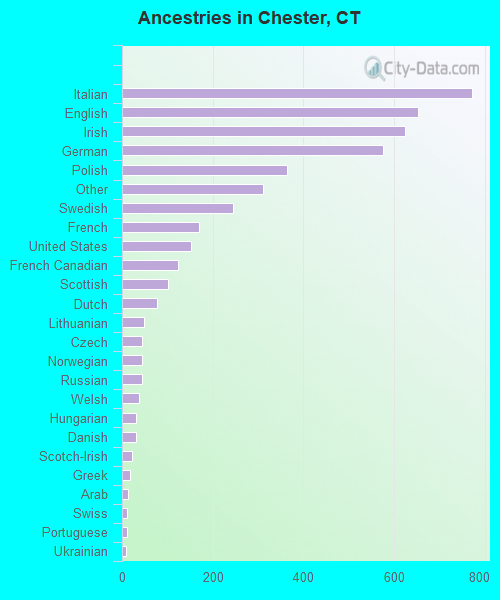
First ancestries reported:
- Italian: 771 (17.0%)
- English: 654 (14.4%)
- Irish: 625 (13.8%)
- German: 576 (12.7%)
- Polish: 365 (8.0%)
- Other: 311 (6.8%)
- Swedish: 244 (5.4%)
- French: 170 (3.7%)
- United States: 152 (3.3%)
- French Canadian: 124 (2.7%)
- Scottish: 102 (2.2%)
- Dutch: 78 (1.7%)
- Lithuanian: 49 (1.1%)
- Czech: 45 (1.0%)
- Norwegian: 45 (1.0%)
- Russian: 45 (1.0%)
- Welsh: 37 (0.8%)
- Hungarian: 31 (0.7%)
- Danish: 30 (0.7%)
- Scotch-Irish: 21 (0.5%)
- Greek: 17 (0.4%)
- Arab: 13 (0.3%)
- Swiss: 12 (0.3%)
- Portuguese: 11 (0.2%)
- Ukrainian: 8 (0.2%)
- Slovak: 5 (0.1%)
Most common places of birth for foreign-born residents (%):
| Chester: | 13.9% (23) |
| Connecticut: | 0.7% (2,742) |
| Chester: | 12.7% (21) |
| Connecticut: | 5.2% (19,083) |
| Chester: | 9.1% (15) |
| Connecticut: | 2.1% (7,612) |
| Chester: | 7.9% (13) |
| Connecticut: | 3.1% (11,432) |
| Chester: | 7.3% (12) |
| Connecticut: | 4.4% (16,395) |
| Chester: | 7.3% (12) |
| Connecticut: | 0.4% (1,303) |
| Chester: | 7.3% (12) |
| Connecticut: | 3.2% (12,009) |
| Chester: | 6.7% (11) |
| Connecticut: | 0.7% (2,646) |
| Chester: | 4.8% (8) |
| Connecticut: | 1.7% (6,247) |
| Chester: | 4.2% (7) |
| Connecticut: | 2.5% (9,358) |
| Chester: | 4.2% (7) |
| Connecticut: | 0.3% (1,005) |
| Chester: | 3.0% (5) |
| Connecticut: | 0.3% (1,224) |
| Chester: | 3.0% (5) |
| Connecticut: | 7.0% (26,023) |
| Chester: | 3.0% (5) |
| Connecticut: | 6.9% (25,507) |
| Chester: | 3.0% (5) |
| Connecticut: | 2.1% (7,596) |
| Chester: | 2.4% (4) |
| Connecticut: | 0.3% (1,053) |
Place of birth for U.S.-born residents:
- This state: 2,522
- Other state: 1,051
- Northeast: 746
- Midwest: 165
- South: 64
- West: 76
64% of Chester residents lived in the same house 5 years ago.
Out of people who lived in different houses, 60% lived in this county.
Out of people who lived in different counties, 66% lived in Connecticut.
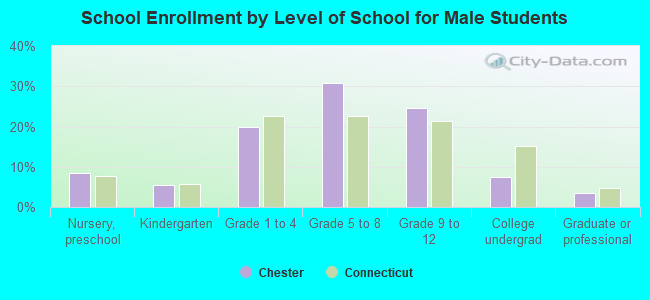
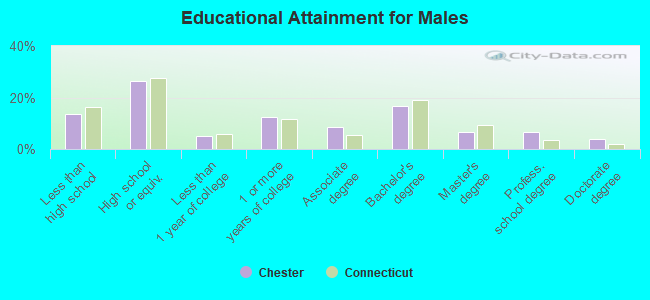
Education attainment for males 25 years and older:
- No schooling: 0
- Nursery to 4th grade: 0
- 5th and 6th grade: 5
- 7th and 8th grade: 18
- 9th grade: 30
- 10th grade: 23
- 11th grade: 32
- 12th grade, no diploma: 67
- High school graduate (or equivalency): 340
- Less than 1 year of college: 67
- Some college more than 1 year, no degree: 161
- Associate degree: 112
- Bachelor's degree: 218
- Master's degree: 87
- Professional school degree: 83
- Doctorate degree: 51
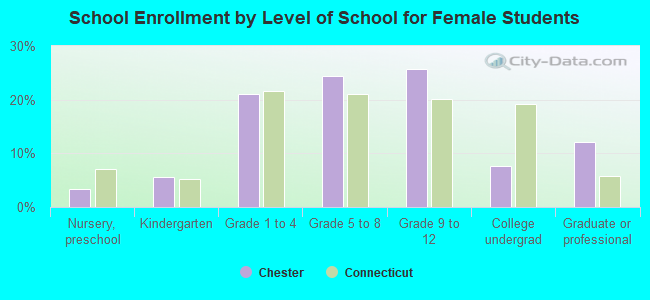
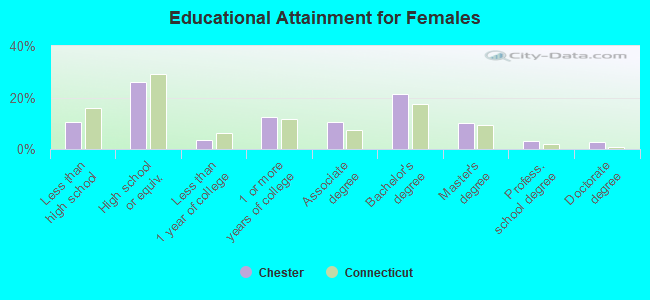
Education attainment for females 25 years and older:
- No schooling: 0
- Nursery to 4th grade: 10
- 5th and 6th grade: 0
- 7th and 8th grade: 9
- 9th grade: 33
- 10th grade: 52
- 11th grade: 39
- 12th grade, no diploma: 13
- High school graduate (or equivalency): 380
- Less than 1 year of college: 53
- Some college more than 1 year, no degree: 181
- Associate degree: 154
- Bachelor's degree: 311
- Master's degree: 150
- Professional school degree: 43
- Doctorate degree: 38
Housing units in structures:
- One, detached: 1,275
- One, attached: 10
- Two: 70
- 3 or 4: 75
- 5 to 9: 57
- 10 to 19: 18
- 20 to 49: 7
- 50 or more: 87
- Mobile homes: 14
Housing units lacking complete kitchen facilities: 0.8%
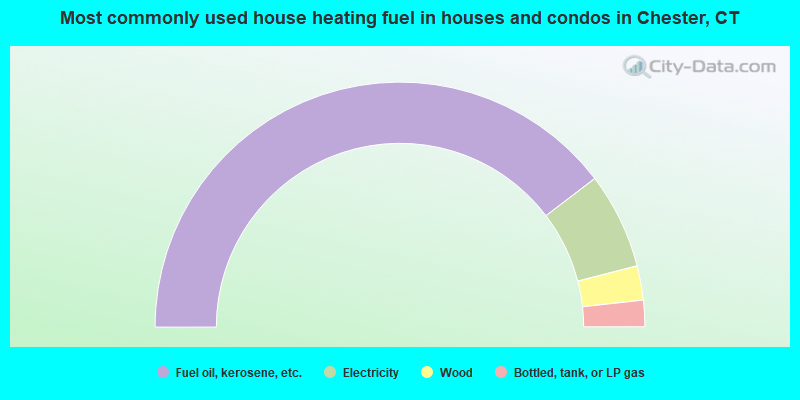
- 79.2%Fuel oil, kerosene, etc.
- 12.7%Electricity
- 4.5%Wood
- 3.5%Bottled, tank, or LP gas
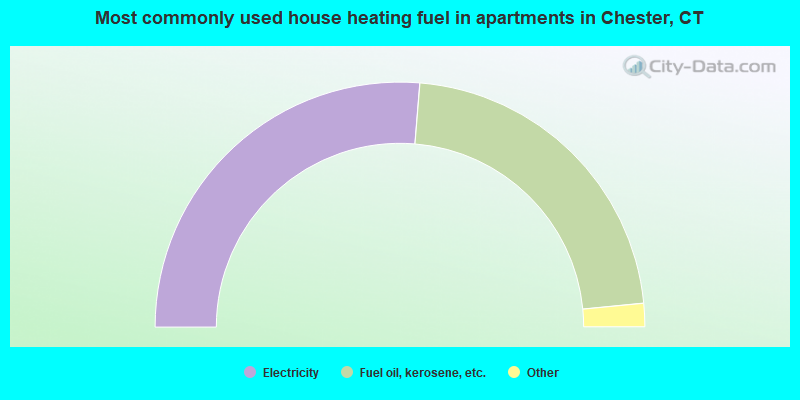
- 52.6%Electricity
- 44.3%Fuel oil, kerosene, etc.
- 1.5%Bottled, tank, or LP gas
- 1.5%Other fuel
Private vs. public school enrollment:
| Here: | 5.1% |
| Connecticut: | 9.9% |
| Here: | 12.1% |
| Connecticut: | 11.0% |
| Here: | 16.7% |
| Connecticut: | 33.4% |