Chicora, PA (Pennsylvania) Houses and Residents
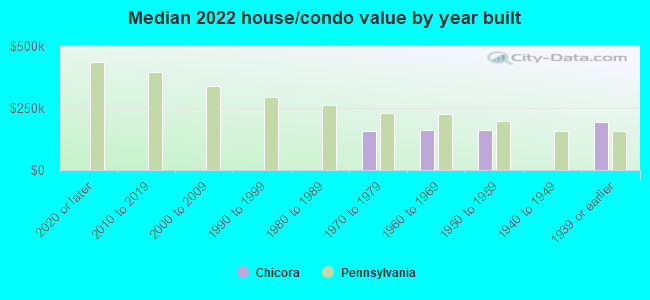
| Chicora: | $174,366 |
| Pennsylvania: | $245,500 |
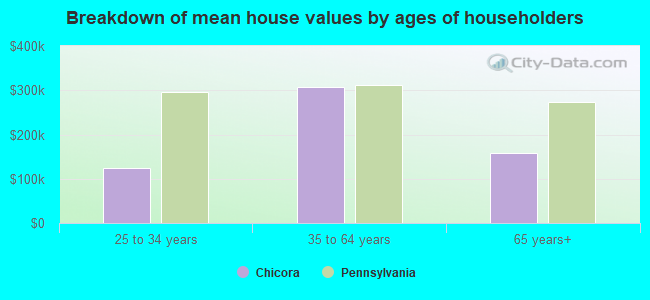
Mean price in 2022:
Detached houses: $196,763
Here: $196,763 State: $317,202 Mobile homes: $39,433
Here: $39,433 State: $92,414
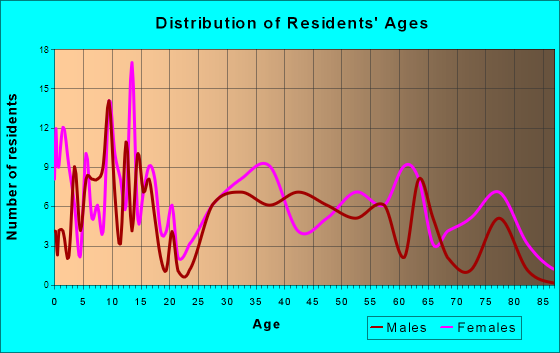
Total population: 1,012 (Urban population: 0, Rural population: 1,021 (11 farm, 1,010 nonfarm))
Houses: 512 (413 occupied: 284 owner occupied, 127 renter occupied)
| % of renters here: | 31% |
| State: | 31% |
Housing density: 924 houses/condos per square mile
Median price asked for vacant for-sale houses and condos in 2022: $224,414.
Median contract rent in 2022: $445 (lower quartile is $409, upper quartile is $542)
Median rent asked for vacant for-rent units in 2022: $1,180
Median gross rent in Chicora, PA in 2022: $614
Housing units in Chicora with a mortgage: 132 (20 second mortgage, 0 home equity loan, 21 both second mortgage and home equity loan)
Houses without a mortgage: 20
Median household income for houses/condos with a mortgage: $108,780
Median household income for apartments without a mortgage: $65,270
Median monthly housing costs: $638
Compare current foreclosures near Chicora, PA:
| Photo | Address | Area | Beds / Baths | Price | Details |
|---|---|---|---|---|---|

|
#1
Grove Ave
Chicora, PA 16025
|
- sq. feet
|
1 baths 2 beds |
show details | |

|
#2
Kittanning St
Chicora, PA 16025
|
- sq. feet
|
- baths - beds |
show details | |

|
#3
Negley Ave
Butler, PA 16001
|
1,225 sq. feet
|
1 baths 3 beds |
$149,900
|
show details |

|
#4
Conerty Rd
Chicora, PA 16025
|
- sq. feet
|
- baths - beds |
show details | |

|
#5
Central Ave
Chicora, PA 16025
|
- sq. feet
|
- baths - beds |
show details | |

|
#6
Queenstown Rd
Karns City, PA 16041
|
1,092 sq. feet
|
1 baths 3 beds |
$68,547
|
show details |

|
#7
Freeport Rd
Kittanning, PA 16201
|
1,091 sq. feet
|
1 baths 2 beds |
$61,723
|
show details |

|
#8
N Wabash Ave
Parker, PA 16049
|
1,580 sq. feet
|
2 baths 3 beds |
$106,998
|
show details |

|
#9
Woodward Ave
Kittanning, PA 16201
|
3,078 sq. feet
|
2 baths 6 beds |
$18,535
|
show details |

|
#10
6th Ave
Ford City, PA 16226
|
1,320 sq. feet
|
1 baths 2 beds |
$44,802
|
show details |
| Photo | Address | Area | Beds / Baths | Price | Details |
|---|---|---|---|---|---|

|
#11
Ridge Ave
Kittanning, PA 16201
|
1,088 sq. feet
|
1 baths 2 beds |
$36,654
|
show details |

|
#12
Sarver Rd
Sarver, PA 16055
|
1,456 sq. feet
|
1 baths 4 beds |
$169,146
|
show details |

|
#13
E Brady Rd
Kittanning, PA 16201
|
1,509 sq. feet
|
1 baths 3 beds |
$95,128
|
show details |

|
#14
Kaylor Petrolia Rd
Karns City, PA 16041
|
1,128 sq. feet
|
1 baths 2 beds |
$106,228
|
show details |

|
#15
S Mckean St
Kittanning, PA 16201
|
2,244 sq. feet
|
1 baths 3 beds |
show details | |

|
#16
Highland Ave
Kittanning, PA 16201
|
1,174 sq. feet
|
1 baths 2 beds |
show details | |

|
#17
Water Tower Rd
Kittanning, PA 16201
|
1,282 sq. feet
|
1 baths 3 beds |
show details | |

|
#18
Church St
Prospect, PA 16052
|
1,560 sq. feet
|
1 baths 3 beds |
show details | |

|
#19
Fairground Rd
Ford City, PA 16226
|
1,336 sq. feet
|
1 baths 3 beds |
show details | |

|
#20
Greenhill Dr
Butler, PA 16001
|
1,936 sq. feet
|
2 baths 3 beds |
show details |
| Photo | Address | Area | Beds / Baths | Price | Details |
|---|---|---|---|---|---|

|
#21
Lincoln St
Parker, PA 16049
|
1,931 sq. feet
|
1 baths 4 beds |
show details | |

|
#22
William Flynn Hwy
Slippery Rock, PA 16057
|
- sq. feet
|
1 baths 3 beds |
show details | |

|
#23
Chestnut Dr
Butler, PA 16001
|
- sq. feet
|
1 baths 2 beds |
show details | |

|
#24
W Diamond St
Butler, PA 16001
|
- sq. feet
|
1 baths 4 beds |
show details | |

|
#25
Mcmillen Rd
Kittanning, PA 16201
|
1,488 sq. feet
|
2 baths 3 beds |
show details | |

|
#26
Stewartson Rd
Templeton, PA 16259
|
- sq. feet
|
- baths - beds |
$94,752
|
show details |

|
#27
Freeport Rd
Kittanning, PA 16201
|
1,424 sq. feet
|
1 baths 2 beds |
show details | |

|
#28
Oneida Valley Rd
Karns City, PA 16041
|
- sq. feet
|
1 baths 3 beds |
show details | |

|
#29
North Ave
Kittanning, PA 16201
|
2,065 sq. feet
|
1 baths 3 beds |
show details | |

|
#30
Franklin Ave
Kittanning, PA 16201
|
1,905 sq. feet
|
2 baths 3 beds |
show details |
| Photo | Address | Area | Beds / Baths | Price | Details |
|---|---|---|---|---|---|

|
#31
E Brady Rd
Cowansville, PA 16218
|
1,522 sq. feet
|
1 baths 4 beds |
show details | |

|
#32
Mcclain Ave
Butler, PA 16001
|
- sq. feet
|
1 baths 3 beds |
show details | |

|
#33
Main St
Ford City, PA 16226
|
1,260 sq. feet
|
1 baths 2 beds |
show details | |

|
#34
O Connor St
Ford City, PA 16226
|
1,120 sq. feet
|
1 baths 2 beds |
show details | |

|
#35
S Scenic Dr
Sarver, PA 16055
|
- sq. feet
|
- baths - beds |
$120,960
|
show details |

|
#36
N Mckean St
Kittanning, PA 16201
|
2,009 sq. feet
|
1 baths 3 beds |
show details | |

|
#37
Orr Ave
Kittanning, PA 16201
|
1,874 sq. feet
|
1 baths 3 beds |
show details | |

|
#38
Main Street
Worthington, PA 16262
|
- sq. feet
|
- baths - beds |
$136,544
|
show details |

|
#39
Charlotte Cir
Kittanning, PA 16201
|
1,656 sq. feet
|
2 baths 3 beds |
show details | |

|
#40
Artlee Ave
Butler, PA 16001
|
- sq. feet
|
1 baths 3 beds |
show details |
| Photo | Address | Area | Beds / Baths | Price | Details |
|---|---|---|---|---|---|

|
#41
Angelspur Ln
Slippery Rock, PA 16057
|
- sq. feet
|
- baths - beds |
show details | |

|
#42
Old Plank Rd
Butler, PA 16002
|
- sq. feet
|
- baths - beds |
show details | |

|
#43
Gerner Rd
Cabot, PA 16023
|
- sq. feet
|
- baths - beds |
show details | |

|
#44
Doc Walker Rd
Parker, PA 16049
|
1,022 sq. feet
|
- baths - beds |
show details | |

|
#45
N Jefferson St Apt 5d
Kittanning, PA 16201
|
- sq. feet
|
- baths - beds |
show details | |

|
#46
Saxonburg Rd
Butler, PA 16002
|
- sq. feet
|
- baths - beds |
show details | |

|
#47
Route 68
Rimersburg, PA 16248
|
- sq. feet
|
- baths - beds |
show details | |

|
#48
Main St
Rimersburg, PA 16248
|
- sq. feet
|
- baths - beds |
show details | |

|
#49
Villa Dr Apt H
Butler, PA 16001
|
- sq. feet
|
- baths - beds |
show details | |

|
Check over 1 million property listings on Foreclosure.com!
|
browse all offers | |||

Latest news about housing in Chicora, PA collected exclusively by city-data.com from local newspapers, TV, and radio stations

 | First trip to Pittsburgh--Excellent! (57 replies) |
| Water contaminated in Chicora, Petrolia PA area? (0 replies) |
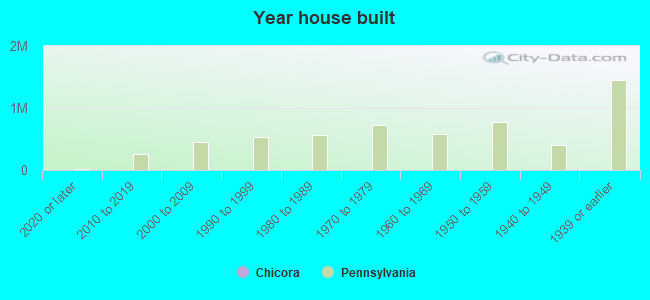
Median year apartment built: 1941
Household type by relationship:
Households: 981- Male householders: 168 (86 living alone), Female householders: 241 (61 living alone)
167 spouses (167 opposite-sex spouses), 40 unmarried partners, (40 opposite-sex unmarried partners), 303 children (294 natural, 0 adopted, 9 stepchildren), 10 grandchildren, 0 brothers or sisters, 0 parents, 0 foster children, 17 other relatives, 33 non-relatives
Size of family households: 98 2-persons, 35 3-persons, 91 4-persons, 5 5-persons, 7 6-persons.
Size of nonfamily households: 140 1-person, 30 2-persons.
159 married couples with children.
81 single-parent households (33 men, 48 women).
97.0% of residents of Chicora speak English at home.
2.3% of residents speak Spanish at home (19% speak English very well, 81% speak English well).
0.4% of residents speak other Indo-European language at home (100% speak English very well).
Foreign born population: 15 (1.5%)
(6.7% of them are naturalized citizens)
| Here: | 6.8 |
| State: | 6.8 |
| Here: | 4.3 |
| State: | 4.3 |
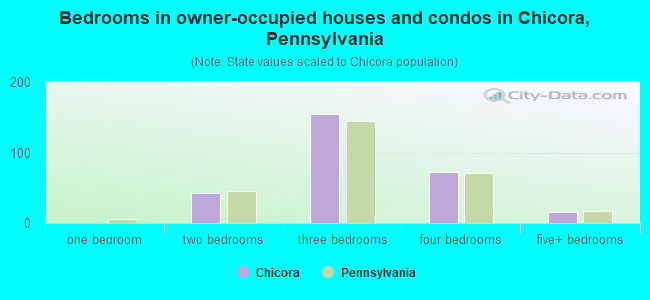
- Bedrooms in owner-occupied houses and condos in Chicora, Pennsylvania
- 0no bedroom
- 01 bedroom
- 422 bedrooms
- 1543 bedrooms
- 724 bedrooms
- 165+ bedrooms
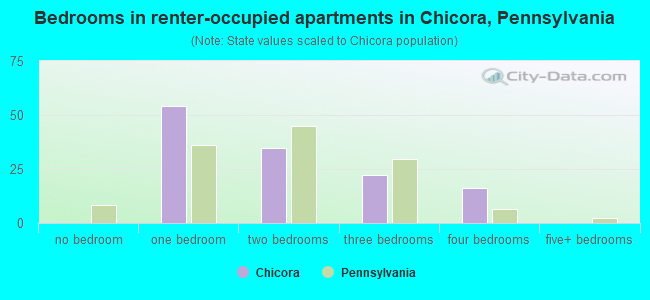
- Bedrooms in renter-occupied apartments in Chicora, Pennsylvania
- 0no bedroom
- 541 bedroom
- 352 bedrooms
- 223 bedrooms
- 164 bedrooms
- 05+ bedrooms
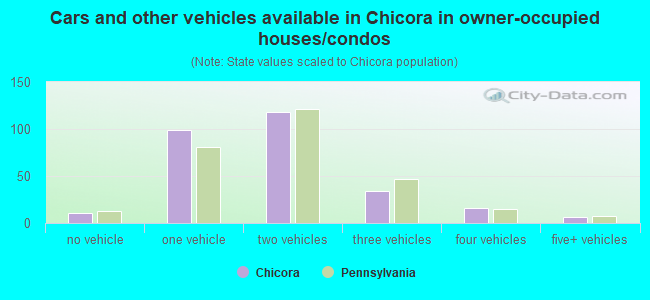
- Cars and other vehicles available in Chicora in owner-occupied houses/condos
- 11no vehicle
- 991 vehicle
- 1182 vehicles
- 343 vehicles
- 164 vehicles
- 65+ vehicles
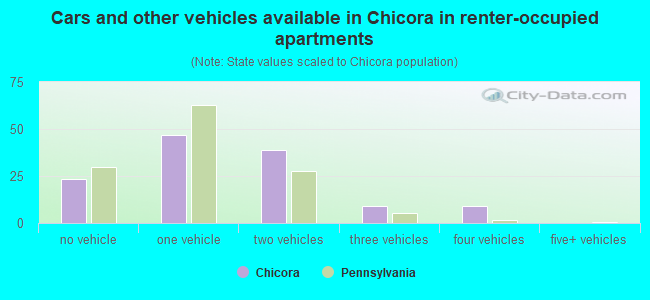
- Cars and other vehicles available in Chicora in renter-occupied apartments
- 23no vehicle
- 471 vehicle
- 392 vehicles
- 93 vehicles
- 94 vehicles
- 05+ vehicles
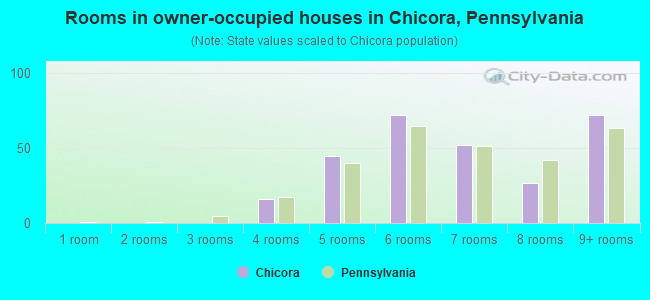
- Rooms in owner-occupied houses in Chicora, Pennsylvania
- 01 room
- 02 rooms
- 03 rooms
- 164 rooms
- 455 rooms
- 726 rooms
- 527 rooms
- 268 rooms
- 729+ rooms
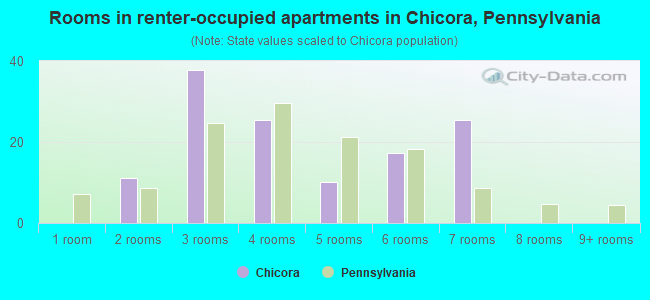
- Rooms in renter-occupied apartments in Chicora, Pennsylvania
- 01 room
- 112 rooms
- 383 rooms
- 254 rooms
- 105 rooms
- 176 rooms
- 257 rooms
- 08 rooms
- 09+ rooms
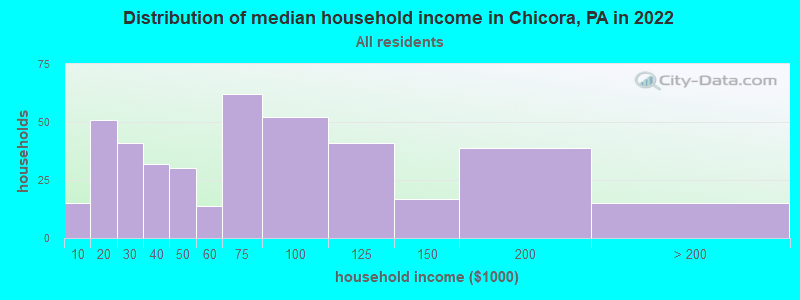
Chicora, PA household income distribution

- 15Less than $10,000
- 51$10,000 to $19,999
- 41$20,000 to $29,999
- 32$30,000 to $39,999
- 30$40,000 to $49,999
- 14$50,000 to $59,999
- 62$60,000 to $74,999
- 52$75,000 to $99,999
- 41$100,000 to $124,999
- 17$125,000 to $149,999
- 39$150,000 to $199,999
- 15$200,000 or more
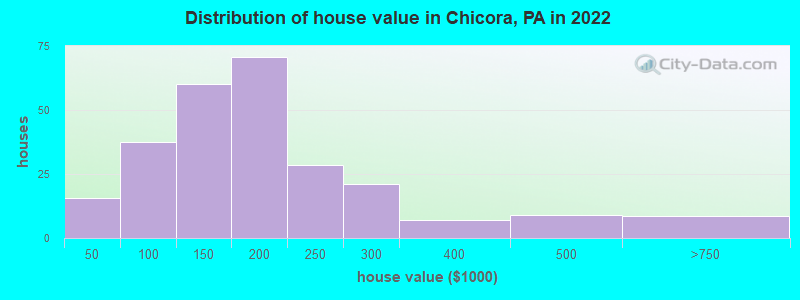
Home value of owner - occupied houses in 2022 in Chicora, PA
-
- 12Less than $10,000
- 3$15,000 to $19,999
- 3$70,000 to $79,999
- 33$80,000 to $89,999
- 26$100,000 to $124,999
- 33$125,000 to $149,999
- 56$150,000 to $174,999
- 14$175,000 to $199,999
- 28$200,000 to $249,999
- 20$250,000 to $299,999
- 7$300,000 to $399,999
- 8$400,000 to $499,999
- 8$500,000 to $749,999
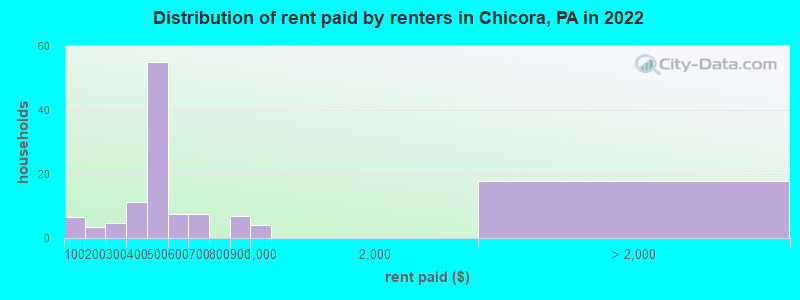
Rent paid by renters in 2022 in Chicora, PA
-
- 6Less than $100
- 3$150 to $199
- 4$200 to $249
- 11$300 to $349
- 14$400 to $449
- 40$450 to $499
- 7$500 to $549
- 7$650 to $699
- 6$800 to $899
- 4$900 to $999
- 17No cash rent
Percentage of workers working in this county: 77.6%
Number of people working at home: 14 (3.2% of all workers)
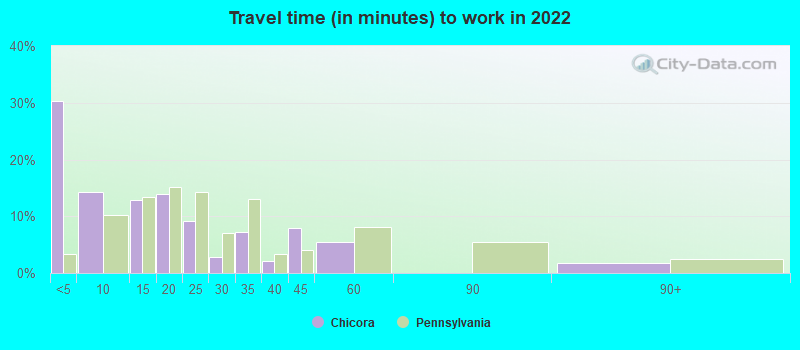
Travel time to work (commute)
- Less than 5 minutes: 23
- 5 to 9 minutes: 8
- 10 to 14 minutes: 49
- 15 to 19 minutes: 3
- 20 to 24 minutes: 134
- 25 to 29 minutes: 33
- 30 to 34 minutes: 75
- 35 to 39 minutes: 8
- 40 to 44 minutes: 16
- 45 to 59 minutes: 23
- 60 to 89 minutes: 48
- 90 or more minutes: 0
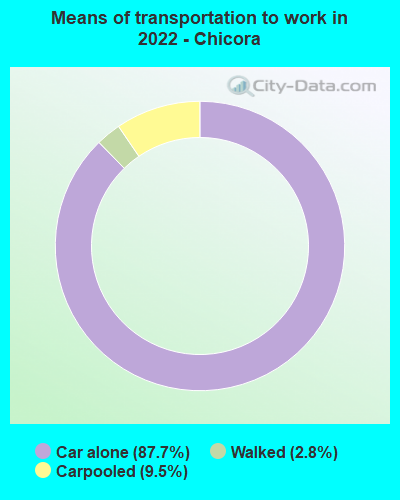
Means of transportation to work:
- Drove a car alone: 272 (77.9%)
- Carpooled: 29 (8.3%)
- Walked: 8 (2.3%)
- Worked at home: 41 (11.7%)
- Unemployment by race in 2022
- Unemployment rate for White non-Hispanic residents
- 1.0%Males
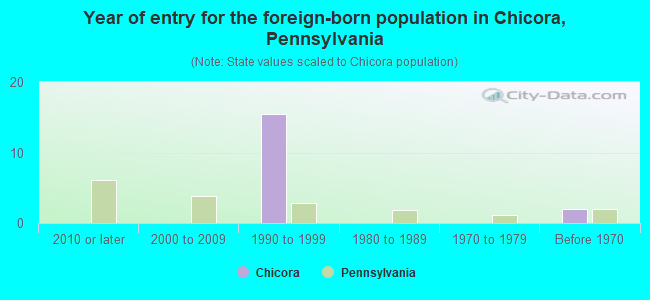
- Year of entry for the foreign-born population in Chicora, Pennsylvania
- 02010 or later
- 02000 to 2009
- 161990 to 1999
- 01980 to 1989
- 01970 to 1979
- 2Before 1970
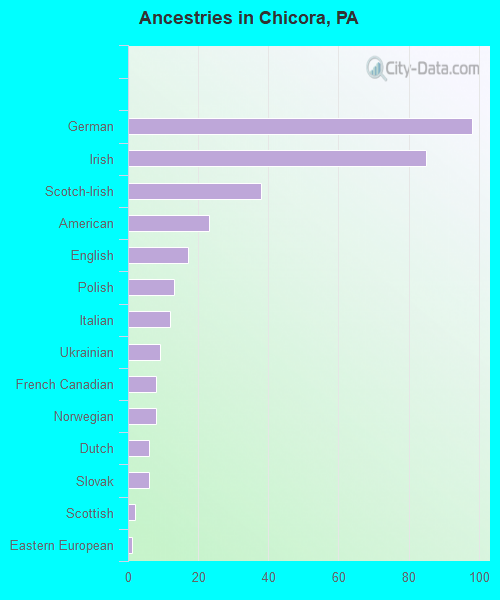
First ancestries reported:
- German: 98 (23.4%)
- Irish: 85 (20.3%)
- Scotch-Irish: 38 (9.1%)
- American: 23 (5.5%)
- English: 17 (4.1%)
- Polish: 13 (3.1%)
- Italian: 12 (2.9%)
- Ukrainian: 9 (2.2%)
- French Canadian: 8 (1.9%)
- Norwegian: 8 (1.9%)
- Dutch: 6 (1.4%)
- Slovak: 6 (1.4%)
- Scottish: 2 (0.5%)
- Eastern European: 1 (0.2%)
Most common places of birth for foreign-born residents (%):
| Chicora: | 88.9% (16) |
| Pennsylvania: | 5.8% (54,190) |
| Chicora: | 5.6% (1) |
| Pennsylvania: | 1.8% (16,884) |
Place of birth for U.S.-born residents:
- This state: 933
- Other state: 27
- Northeast: 2
- Midwest: 14
- South: 1
- West: 10
92.8% of Chicora residents lived in the same house 1 years ago.
Out of people who lived in different houses, 40.6% lived in this county.
Out of people who lived in different counties, 100.0% lived in Pennsylvania.
| Chicora: | 92.8% |
| State average: | 89.3% |
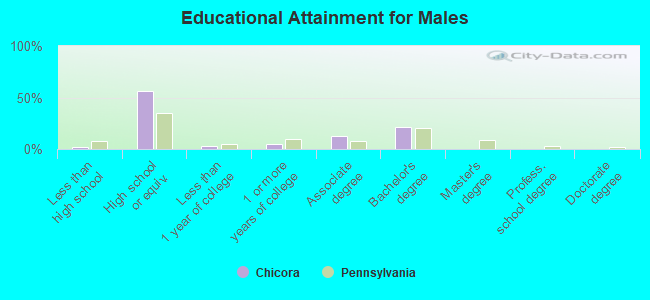
Education attainment for males 25 years and older:
- No schooling: 0
- Nursery to 4th grade: 0
- 5th and 6th grade: 0
- 7th and 8th grade: 0
- 9th grade: 0
- 10th grade: 2
- 11th grade: 0
- 12th grade, no diploma: 5
- High school graduate (or equivalency): 209
- Less than 1 year of college: 10
- Some college more than 1 year, no degree: 19
- Associate degree: 48
- Bachelor's degree: 78
- Master's degree: 1
- Professional school degree: 0
- Doctorate degree: 0
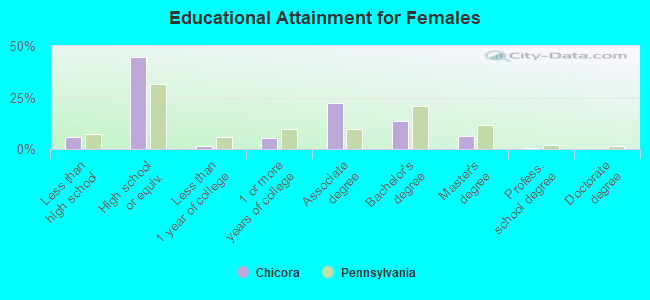
Education attainment for females 25 years and older:
- No schooling: 0
- Nursery to 4th grade: 3
- 5th and 6th grade: 0
- 7th and 8th grade: 0
- 9th grade: 7
- 10th grade: 8
- 11th grade: 0
- 12th grade, no diploma: 0
- High school graduate (or equivalency): 139
- Less than 1 year of college: 5
- Some college more than 1 year, no degree: 17
- Associate degree: 69
- Bachelor's degree: 43
- Master's degree: 20
- Professional school degree: 1
- Doctorate degree: 0
Housing units in structures:
- One, detached: 410
- Two: 19
- 3 or 4: 29
- 10 to 19: 2
- 20 to 49: 22
- Mobile homes: 28
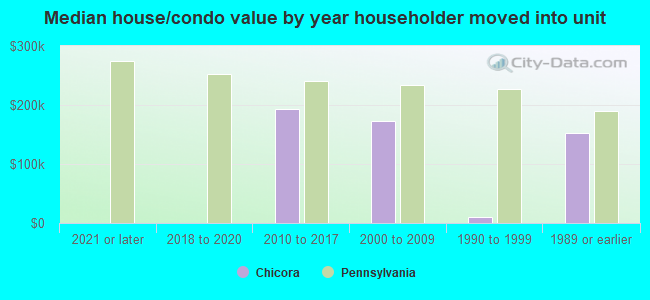
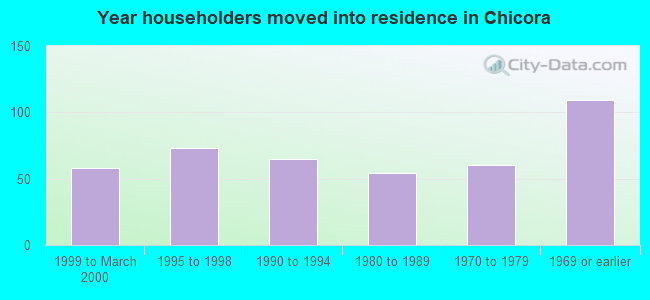
House/condo owner moved in on average 23 years ago
Renter moved in on average 8 years ago
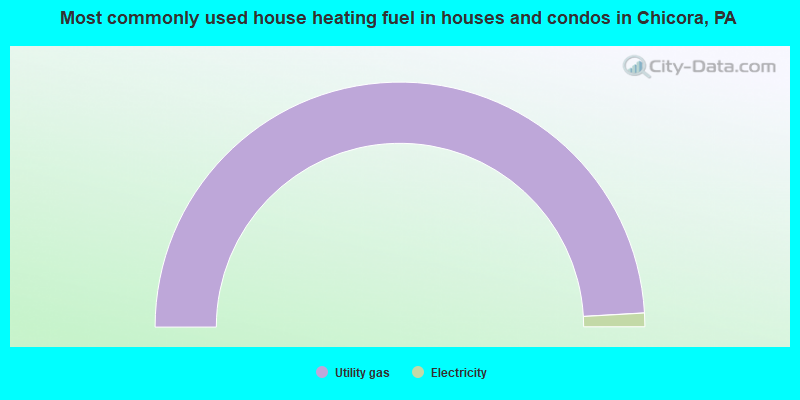
- 98.2%Utility gas
- 1.8%Electricity
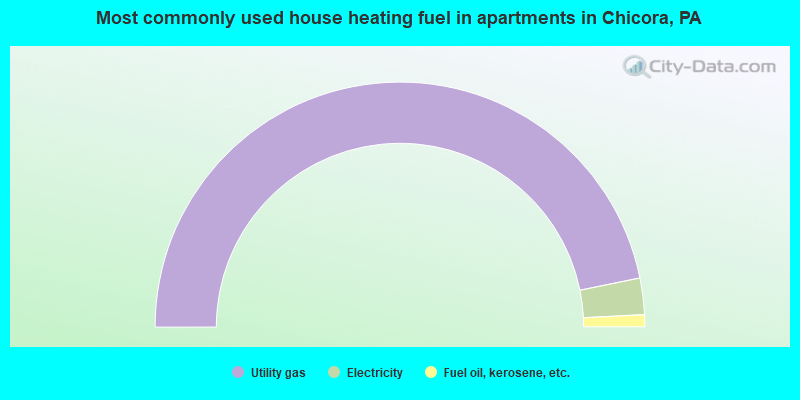
- 93.6%Utility gas
- 4.8%Electricity
- 1.6%Fuel oil, kerosene, etc.
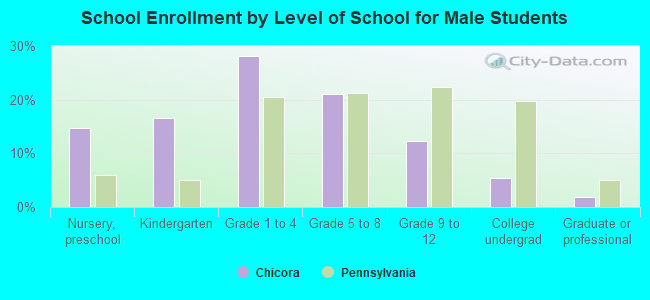
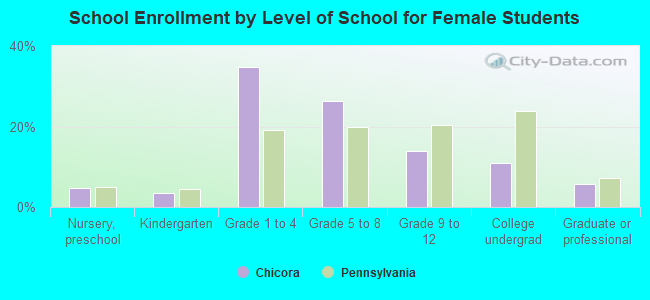
Private vs. public school enrollment:
| Here: | 0.0% |
| Pennsylvania: | 15.7% |
| Here: | 24.1% |
| Pennsylvania: | 13.4% |
| Here: | 16.7% |
| Pennsylvania: | 39.8% |