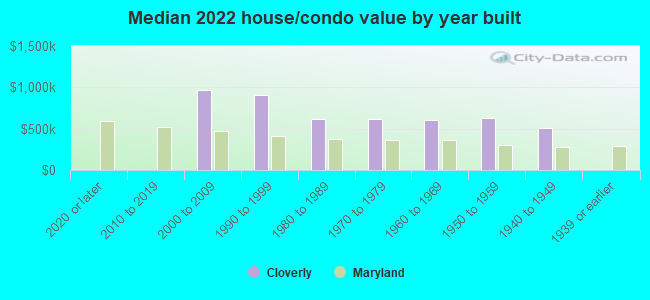
Cloverly, MD (Maryland) Houses and Residents
| Cloverly: | $652,890 |
| Maryland: | $398,100 |
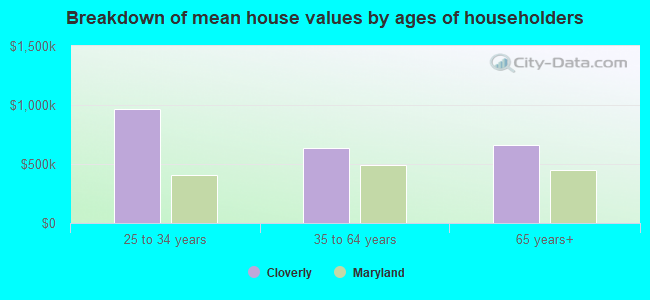
Mean price in 2022:
Detached houses: $661,585
Here: $661,585 State: $526,819 Townhouses or other attached units: $339,055
Here: $339,055 State: $328,305
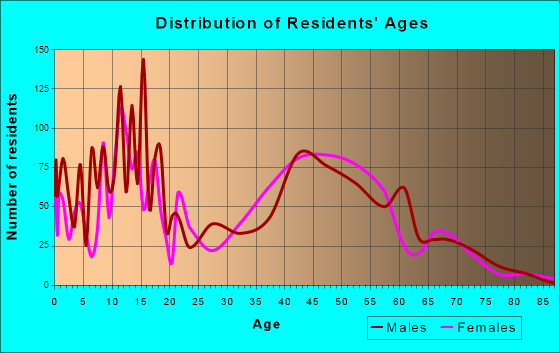
Total population: 15,126 (Urban population: 8,000, Rural population: 0)
Houses: 5,267 (5,087 occupied: 4,510 owner occupied, 615 renter occupied)
| % of renters here: | 12% |
| State: | 32% |
Housing density: 1,348 houses/condos per square mile
Median price asked for vacant for-sale houses and condos in 2022: $1,296,174.
Median contract rent in 2022: $1,641 (lower quartile is $1,129, upper quartile is $1,942)
Median rent asked for vacant for-rent units in 2022: $966
Median gross rent in Cloverly, MD in 2022: $1,676
Housing units in Cloverly with a mortgage: 3,336 (454 second mortgage, 0 home equity loan, 416 both second mortgage and home equity loan)
Houses without a mortgage: 50
Median household income for houses/condos with a mortgage: $166,943
Median household income for apartments without a mortgage: $118,281
Median monthly housing costs: $2,245
Compare current foreclosures near Cloverly, MD:
| Photo | Address | Area | Beds / Baths | Price | Details |
|---|---|---|---|---|---|

|
#1
Heming Ln
Bowie, MD 20716
|
1,800 sq. feet
|
2 baths 3 beds |
$400,000
|
show details |

|
#2
Gladys Retreat Cir
Bowie, MD 20720
|
2,880 sq. feet
|
3 baths 3 beds |
$409,900
|
show details |

|
#3
Pooks Hill Rd Apt 1612s
Bethesda, MD 20814
|
1,250 sq. feet
|
1 baths 2 beds |
$289,000
|
show details |

|
#4
Parkside Dr
Bowie, MD 20721
|
5,066 sq. feet
|
2 baths 5 beds |
$780,000
|
show details |

|
#5
Hammersmith Cir
Silver Spring, MD 20906
|
1,152 sq. feet
|
1 baths 3 beds |
$353,600
|
show details |

|
#6
Eastern Ave NE
Washington, DC 20011
|
1,024 sq. feet
|
1 baths 3 beds |
$395,000
|
show details |

|
#7
17th St NW Apt 504
Washington, DC 20009
|
800 sq. feet
|
1 baths 1 beds |
$419,900
|
show details |

|
#8
19th St NW
Washington, DC 20036
|
2,515 sq. feet
|
6 baths 8 beds |
$1,684,800
|
show details |

|
#9
Interlachen Dr Apt 111
Silver Spring, MD 20906
|
965 sq. feet
|
1 baths 2 beds |
$148,000
|
show details |

|
#10
Cathedral Ave NW Apt 108
Washington, DC 20016
|
765 sq. feet
|
1 baths 1 beds |
$279,900
|
show details |
| Photo | Address | Area | Beds / Baths | Price | Details |
|---|---|---|---|---|---|

|
#11
Brooke Knolls Rd
Gaithersburg, MD 20882
|
1,704 sq. feet
|
3 baths 4 beds |
$681,500
|
show details |

|
#12
Delaware Ave SW Apt N720
Washington, DC 20024
|
- sq. feet
|
1 baths 1 beds |
$155,000
|
show details |

|
#13
T St SE Apt 3
Washington, DC 20020
|
- sq. feet
|
2 baths 4 beds |
$339,900
|
show details |

|
#14
4th St NE Apt 2
Washington, DC 20002
|
1,061 sq. feet
|
2 baths 2 beds |
show details | |

|
#15
Sleepsoft Circle Arta 7216 Sleep Soft Circle
Columbia, MD 21045
|
972 sq. feet
|
3 baths 4 beds |
show details | |

|
#16
Willow Leaf Ct
Odenton, MD 21113
|
1,476 sq. feet
|
2 baths 2 beds |
show details | |

|
#17
Rolling View Dr
Lanham, MD 20706
|
1,108 sq. feet
|
1 baths 3 beds |
show details | |

|
#18
Downing Ct
Bowie, MD 20721
|
1,288 sq. feet
|
3 baths 3 beds |
show details | |

|
#19
Peacock Dr
Hyattsville, MD 20785
|
1,452 sq. feet
|
2 baths 3 beds |
show details | |

|
#20
Maycrest Way
Germantown, MD 20876
|
2,452 sq. feet
|
2 baths 3 beds |
show details |
| Photo | Address | Area | Beds / Baths | Price | Details |
|---|---|---|---|---|---|

|
#21
Harbour Town Dr
Silver Spring, MD 20905
|
5,292 sq. feet
|
4 baths 5 beds |
show details | |

|
#22
Sargent Rd NE
Washington, DC 20017
|
1,360 sq. feet
|
2 baths 3 beds |
show details | |

|
#23
38th St SE Apt 201
Washington, DC 20020
|
675 sq. feet
|
1 baths 1 beds |
show details | |

|
#24
Bowen Rd SE Apt 403
Washington, DC 20020
|
930 sq. feet
|
1 baths 2 beds |
show details | |

|
#25
Buhrstone Dr
Montgomery Village, MD 20886
|
1,060 sq. feet
|
3 baths 3 beds |
show details | |

|
#26
T Pl SE
Washington, DC 20020
|
900 sq. feet
|
2 baths 2 beds |
show details | |

|
#27
Luckpenny Pl
Columbia, MD 21045
|
1,809 sq. feet
|
2 baths 3 beds |
show details | |

|
#28
12th St NW
Washington, DC 20012
|
2,163 sq. feet
|
2 baths 5 beds |
show details | |

|
#29
Underwood Pl NW
Washington, DC 20012
|
1,088 sq. feet
|
3 baths 3 beds |
show details | |

|
#30
Astor Pl SE
Washington, DC 20019
|
2,516 sq. feet
|
4 baths 4 beds |
show details |
| Photo | Address | Area | Beds / Baths | Price | Details |
|---|---|---|---|---|---|

|
#31
Brassie Pl Apt 201
Montgomery Village, MD 20886
|
1,050 sq. feet
|
2 baths 2 beds |
show details | |

|
#32
3rd St SW Apt 708
Washington, DC 20024
|
528 sq. feet
|
1 baths 1 beds |
show details | |

|
#33
46th St SE
Washington, DC 20019
|
1,232 sq. feet
|
2 baths 3 beds |
show details | |

|
#34
Brock Bridge Rd
Laurel, MD 20724
|
1,428 sq. feet
|
1 baths 4 beds |
show details | |

|
#35
Bishops Content Rd
Bowie, MD 20721
|
2,504 sq. feet
|
3 baths 3 beds |
show details | |

|
#36
Rockville Pike Unit 712
Rockville, MD 20852
|
505 sq. feet
|
1 baths 1 beds |
show details | |

|
#37
10th St
Bowie, MD 20715
|
994 sq. feet
|
1 baths 2 beds |
show details | |

|
#38
Sutton Ct
Upper Marlboro, MD 20774
|
1,546 sq. feet
|
3 baths 5 beds |
show details | |

|
#39
Girard St NE
Washington, DC 20017
|
1,270 sq. feet
|
1 baths 3 beds |
show details | |

|
#40
Peppertree Ln
Silver Spring, MD 20906
|
1,309 sq. feet
|
2 baths 3 beds |
show details |
| Photo | Address | Area | Beds / Baths | Price | Details |
|---|---|---|---|---|---|

|
#41
Glen Eagles Dr
Silver Spring, MD 20906
|
3,328 sq. feet
|
3 baths 4 beds |
show details | |

|
#42
Floral Dr
Hyattsville, MD 20783
|
1,178 sq. feet
|
3 baths 5 beds |
show details | |

|
#43
New Mark Esplanade
Rockville, MD 20850
|
1,428 sq. feet
|
3 baths 2 beds |
show details | |

|
#44
Kalmia Rd NW
Washington, DC 20012
|
2,382 sq. feet
|
4 baths 4 beds |
show details | |

|
#45
Secretariat Dr
Bowie, MD 20721
|
3,050 sq. feet
|
4 baths 5 beds |
show details | |

|
#46
Aquarius Ave
Silver Spring, MD 20906
|
1,407 sq. feet
|
2 baths 4 beds |
show details | |

|
#47
Killbarron Dr
Laurel, MD 20707
|
4,004 sq. feet
|
4 baths 5 beds |
show details | |

|
#48
Foote St NE
Washington, DC 20019
|
1,000 sq. feet
|
1 baths 3 beds |
show details | |

|
#49
Central Ln
Gambrills, MD 21054
|
1,499 sq. feet
|
2 baths 3 beds |
show details | |

|
Check over 1 million property listings on Foreclosure.com!
|
browse all offers | |||


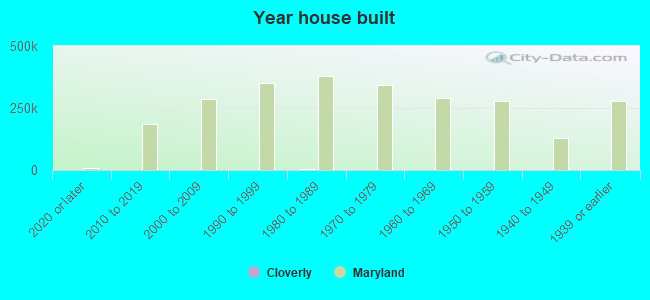
Median year apartment built: 1982
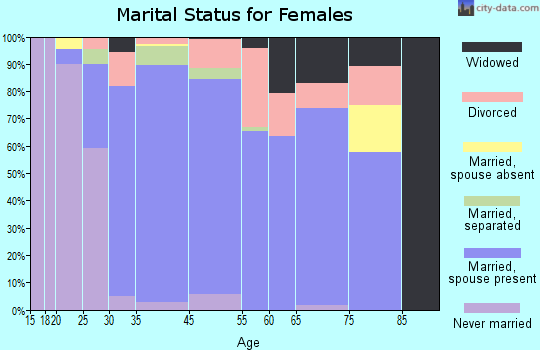
Household type by relationship:
Households: 16,367- Male householders: 2,835 (127 living alone), Female householders: 2,190 (284 living alone)
3,786 spouses (3,757 opposite-sex spouses), 59 unmarried partners, (59 opposite-sex unmarried partners), 5,618 children (5,422 natural, 72 adopted, 123 stepchildren), 348 grandchildren, 312 brothers or sisters, 428 parents, 0 foster children, 319 other relatives, 426 non-relatives
- In group quarters: 41
Size of family households: 1,378 2-persons, 1,294 3-persons, 855 4-persons, 346 5-persons, 403 6-persons, 67 7-or-more-persons.
Size of nonfamily households: 470 1-person, 123 2-persons, 82 5-persons.
2,916 married couples with children.
182 single-parent households (89 men, 93 women).
57.5% of residents of Cloverly speak English at home.
15.2% of residents speak Spanish at home (72% speak English very well, 18% speak English well, 10% speak English not well, 1% don't speak English at all).
11.6% of residents speak other Indo-European language at home (70% speak English very well, 23% speak English well, 6% speak English not well, 1% don't speak English at all).
6.2% of residents speak Asian or Pacific Island language at home (57% speak English very well, 36% speak English well, 7% speak English not well, 1% don't speak English at all).
8.8% of residents speak other language at home (85% speak English very well, 12% speak English well, 2% don't speak English at all).
Foreign born population: 5,648 (34.5%)
(63.0% of them are naturalized citizens)
| Here: | 9.9 |
| State: | 7.3 |
| Here: | 5.9 |
| State: | 4.2 |
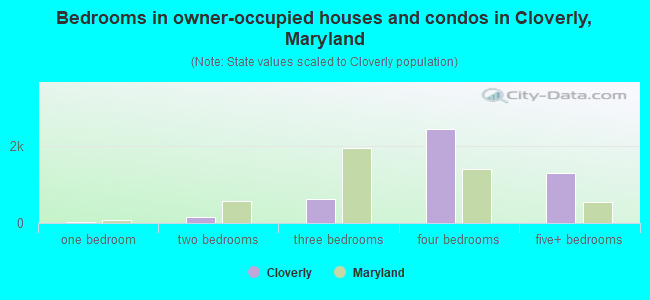
- Bedrooms in owner-occupied houses and condos in Cloverly, Maryland
- 0no bedroom
- 291 bedroom
- 1652 bedrooms
- 6073 bedrooms
- 2,4264 bedrooms
- 1,2835+ bedrooms
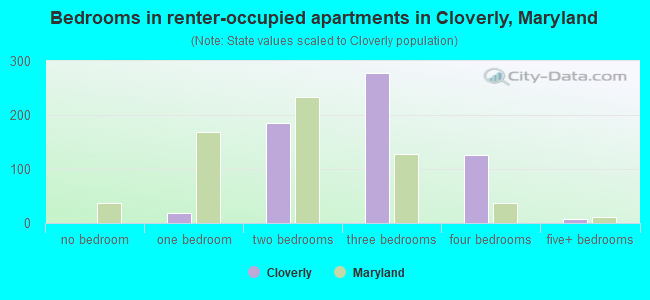
- Bedrooms in renter-occupied apartments in Cloverly, Maryland
- 0no bedroom
- 191 bedroom
- 1862 bedrooms
- 2773 bedrooms
- 1264 bedrooms
- 75+ bedrooms
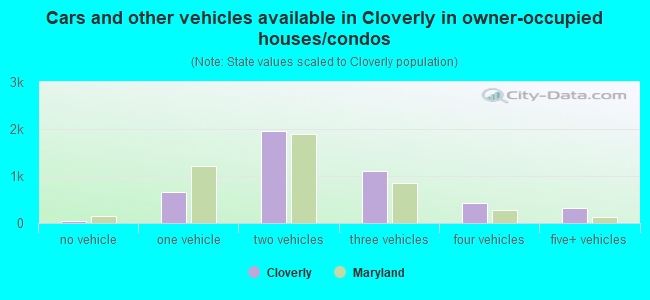
- Cars and other vehicles available in Cloverly in owner-occupied houses/condos
- 36no vehicle
- 6631 vehicle
- 1,9472 vehicles
- 1,1113 vehicles
- 4264 vehicles
- 3285+ vehicles
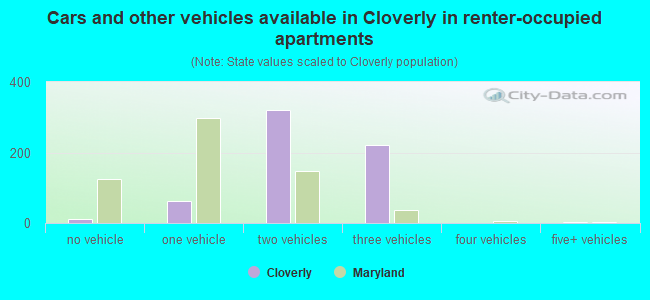
- Cars and other vehicles available in Cloverly in renter-occupied apartments
- 12no vehicle
- 611 vehicle
- 3202 vehicles
- 2203 vehicles
- 04 vehicles
- 25+ vehicles
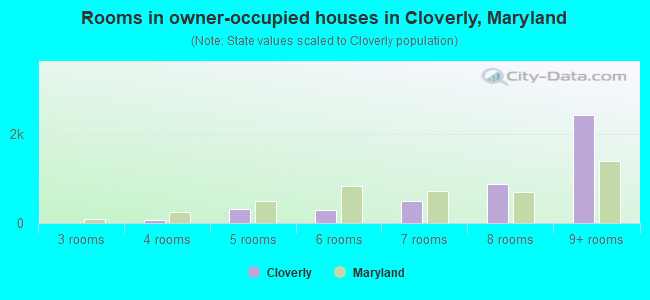
- Rooms in owner-occupied houses in Cloverly, Maryland
- 01 room
- 02 rooms
- 03 rooms
- 764 rooms
- 3175 rooms
- 2956 rooms
- 5047 rooms
- 8828 rooms
- 2,4379+ rooms
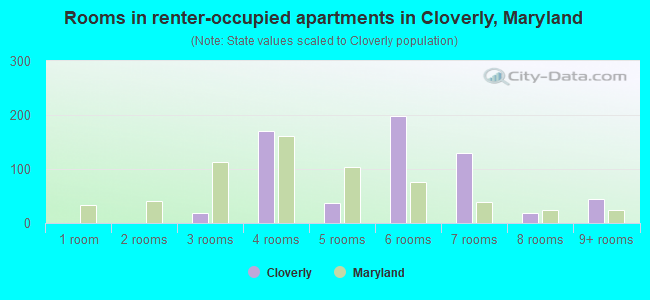
- Rooms in renter-occupied apartments in Cloverly, Maryland
- 01 room
- 02 rooms
- 193 rooms
- 1704 rooms
- 375 rooms
- 1986 rooms
- 1297 rooms
- 198 rooms
- 449+ rooms
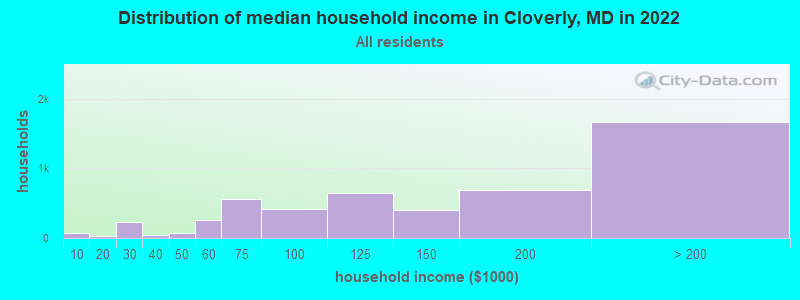
Cloverly, MD household income distribution

- 73Less than $10,000
- 26$10,000 to $19,999
- 234$20,000 to $29,999
- 46$30,000 to $39,999
- 73$40,000 to $49,999
- 256$50,000 to $59,999
- 564$60,000 to $74,999
- 423$75,000 to $99,999
- 645$100,000 to $124,999
- 408$125,000 to $149,999
- 688$150,000 to $199,999
- 1,668$200,000 or more
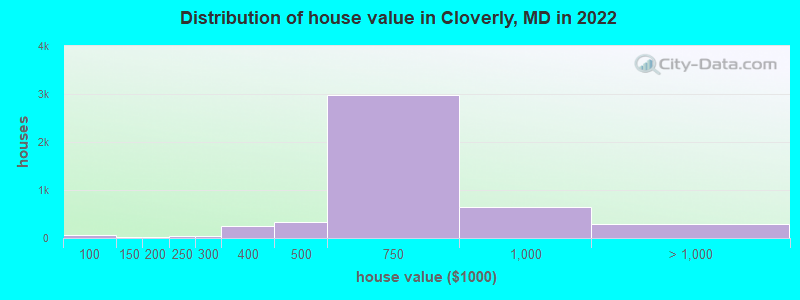
Home value of owner - occupied houses in 2022 in Cloverly, MD
-
- 18$40,000 to $49,999
- 35$60,000 to $69,999
- 7$70,000 to $79,999
- 27$100,000 to $124,999
- 8$150,000 to $174,999
- 11$175,000 to $199,999
- 43$200,000 to $249,999
- 33$250,000 to $299,999
- 255$300,000 to $399,999
- 329$400,000 to $499,999
- 2,985$500,000 to $749,999
- 646$750,000 to $999,999
- 262$1,000,000 to $1,499,999
- 34$2,000,000 or more
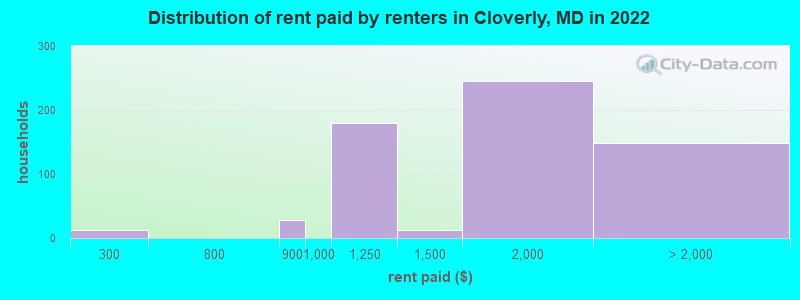
Rent paid by renters in 2022 in Cloverly, MD
-
- 12$200 to $249
- 27$800 to $899
- 179$1,000 to $1,249
- 12$1,250 to $1,499
- 244$1,500 to $1,999
- 91$2,000 to $2,499
- 16$2,500 to $2,999
- 17$3,000 to $3,499
- 10$3,500 or more
- 13No cash rent
Percentage of workers working in this county: 70.0%
Number of people working at home: 2,362 (30.6% of all workers)
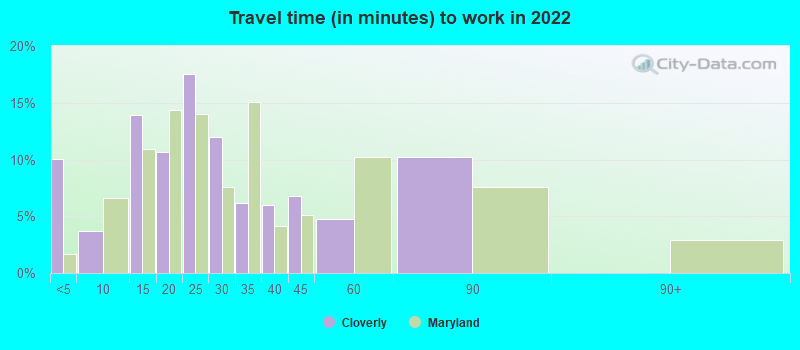
Travel time to work (commute)
- Less than 5 minutes: 125
- 5 to 9 minutes: 128
- 10 to 14 minutes: 392
- 15 to 19 minutes: 661
- 20 to 24 minutes: 631
- 25 to 29 minutes: 599
- 30 to 34 minutes: 726
- 35 to 39 minutes: 230
- 40 to 44 minutes: 630
- 45 to 59 minutes: 571
- 60 to 89 minutes: 639
- 90 or more minutes: 90
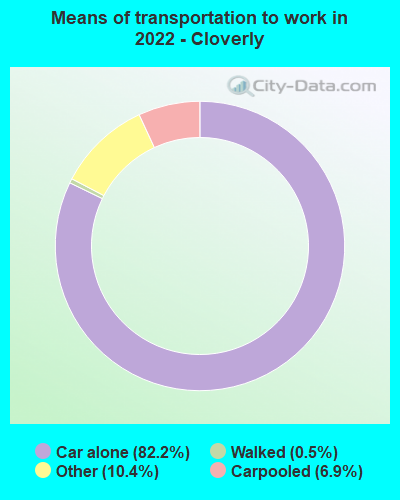
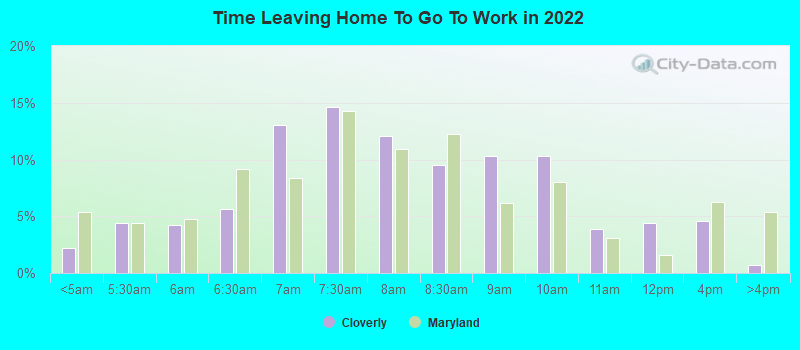
Means of transportation to work:
- Drove a car alone: 1,113 (33.4%)
- Carpooled: 100 (3.0%)
- Taxi: 151 (4.5%)
- Walked: 5 (0.1%)
- Worked at home: 2,362 (70.8%)
- Unemployment by race in 2022
- Unemployment rate for White non-Hispanic residents
- 1.3%Males
- 2.3%Females
- Unemployment rate for Black residents
- 2.2%Males
- 14.1%Females
- Unemployment rate for Asian residents
- 1.1%Males
- Unemployment rate for other race residents
- 13.8%Males
- Unemployment rate for two or more race residents
- 30.4%Females
- Unemployment rate for Hispanic or Latino residents
- 10.1%Males
- 5.4%Females
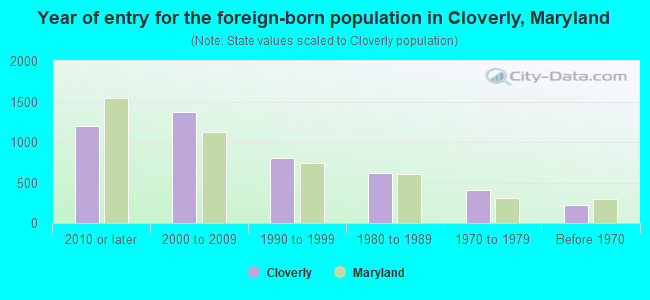
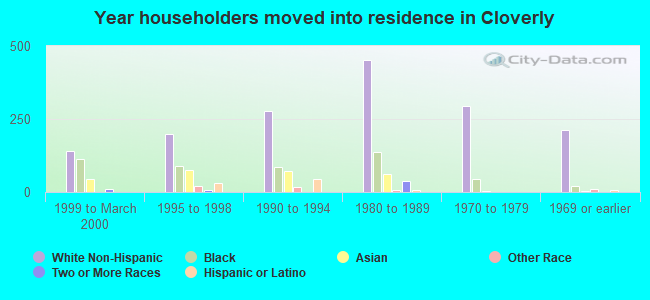
- Year of entry for the foreign-born population in Cloverly, Maryland
- 1,1992010 or later
- 1,3722000 to 2009
- 7981990 to 1999
- 6201980 to 1989
- 4111970 to 1979
- 217Before 1970
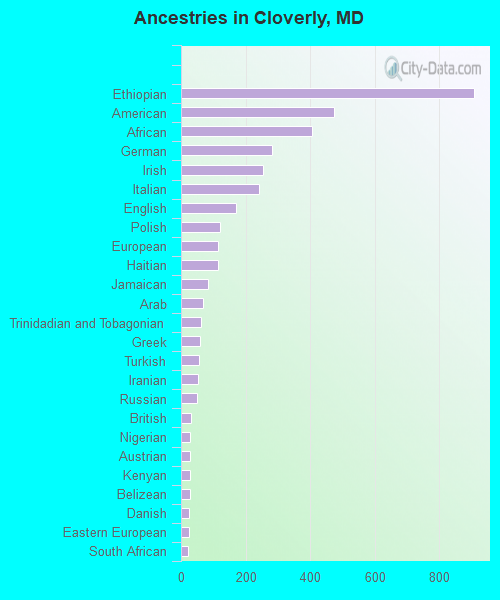
First ancestries reported:
- Ethiopian: 908 (8.7%)
- American: 475 (4.6%)
- African: 405 (3.9%)
- German: 281 (2.7%)
- Irish: 254 (2.4%)
- Italian: 240 (2.3%)
- English: 171 (1.6%)
- Polish: 121 (1.2%)
- European: 116 (1.1%)
- Haitian: 116 (1.1%)
- Jamaican: 84 (0.8%)
- Arab: 69 (0.7%)
- Trinidadian and Tobagonian: 62 (0.6%)
- Greek: 59 (0.6%)
- Turkish: 57 (0.5%)
- Iranian: 52 (0.5%)
- Russian: 48 (0.5%)
- British: 32 (0.3%)
- Nigerian: 29 (0.3%)
- Austrian: 29 (0.3%)
- Kenyan: 28 (0.3%)
- Belizean: 27 (0.3%)
- Danish: 26 (0.3%)
- Eastern European: 25 (0.2%)
- South African: 23 (0.2%)
- Swiss: 21 (0.2%)
- Hungarian: 20 (0.2%)
- Scotch-Irish: 18 (0.2%)
- Ukrainian: 16 (0.2%)
- Somali: 16 (0.2%)
- Portuguese: 15 (0.1%)
- West Indian: 15 (0.1%)
- Lebanese: 13 (0.1%)
- Norwegian: 13 (0.1%)
- Scottish: 12 (0.1%)
- Brazilian: 12 (0.1%)
- Albanian: 12 (0.1%)
- Welsh: 9 (0.09%)
- Belgian: 8 (0.08%)
- Scandinavian: 7 (0.07%)
- Czech: 7 (0.07%)
- Croatian: 6 (0.06%)
- Dutch: 6 (0.06%)
- Alsatian: 5 (0.05%)
- Moroccan: 5 (0.05%)
- Guyanese: 4 (0.04%)
- Egyptian: 3 (0.03%)
- Afghan: 2 (0.02%)
Most common places of birth for foreign-born residents (%):
| Cloverly: | 14.1% (799) |
| Maryland: | 12.0% (115,412) |
| Cloverly: | 13.9% (783) |
| Maryland: | 3.2% (30,870) |
| Cloverly: | 4.9% (275) |
| Maryland: | 6.4% (61,725) |
| Cloverly: | 4.3% (244) |
| Maryland: | 4.4% (42,350) |
| Cloverly: | 4.1% (232) |
| Maryland: | 1.0% (9,481) |
| Cloverly: | 4.0% (225) |
| Maryland: | 1.9% (18,716) |
| Cloverly: | 3.7% (208) |
| Maryland: | 0.7% (7,124) |
| Cloverly: | 2.7% (155) |
| Maryland: | 0.1% (1,441) |
| Cloverly: | 2.7% (153) |
| Maryland: | 1.8% (17,037) |
| Cloverly: | 2.7% (153) |
| Maryland: | 0.5% (4,596) |
| Cloverly: | 2.6% (148) |
| Maryland: | 0.9% (8,520) |
| Cloverly: | 2.5% (139) |
| Maryland: | 3.4% (32,635) |
| Cloverly: | 2.3% (132) |
| Maryland: | 0.1% (1,262) |
| Cloverly: | 1.8% (101) |
| Maryland: | 1.3% (12,898) |
| Cloverly: | 1.5% (86) |
| Maryland: | 3.8% (36,698) |
| Cloverly: | 1.5% (86) |
| Maryland: | 0.6% (6,211) |
Place of birth for U.S.-born residents:
- This state: 5,053
- Other state: 5,411
- Northeast: 1,646
- Midwest: 419
- South: 3,064
- West: 276
93.2% of Cloverly residents lived in the same house 1 years ago.
Out of people who lived in different houses, 31.1% lived in this county.
Out of people who lived in different counties, 59.7% lived in Maryland.
| Cloverly: | 93.2% |
| State average: | 88.5% |
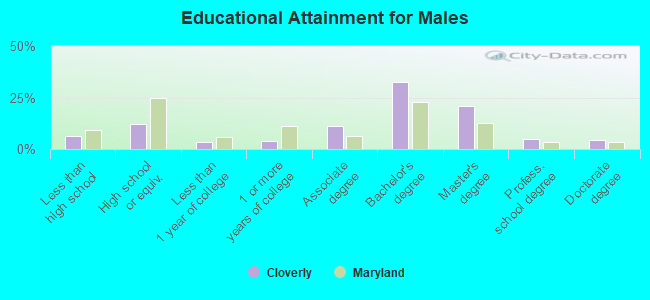
Education attainment for males 25 years and older:
- No schooling: 109
- Nursery to 4th grade: 5
- 5th and 6th grade: 187
- 7th and 8th grade: 0
- 9th grade: 8
- 10th grade: 15
- 11th grade: 13
- 12th grade, no diploma: 50
- High school graduate (or equivalency): 721
- Less than 1 year of college: 208
- Some college more than 1 year, no degree: 240
- Associate degree: 668
- Bachelor's degree: 1,956
- Master's degree: 1,252
- Professional school degree: 282
- Doctorate degree: 269
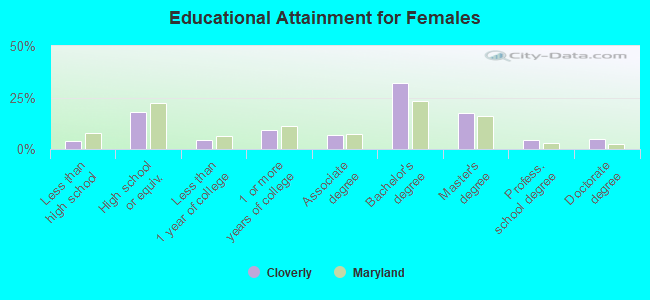
Education attainment for females 25 years and older:
- No schooling: 38
- Nursery to 4th grade: 0
- 5th and 6th grade: 47
- 7th and 8th grade: 47
- 9th grade: 0
- 10th grade: 24
- 11th grade: 0
- 12th grade, no diploma: 47
- High school graduate (or equivalency): 978
- Less than 1 year of college: 249
- Some college more than 1 year, no degree: 503
- Associate degree: 360
- Bachelor's degree: 1,741
- Master's degree: 942
- Professional school degree: 233
- Doctorate degree: 256
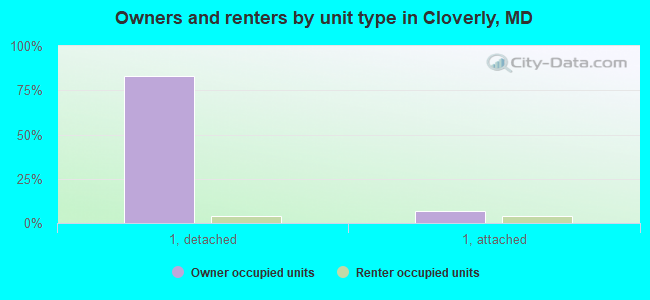
Housing units in structures:
- One, detached: 4,499
- One, attached: 702
- Two: 5
- 5 to 9: 8
- 10 to 19: 47
- Mobile homes: 5
Housing units lacking complete kitchen facilities in 2022: 0.1%
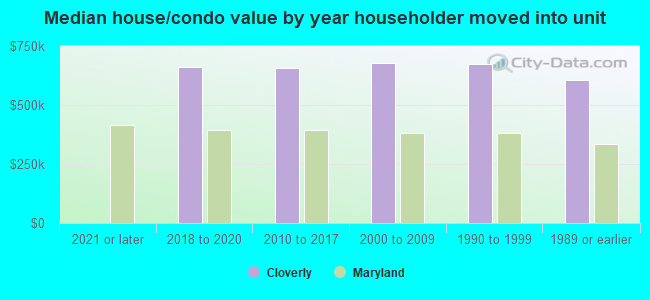
House/condo owner moved in on average 16 years ago
Renter moved in on average 4 years ago
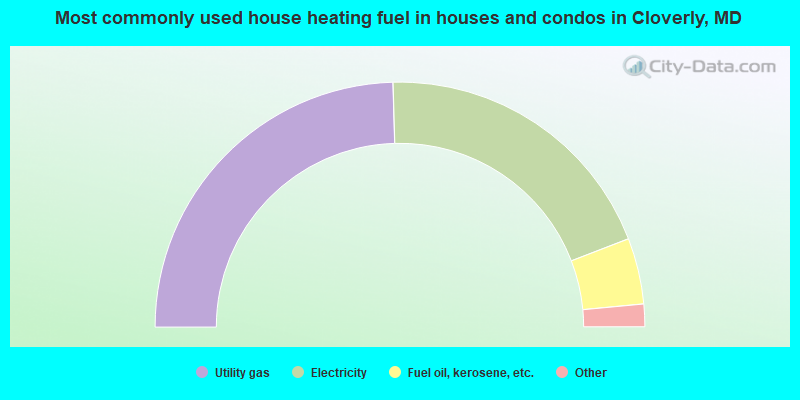
- 49.1%Utility gas
- 39.2%Electricity
- 8.7%Fuel oil, kerosene, etc.
- 1.5%Solar energy
- 0.7%Wood
- 0.5%No fuel used
- 0.2%Bottled, tank, or LP gas
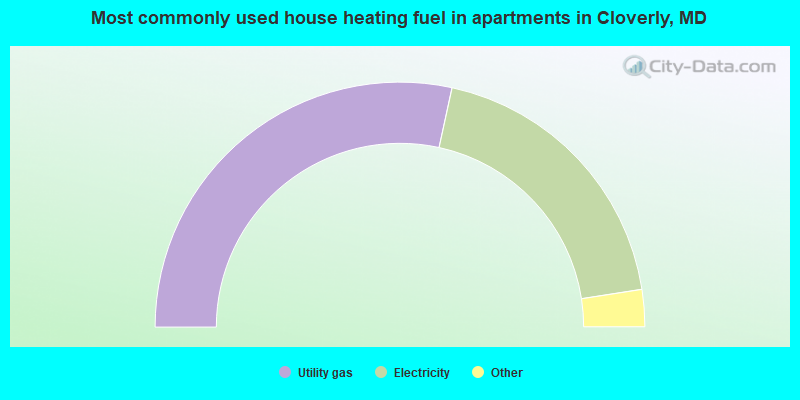
- 56.9%Utility gas
- 38.3%Electricity
- 2.6%Bottled, tank, or LP gas
- 2.1%Fuel oil, kerosene, etc.
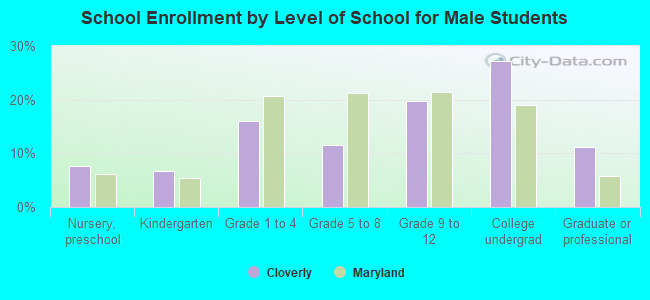
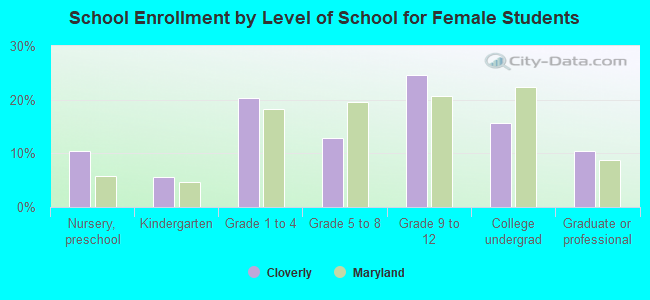
Private vs. public school enrollment:
| Here: | 14.6% |
| Maryland: | 15.2% |
| Here: | 4.6% |
| Maryland: | 14.4% |
| Here: | 22.6% |
| Maryland: | 20.2% |