College Park, GA (Georgia) Houses and Residents
Estimated median house or condo value in 2022: $322,051 (it was $97,400 in 2000 )
College Park:
$322,051Georgia:
$297,400
Lower value quartile - upper value quartile: $234,839 - $418,955Mean price in 2022: Detached houses: $302,407 Here:
$302,407State:
$376,364
Townhouses or other attached units: $179,492 Here:
$179,492State:
$341,709
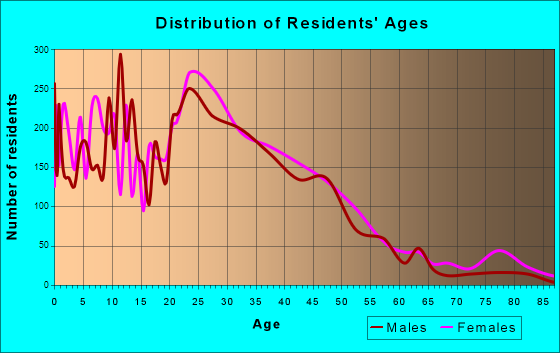
Total population: 14,598 (All urban)
Houses: 7,491 (6,128 occupied: 1,478 owner occupied, 4,714 renter occupied )
% of renters here:
76%State:
34%
Housing density: 772 houses/condos per square mile
Median price asked for vacant for-sale houses and condos in 2022: $486,224.
Median contract rent in 2022: $951 (lower quartile is $775, upper quartile is $1,160)
Median rent asked for vacant for-rent units in 2022: $1,119
Median gross rent in College Park, GA in 2022: $1,109
Housing units in College Park with a mortgage: 1,132 (96 second mortgage, 0 home equity loan, 103 both second mortgage and home equity loan )Houses without a mortgage: 0
Median household income for houses/condos with a mortgage: $103,288
Median household income for apartments without a mortgage: $112,391
Median monthly housing costs: $1,109
Data:
Median house or condo value ($)
Median house or condo value ($ change since 2000)
Median house or condo value ($) - White
Median house or condo value ($) - Black or African American
Median house or condo value ($) - Asian
Median house or condo value ($) - Hispanic or Latino
Median house or condo value ($) - American Indian and Alaska Native
Median house or condo value ($) - Multirace
Median house or condo value ($) - Other Race
Median price asked for mobile homes ($)
Household density (households per square mile)
Mean house or condo value by units in structure - 1, detached ($)
Mean house or condo value by units in structure - 1, attached ($)
Mean house or condo value by units in structure - 2 ($)
Mean house or condo value by units in structure by units in structure - 3 or 4 ($)
Mean house or condo value by units in structure - 5 or more ($)
Mean house or condo value by units in structure - Boat, RV, van, etc. ($)
Mean house or condo value by units in structure - Mobile home ($)
Median contract rent ($)
Median contract rent - Lower quartile ($)
Median contract rent - Upper quartile ($)
Median gross rent ($)
Urban houses (%)
Rural houses (%)
Houses occupied (%)
Houses occupied (% change since 2000)
Houses owner occupied (%)
Houses owner occupied (% change since 2000)
Houses renter occupied (%)
Houses renter occupied (% change since 2000)
Vacant housing units - For rent (%)
Vacant housing units - For rent (% change since 2000)
Vacant housing units - For sale only (%)
Vacant housing units - For sale only (% change since 2000)
Vacant housing units - Rented or sold, not occupied (%)
Vacant housing units - Rented or sold, not occupied (% change since 2000)
Vacant housing units - For seasonal, recreational, or occasional use (%)
Vacant housing units - For seasonal, recreational, or occasional use (% change since 2000)
Vacant housing units - For migrant workers (%)
Vacant housing units - For migrant workers (% change since 2000)
Vacant housing units - Other vacant (%)
Vacant housing units - Other vacant (% change since 2000)
Median monthly housing costs ($)
Median household income for houses/condos with a mortgage ($)
Median household income for houses/condos without a mortgage ($)
Median household income ($)
Median household income ($) - White
Median household income ($) - Black or African American
Median household income ($) - Asian
Median household income ($) - Hispanic or Latino
Median household income ($) - American Indian and Alaska Native
Median household income ($) - Multirace
Median household income ($) - Other Race
Mortgage status - with mortgage (%)
Mortgage status - with second mortgage (%)
Mortgage status - with home equity loan (%)
Mortgage status - with both second mortgage and home equity loan (%)
Mortgage status - without a mortgage (%)
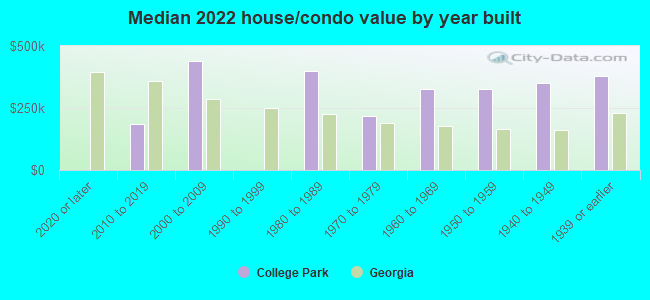
Median year house/condo built
Median year apartment built
Household type by relationship - Male householder living alone (%)
Household type by relationship - Male householder not living alone (%)
Household type by relationship - Female householder living alone (%)
Household type by relationship - Female householder not living alone (%)
Household type by relationship - Opposite-Sex spouse (%)
Household type by relationship - Same-Sex spouse (%)
Household type by relationship - Opposite-Sex unmarried partner (%)
Household type by relationship - Same-Sex unmarried partner (%)
Household type by relationship - In group quarters (%)
Size of family households - 2-person household (%)
Size of family households - 3-person household (%)
Size of family households - 4-person household (%)
Size of family households - 5-person household (%)
Size of family households - 6-person household (%)
Size of family households - 7-or-more-person household (%)
Size of nonfamily households - 1-person household (%)
Size of nonfamily households - 2-person household (%)
Size of nonfamily households - 3-person household (%)
Size of nonfamily households - 4-person household (%)
Size of nonfamily households - 5-person household (%)
Size of nonfamily households - 6-person household (%)
Size of nonfamily households - 7-or-moreperson household (%)
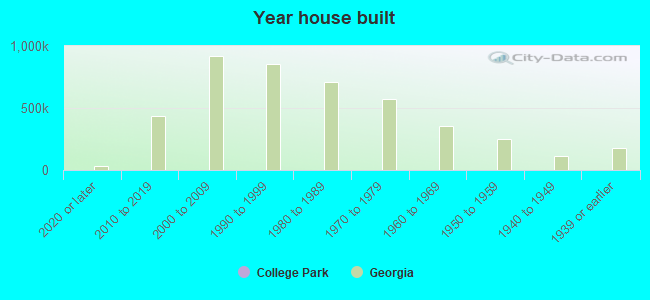
Year house built - Built 2010 or later (%)
Year house built - Built 2000 to 2009 (%)
Year house built - Built 1990 to 1999 (%)
Year house built - Built 1980 to 1989 (%)
Year house built - Built 1970 to 1979 (%)
Year house built - Built 1960 to 1969 (%)
Year house built - Built 1950 to 1959 (%)
Year house built - Built 1940 to 1949 (%)
Year house built - Built 1939 or earlier (%)
Median number of rooms in houses and condos
Median number of rooms in apartments
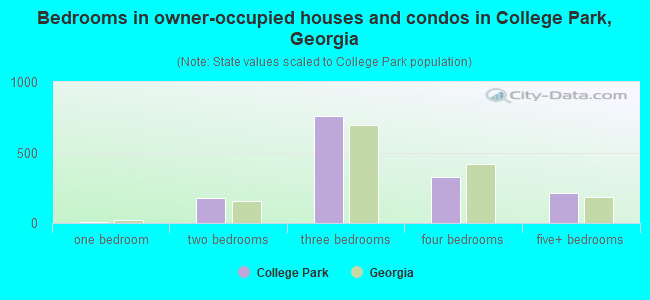
Median number of bedrooms in owner occupied houses
Mean number of bedrooms in owner occupied houses
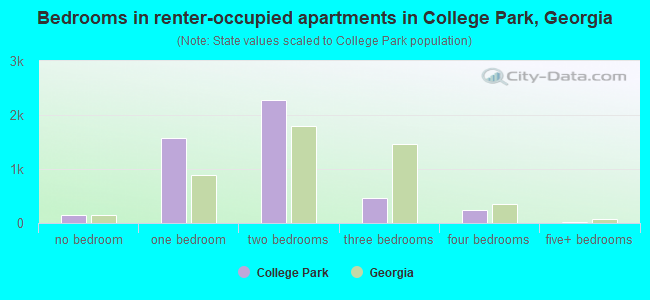
Median number of bedrooms in renter occupied houses
Mean number of bedrooms in renter occupied houses
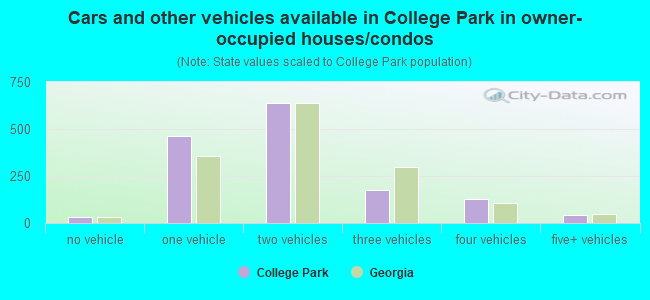
Median number of vehichles in owner occupied houses
Mean number of vehichles in owner occupied houses
Median number of vehichles in renter occupied houses
Mean number of vehichles in renter occupied houses
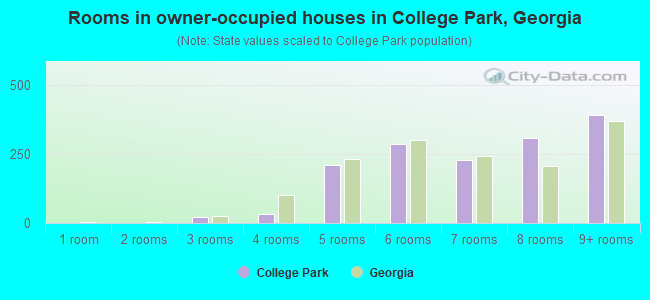
Rooms in owner-occupied houses - 1 room (%)
Rooms in owner-occupied houses - 2 rooms (%)
Rooms in owner-occupied houses - 3 rooms (%)
Rooms in owner-occupied houses - 4 rooms (%)
Rooms in owner-occupied houses - 5 rooms (%)
Rooms in owner-occupied houses - 6 rooms (%)
Rooms in owner-occupied houses - 7 rooms (%)
Rooms in owner-occupied houses - 8 rooms (%)
Rooms in owner-occupied houses - 9+ rooms (%)
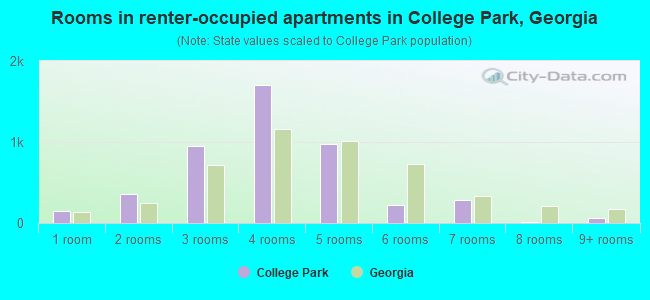
Rooms in renter-occupied houses - 1 room (%)
Rooms in renter-occupied houses - 2 rooms (%)
Rooms in renter-occupied houses - 3 rooms (%)
Rooms in renter-occupied houses - 4 rooms (%)
Rooms in renter-occupied houses - 5 rooms (%)
Rooms in renter-occupied houses - 6 rooms (%)
Rooms in renter-occupied houses - 7 rooms (%)
Rooms in renter-occupied houses - 8 rooms (%)
Rooms in renter-occupied houses - 9+ rooms (%)
Bedrooms in owner-occupied houses - no bedrooms (%)
Bedrooms in owner-occupied houses - 1 bedroom (%)
Bedrooms in owner-occupied houses - 2 bedrooms (%)
Bedrooms in owner-occupied houses - 3 bedrooms (%)
Bedrooms in owner-occupied houses - 4 bedrooms (%)
Bedrooms in owner-occupied houses - 5+ bedrooms (%)
Bedrooms in renter-occupied houses - no bedrooms (%)
Bedrooms in renter-occupied houses - 1 bedroom (%)
Bedrooms in renter-occupied houses - 2 bedrooms (%)
Bedrooms in renter-occupied houses - 3 bedrooms (%)
Bedrooms in renter-occupied houses - 4 bedrooms (%)
Bedrooms in renter-occupied houses - 5+ bedrooms (%)
Vehicles available in owner-occupied houses - no vehicle available (%)
Vehicles available in owner-occupied houses - 1 vehicle available(%)
Vehicles available in owner-occupied houses - 2 Vehicles available (%)
Vehicles available in owner-occupied houses - 3 Vehicles available (%)
Vehicles available in owner-occupied houses - 4 Vehicles available (%)
Vehicles available in owner-occupied houses - 5+ Vehicles available (%)
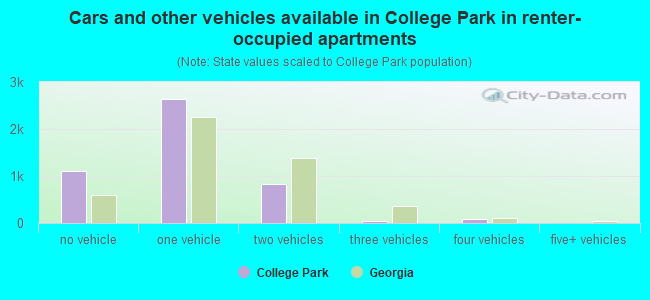
Vehicles available in renter-occupied houses - no vehicle available (%)
Vehicles available in renter-occupied houses - 1 vehicle available (%)
Vehicles available in renter-occupied houses - 2 Vehicles available (%)
Vehicles available in renter-occupied houses - 3 Vehicles available (%)
Vehicles available in renter-occupied houses - 4 Vehicles available (%)
Vehicles available in renter-occupied houses - 5+ Vehicles available (%)
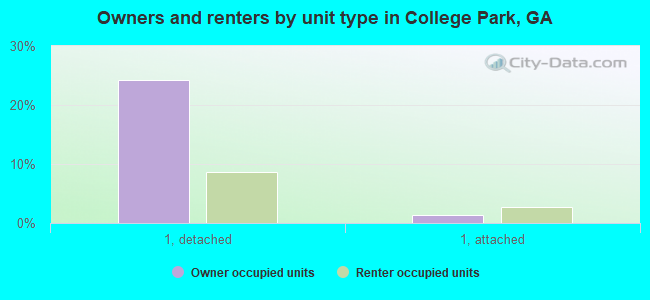
Housing units in structures - 1, detached (%)
Housing units in structures - 1, attached (%)
Housing units in structures - 2 (%)
Housing units in structures - 3 or 4 (%)
Housing units in structures - 5 to 9 (%)
Housing units in structures - 10 to 19 (%)
Housing units in structures - 20 to 49 (%)
Housing units in structures - 50 or more (%)
Housing units in structures - Mobile home (%)
Housing units in structures - Boat, RV, van, etc. (%)
Housing units in structures - Owners - 1, detached (%)
Housing units in structures - Owners - 1, attached (%)
Housing units in structures - Owners - 2 (%)
Housing units in structures - Owners - 3 or 4 (%)
Housing units in structures - Owners - 5 to 9 (%)
Housing units in structures - Owners - 10 to 19 (%)
Housing units in structures - Owners - 20 to 49 (%)
Housing units in structures - Owners - 50 or more (%)
Housing units in structures - Owners - Mobile home (%)
Housing units in structures - Owners - Boat, RV, van, etc. (%)
Housing units in structures - Renters - 1, detached (%)
Housing units in structures - Renters - 1, attached (%)
Housing units in structures - Renters - 2 (%)
Housing units in structures - Renters - 3 or 4 (%)
Housing units in structures - Renters - 5 to 9 (%)
Housing units in structures - Renters - 10 to 19 (%)
Housing units in structures - Renters - 20 to 49 (%)
Housing units in structures - Renters - 50 or more (%)
Housing units in structures - Renters - Mobile home (%)
Housing units in structures - Renters - Boat, RV, van, etc. (%)
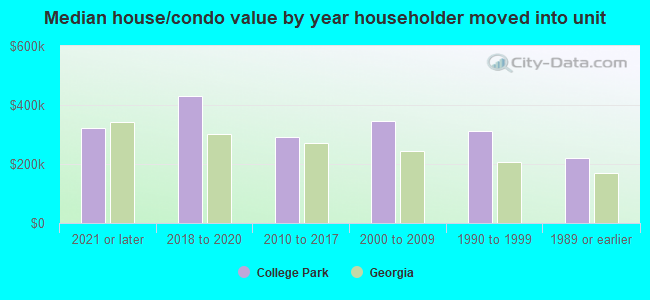
House/condo owner moved in on average (years ago)
Renter moved in on average (years ago)
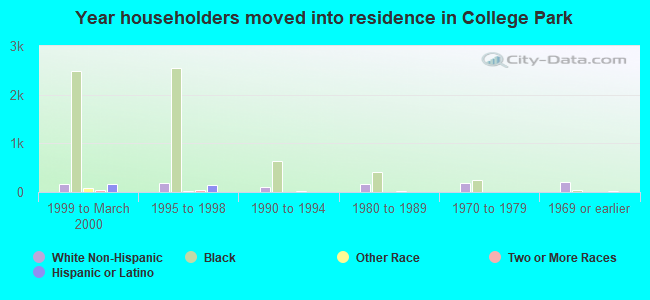
Year householder moved into unit - Moved in 1999 to March 2000 (%)
Year householder moved into unit - Moved in 1999 to March 2000 (%) - White
Year householder moved into unit - Moved in 1999 to March 2000 (%) - Black or African American
Year householder moved into unit - Moved in 1999 to March 2000 (%) - Asian
Year householder moved into unit - Moved in 1999 to March 2000 (%) - Hispanic or Latino
Year householder moved into unit - Moved in 1999 to March 2000 (%) - American Indian and Alaska Native
Year householder moved into unit - Moved in 1999 to March 2000 (%) - Multirace
Year householder moved into unit - Moved in 1999 to March 2000 (%) - Other Race
Year householder moved into unit - Moved in 1995 to 1998 (%)
Year householder moved into unit - Moved in 1995 to 1998 (%) - White
Year householder moved into unit - Moved in 1995 to 1998 (%) - Black or African American
Year householder moved into unit - Moved in 1995 to 1998 (%) - Asian
Year householder moved into unit - Moved in 1995 to 1998 (%) - Hispanic or Latino
Year householder moved into unit - Moved in 1995 to 1998 (%) - American Indian and Alaska Native
Year householder moved into unit - Moved in 1995 to 1998 (%) - Multirace
Year householder moved into unit - Moved in 1995 to 1998 (%) - Other Race
Year householder moved into unit - Moved in 1990 to 1994 (%)
Year householder moved into unit - Moved in 1990 to 1994 (%) - White
Year householder moved into unit - Moved in 1990 to 1994 (%) - Black or African American
Year householder moved into unit - Moved in 1990 to 1994 (%) - Asian
Year householder moved into unit - Moved in 1990 to 1994 (%) - Hispanic or Latino
Year householder moved into unit - Moved in 1990 to 1994 (%) - American Indian and Alaska Native
Year householder moved into unit - Moved in 1990 to 1994 (%) - Multirace
Year householder moved into unit - Moved in 1990 to 1994 (%) - Other Race
Year householder moved into unit - Moved in 1980 to 1989 (%)
Year householder moved into unit - Moved in 1980 to 1989 (%) - White
Year householder moved into unit - Moved in 1980 to 1989 (%) - Black or African American
Year householder moved into unit - Moved in 1980 to 1989 (%) - Asian
Year householder moved into unit - Moved in 1980 to 1989 (%) - Hispanic or Latino
Year householder moved into unit - Moved in 1980 to 1989 (%) - American Indian and Alaska Native
Year householder moved into unit - Moved in 1980 to 1989 (%) - Multirace
Year householder moved into unit - Moved in 1980 to 1989 (%) - Other Race
Year householder moved into unit - Moved in 1970 to 1979 (%)
Year householder moved into unit - Moved in 1970 to 1979 (%) - White
Year householder moved into unit - Moved in 1970 to 1979 (%) - Black or African American
Year householder moved into unit - Moved in 1970 to 1979 (%) - Asian
Year householder moved into unit - Moved in 1970 to 1979 (%) - Hispanic or Latino
Year householder moved into unit - Moved in 1970 to 1979 (%) - American Indian and Alaska Native
Year householder moved into unit - Moved in 1970 to 1979 (%) - Multirace
Year householder moved into unit - Moved in 1970 to 1979 (%) - Other Race
Year householder moved into unit - Moved in 1969 or earlier (%)
Year householder moved into unit - Moved in 1969 or earlier (%) - White
Year householder moved into unit - Moved in 1969 or earlier (%) - Black or African American
Year householder moved into unit - Moved in 1969 or earlier (%) - Asian
Year householder moved into unit - Moved in 1969 or earlier (%) - Hispanic or Latino
Year householder moved into unit - Moved in 1969 or earlier (%) - American Indian and Alaska Native
Year householder moved into unit - Moved in 1969 or earlier (%) - Multirace
Year householder moved into unit - Moved in 1969 or earlier (%) - Other Race
Housing units lacking complete plumbing facilities (%)
Housing units lacking complete kitchen facilities (%)
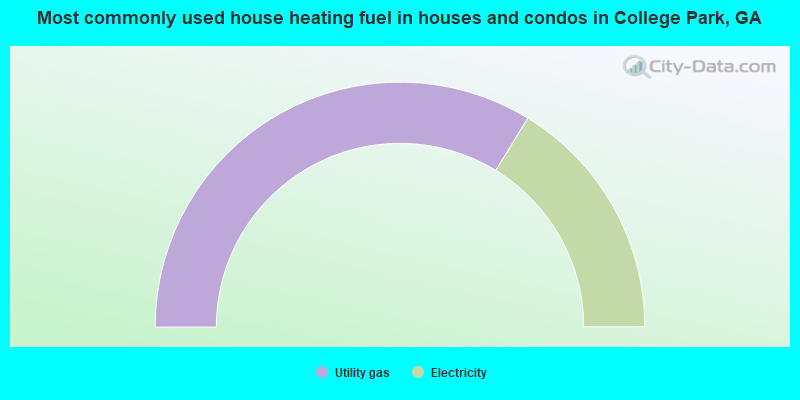
House heating fuel used in houses and condos - Utility gas (%)
House heating fuel used in houses and condos - Bottled, tank, or LP gas (%)
House heating fuel used in houses and condos - Electricity (%)
House heating fuel used in houses and condos - Fuel oil, kerosene, etc. (%)
House heating fuel used in houses and condos - Coal or coke (%)
House heating fuel used in houses and condos - Wood (%)
House heating fuel used in houses and condos - Solar energy (%)
House heating fuel used in houses and condos - Other fuel (%)
House heating fuel used in houses and condos - No fuel used (%)
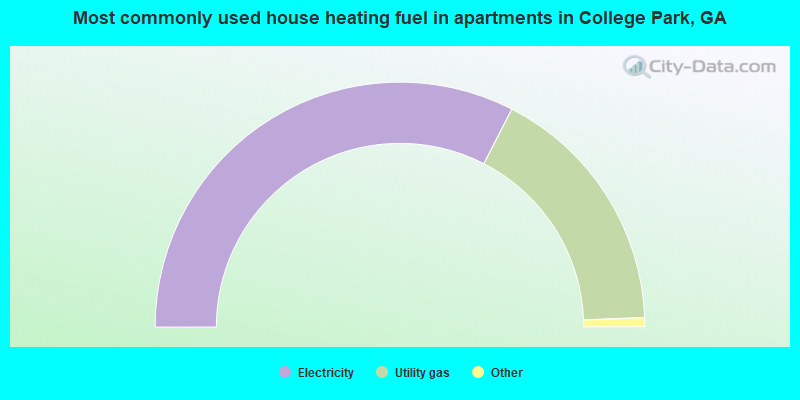
House heating fuel used in apartments - Utility gas (%)
House heating fuel used in apartments - Bottled, tank, or LP gas (%)
House heating fuel used in apartments - Electricity (%)
House heating fuel used in apartments - Fuel oil, kerosene, etc. (%)
House heating fuel used in apartments - Coal or coke (%)
House heating fuel used in apartments - Wood (%)
House heating fuel used in apartments - Solar energy (%)
House heating fuel used in apartments - Other fuel (%)
House heating fuel used in apartments - No fuel used (%)
Median year house/condo built: 1960Median year apartment built: 1974Household type by relationship:
Households: 14,281
Male householders: 2,728 (1,169 living alone ), Female householders: 3,359 (1,072 living alone )1,311 spouses (1,286 opposite-sex spouses ), 475 unmarried partners , (373 opposite-sex unmarried partners ), 4,612 children (4,362 natural , 14 adopted , 235 stepchildren ), 542 grandchildren , 376 brothers or sisters , 222 parents , 0 foster children , 274 other relatives , 349 non-relatives In group quarters: 29
Size of family households: 1,589 2-persons , 750 3-persons , 358 4-persons , 466 5-persons , 48 6-persons , 69 7-or-more-persons .
Size of nonfamily households: 2,285 1-person , 624 2-persons , 25 3-persons .
1,029 married couples with children. single-parent households (393 men , 1,829 women ).
91.0% of residents of College Park speak English at home. of residents speak Spanish at home (64% speak English very well , 9% speak English well , 26% don't speak English at all ).of residents speak other Indo-European language at home (89% speak English very well , 11% speak English not well ).of residents speak Asian or Pacific Island language at home (78% speak English very well , 22% speak English well ).of residents speak other language at home (91% speak English very well , 9% speak English well ).
Foreign born population: 854 (6.0%)of them are naturalized citizens )
Median number of rooms in houses and condos:
Median number of rooms in apartments
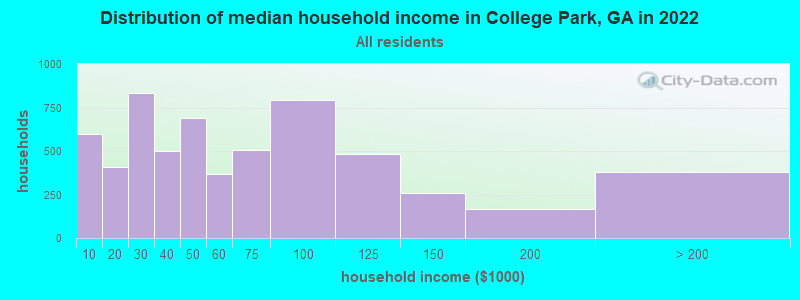
College Park, GA household income distribution 597 Less than $10,000410 $10,000 to $19,999833 $20,000 to $29,999502 $30,000 to $39,999690 $40,000 to $49,999365 $50,000 to $59,999506 $60,000 to $74,999794 $75,000 to $99,999481 $100,000 to $124,999261 $125,000 to $149,999168 $150,000 to $199,999382 $200,000 or more
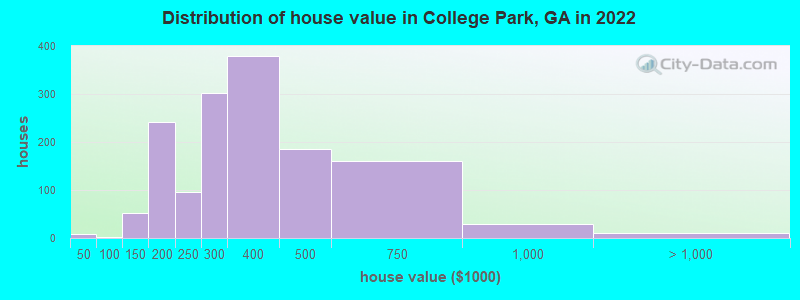
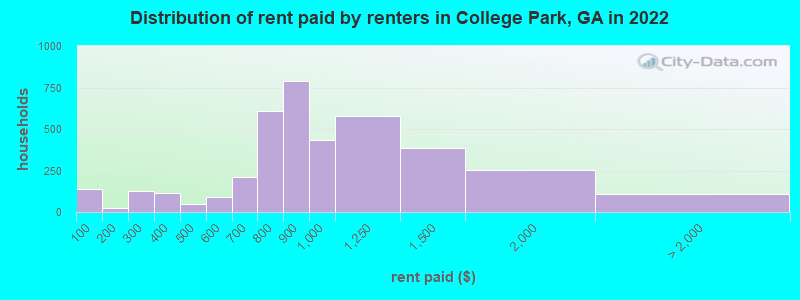
Home value of owner - occupied houses in 2022 in College Park, GA 7 $15,000 to $19,9993 $90,000 to $99,99935 $100,000 to $124,99916 $125,000 to $149,99973 $150,000 to $174,999168 $175,000 to $199,99994 $200,000 to $249,999302 $250,000 to $299,999379 $300,000 to $399,999186 $400,000 to $499,999160 $500,000 to $749,99930 $750,000 to $999,99910 $1,000,000 to $1,499,999Rent paid by renters in 2022 in College Park, GA 137 Less than $10022 $150 to $19957 $200 to $24970 $250 to $2999 $300 to $349102 $350 to $39946 $400 to $44958 $500 to $54930 $550 to $59919 $600 to $649191 $650 to $699226 $700 to $749383 $750 to $799790 $800 to $899432 $900 to $999576 $1,000 to $1,249383 $1,250 to $1,499252 $1,500 to $1,99936 $3,000 to $3,49972 No cash rent
Percentage of workers working in this county: 71.1%Number of people working at home: 864 (12.8% of all workers )
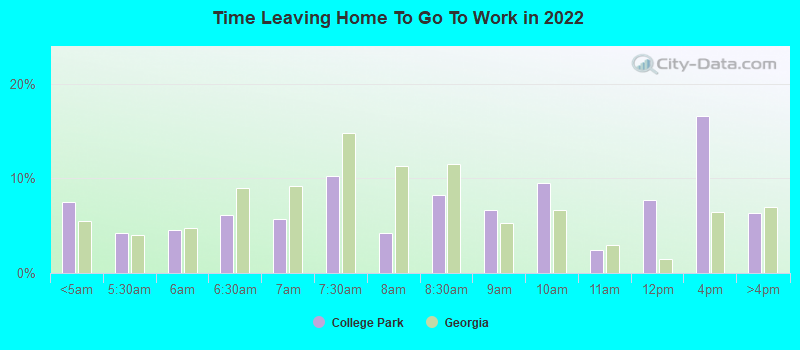
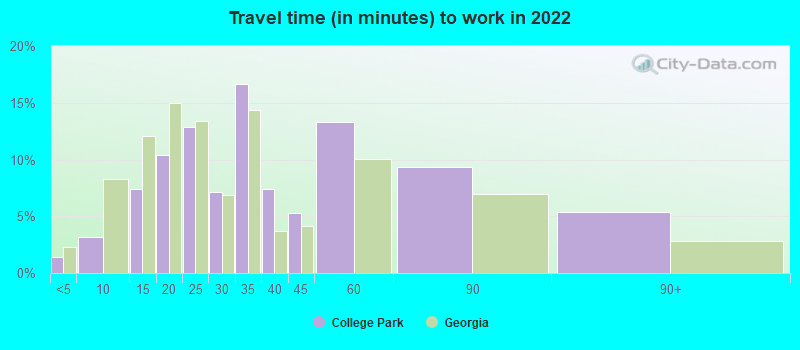
Travel time to work (commute)
Less than 5 minutes: 2685 to 9 minutes: 56310 to 14 minutes: 77015 to 19 minutes: 1,18720 to 24 minutes: 83525 to 29 minutes: 9330 to 34 minutes: 71735 to 39 minutes: 35740 to 44 minutes: 13245 to 59 minutes: 33260 to 89 minutes: 18790 or more minutes: 152
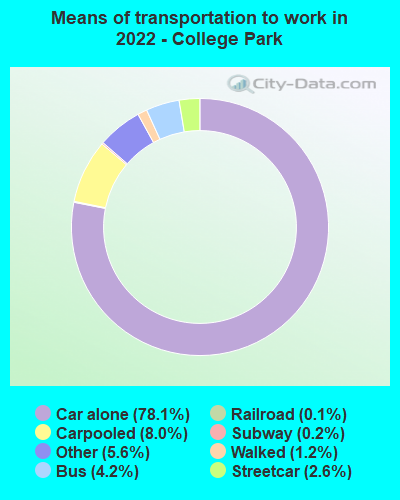
Means of transportation to work:
Drove a car alone: 27,741 (72.7%)Carpooled: 3,118 (8.2%)Bus : 1,117 (2.9%)Subway or elevated rail : 564 (1.5%)Long-distance train or commuter rail : 40 (0.1%)Light rail, streetcar or trolley : 50 (0.1%)Ferryboat: 16 (0.0%)Taxi: 1,824 (4.8%)Bicycle: 18 (0.0%)Walked: 427 (1.1%)Worked at home: 864 (2.3%)
Unemployment by race in 2022
Unemployment rate for White non-Hispanic residents 2.9% Males7.0% FemalesUnemployment rate for Black residents 16.4% Males10.0% FemalesUnemployment rate for two or more race residents 5.7% FemalesUnemployment rate for Hispanic or Latino residents 14.6% Females
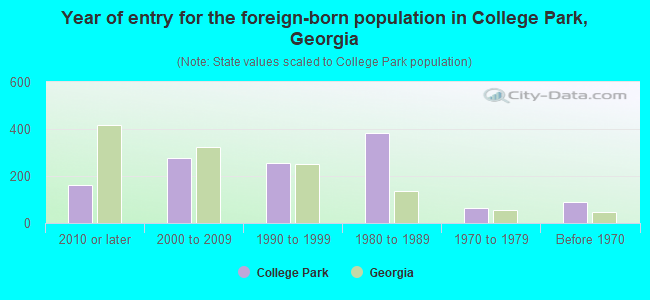
Year of entry for the foreign-born population in College Park, Georgia
163 2010 or later 278 2000 to 2009 255 1990 to 1999 384 1980 to 1989 64 1970 to 1979 91 Before 1970
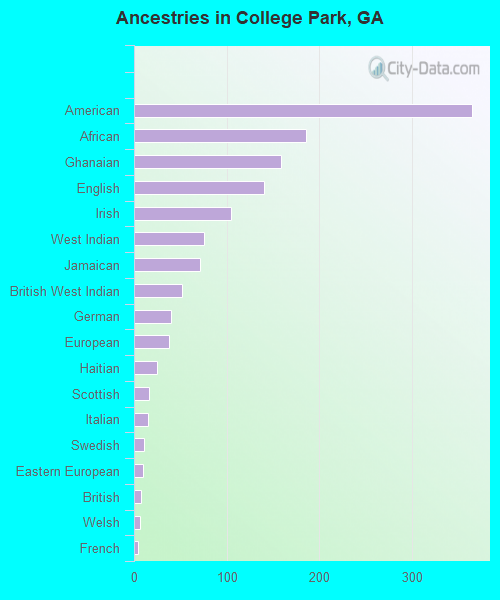
First ancestries reported:
American: 365 (3.3%)
African: 186 (1.7%)
Ghanaian: 159 (1.4%)
English: 140 (1.3%)
Irish: 105 (0.9%)
West Indian: 76 (0.7%)
Jamaican: 71 (0.6%)
British West Indian: 52 (0.5%)
German: 40 (0.4%)
European: 38 (0.3%)
Haitian: 25 (0.2%)
Scottish: 16 (0.1%)
Italian: 15 (0.1%)
Swedish: 11 (0.10%)
Eastern European: 10 (0.09%)
British: 8 (0.07%)
Welsh: 6 (0.05%)
French: 4 (0.04%)
Slovene: 2 (0.02%) Most common places of birth for foreign-born residents (%): Ghana College Park:
19.8% (176)Georgia:
1.0% (11,747)
Honduras College Park:
15.5% (138)Georgia:
2.1% (23,500)
Trinidad and Tobago College Park:
9.7% (86)Georgia:
0.8% (8,684)
Jamaica College Park:
8.5% (76)Georgia:
4.6% (51,270)
Other Western Africa College Park:
6.6% (59)Georgia:
0.4% (4,565)
India College Park:
6.3% (56)Georgia:
9.2% (103,325)
Philippines College Park:
5.3% (47)Georgia:
1.8% (20,700)
Thailand College Park:
4.8% (43)Georgia:
0.4% (4,387)
Senegal College Park:
4.6% (41)Georgia:
0.1% (1,138)
Nigeria College Park:
3.0% (27)Georgia:
2.5% (27,846)
Grenada College Park:
2.0% (18)Georgia:
0.1% (874)
Canada College Park:
1.9% (17)Georgia:
1.6% (17,851)
Cuba College Park:
1.7% (15)Georgia:
1.2% (12,946)
Colombia College Park:
1.7% (15)Georgia:
2.1% (23,813)
United Kingdom, excluding England and Scotland College Park:
1.6% (14)Georgia:
0.8% (9,101)
Place of birth for U.S.-born residents:
This state: 8,322Other state: 4,780Northeast: 817Midwest: 1,379South: 2,361West: 243 82.7% of College Park residents lived in the same house 1 years ago.
Out of people who lived in different houses, 29.8% lived in this county.
Out of people who lived in different counties, 77.3% lived in Georgia.
College Park:
82.7%State average:
86.6%
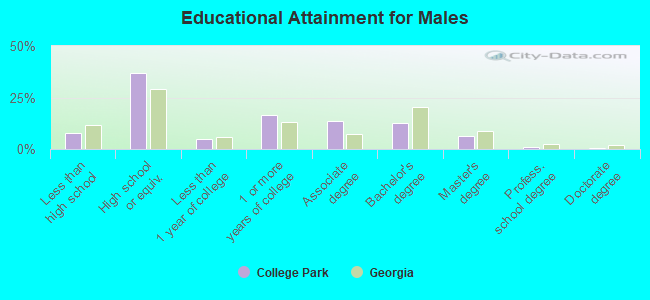
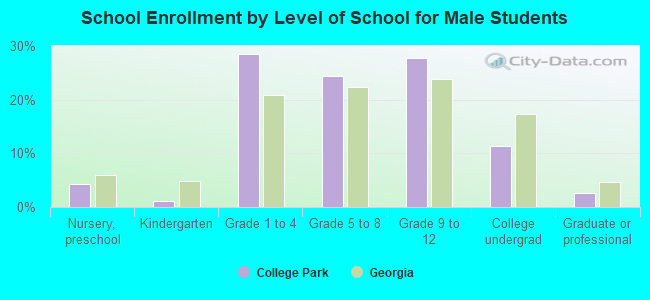
Education attainment for males 25 years and older:
No schooling: 38Nursery to 4th grade: 25th and 6th grade: 597th and 8th grade: 09th grade: 6510th grade: 3011th grade: 6212th grade, no diploma: 63High school graduate (or equivalency): 1,482Less than 1 year of college: 187Some college more than 1 year, no degree: 673Associate degree: 557Bachelor's degree: 500Master's degree: 254Professional school degree: 41Doctorate degree: 20
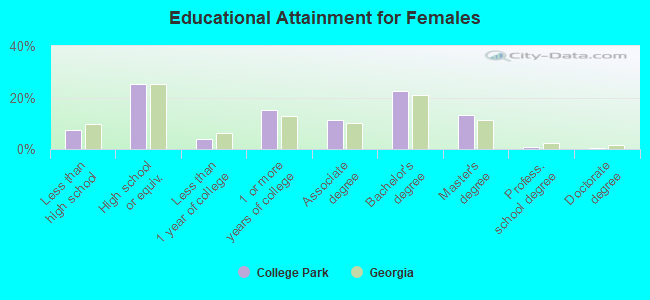
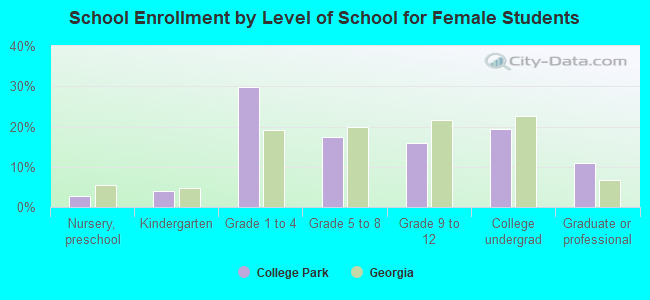
Education attainment for females 25 years and older:
No schooling: 99Nursery to 4th grade: 05th and 6th grade: 497th and 8th grade: 69th grade: 4610th grade: 8411th grade: 6112th grade, no diploma: 16High school graduate (or equivalency): 1,247Less than 1 year of college: 196Some college more than 1 year, no degree: 741Associate degree: 562Bachelor's degree: 1,110Master's degree: 654Professional school degree: 47Doctorate degree: 18
Housing units in structures:
One, detached: 2,379One, attached: 36Two: 1613 or 4: 5775 to 9: 1,85910 to 19: 1,65920 to 49: 53550 or more: 281Housing units lacking complete plumbing facilities in 2022: 5.2%Housing units lacking complete kitchen facilities in 2022: 7.0%House/condo owner moved in on average 9 years ago
Renter moved in on average 3 years ago
Private vs. public school enrollment:
Students in private schools in grades 1 to 8 (elementary and middle school): 321 Students in private schools in grades 9 to 12 (high school): 121 Students in private undergraduate colleges: 242