Columbiaville, MI (Michigan) Houses and Residents
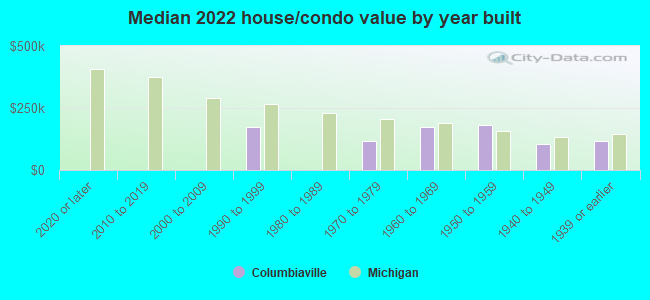
| Columbiaville: | $120,306 |
| Michigan: | $224,400 |
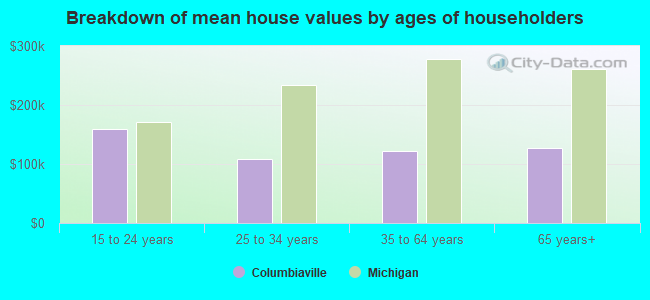
Mean price in 2022:
Detached houses: $137,197
Here: $137,197 State: $280,038 Mobile homes: $85,142
Here: $85,142 State: $72,868
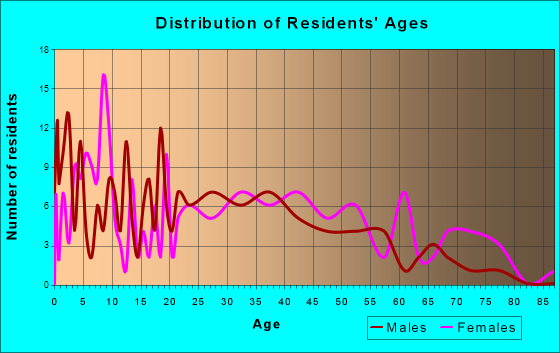
Total population: 781 (Urban population: 0, Rural population: 837 (all nonfarm))
Houses: 357 (338 occupied: 285 owner occupied, 59 renter occupied)
| % of renters here: | 17% |
| State: | 27% |
Housing density: 412 houses/condos per square mile
Median price asked for vacant for-sale houses and condos in 2022 in this county: $128,327.
Median contract rent in 2022: $674 (lower quartile is $490, upper quartile is $902)
Median rent asked for vacant for-rent units in 2022: $567
Median gross rent in Columbiaville, MI in 2022: $912
Housing units in Columbiaville with a mortgage: 190 (8 second mortgage, 0 home equity loan, 8 both second mortgage and home equity loan)
Houses without a mortgage: 0
Median household income for houses/condos with a mortgage: $76,002
Median household income for apartments without a mortgage: $49,909
Median monthly housing costs: $864
Compare current foreclosures near Columbiaville, MI:
| Photo | Address | Area | Beds / Baths | Price | Details |
|---|---|---|---|---|---|

|
#1
Central St
Columbiaville, MI 48421
|
1,729 sq. feet
|
2 baths 5 beds |
show details | |

|
#2
Maple Dr
Columbiaville, MI 48421
|
- sq. feet
|
2 baths 3 beds |
show details | |

|
#3
Bittersweet Dr
Columbiaville, MI 48421
|
- sq. feet
|
- baths - beds |
show details | |

|
#4
Central St # B
Columbiaville, MI 48421
|
- sq. feet
|
- baths - beds |
show details | |

|
#5
Plainfield Ave
Flint, MI 48506
|
941 sq. feet
|
1 baths 3 beds |
$95,500
|
show details |

|
#6
Julie Dr
Columbiaville, MI 48421
|
- sq. feet
|
- baths - beds |
show details | |

|
#7
Conifer Dr
Columbiaville, MI 48421
|
- sq. feet
|
- baths - beds |
show details | |

|
#8
2nd St
Columbiaville, MI 48421
|
- sq. feet
|
- baths - beds |
show details | |

|
#9
Pine St
Columbiaville, MI 48421
|
- sq. feet
|
- baths - beds |
show details | |

|
#10
Skelton Rd
Columbiaville, MI 48421
|
- sq. feet
|
- baths - beds |
show details |
| Photo | Address | Area | Beds / Baths | Price | Details |
|---|---|---|---|---|---|

|
#11
Piersonville Rd
Columbiaville, MI 48421
|
- sq. feet
|
- baths - beds |
show details | |

|
#12
Lakeshore Dr
Columbiaville, MI 48421
|
- sq. feet
|
- baths - beds |
show details | |

|
#13
Lonsberry Rd
Columbiaville, MI 48421
|
- sq. feet
|
- baths - beds |
show details | |

|
#14
Shady Oak Dr
Columbiaville, MI 48421
|
- sq. feet
|
- baths - beds |
show details | |

|
#15
N Main St
Lapeer, MI 48446
|
1,700 sq. feet
|
1 baths 3 beds |
show details | |

|
#16
Alcott St
Burton, MI 48509
|
2,184 sq. feet
|
2 baths 5 beds |
show details | |

|
#17
Roosevelt Ave
Mount Morris, MI 48458
|
1,432 sq. feet
|
1 baths 4 beds |
show details | |

|
#18
Spellman Dr
Flint, MI 48503
|
2,035 sq. feet
|
3 baths 4 beds |
show details | |

|
#19
Parkway Ct
Flint, MI 48503
|
1,570 sq. feet
|
1 baths 4 beds |
show details | |

|
#20
Pingree Ave
Flint, MI 48503
|
1,055 sq. feet
|
1 baths 3 beds |
show details |
| Photo | Address | Area | Beds / Baths | Price | Details |
|---|---|---|---|---|---|

|
#21
Huggins Ave
Flint, MI 48506
|
1,296 sq. feet
|
1 baths 3 beds |
show details | |

|
#22
W Stanley Rd
Mount Morris, MI 48458
|
1,560 sq. feet
|
2 baths 3 beds |
show details | |

|
#23
Rotterdam Dr # 69
Clio, MI 48420
|
1,283 sq. feet
|
2 baths 2 beds |
show details | |

|
#24
Slater Rd
Lapeer, MI 48446
|
1,436 sq. feet
|
2 baths 3 beds |
show details | |

|
#25
Center Rd
Millington, MI 48746
|
1,480 sq. feet
|
1 baths 3 beds |
show details | |

|
#26
N Belsay Rd
Flint, MI 48506
|
1,404 sq. feet
|
1 baths 4 beds |
show details | |

|
#27
E Mount Morris Rd
Mount Morris, MI 48458
|
1,412 sq. feet
|
1 baths 3 beds |
show details | |

|
#28
S Franklin Ave
Flint, MI 48503
|
1,774 sq. feet
|
2 baths 4 beds |
show details | |

|
#29
Pinkerton Rd
Vassar, MI 48768
|
1,200 sq. feet
|
1 baths 3 beds |
show details | |

|
#30
Richfield Rd
Flint, MI 48506
|
944 sq. feet
|
1 baths 2 beds |
show details |
| Photo | Address | Area | Beds / Baths | Price | Details |
|---|---|---|---|---|---|

|
#31
Gardenia Blvd
Davison, MI 48423
|
1,881 sq. feet
|
2 baths 3 beds |
show details | |

|
#32
E Pierson Rd
Flint, MI 48506
|
- sq. feet
|
2 baths 4 beds |
show details | |

|
#33
Houghton Dr
Davison, MI 48423
|
958 sq. feet
|
1 baths 3 beds |
show details | |

|
#34
N Averill Ave
Flint, MI 48506
|
- sq. feet
|
1 baths 3 beds |
show details | |

|
#35
Barbara Dr
Flint, MI 48505
|
1,001 sq. feet
|
2 baths 3 beds |
show details | |

|
#36
Eckinger St
Flint, MI 48506
|
1,120 sq. feet
|
1 baths 3 beds |
show details | |

|
#37
Byrnes Dr
Clio, MI 48420
|
744 sq. feet
|
1 baths 2 beds |
show details | |

|
#38
Huggins Ave
Flint, MI 48506
|
1,020 sq. feet
|
1 baths 3 beds |
show details | |

|
#39
S Franklin Ave
Flint, MI 48503
|
1,528 sq. feet
|
2 baths 4 beds |
show details | |

|
#40
W Holbrook Ave
Flint, MI 48505
|
2,707 sq. feet
|
1 baths 3 beds |
show details |
| Photo | Address | Area | Beds / Baths | Price | Details |
|---|---|---|---|---|---|

|
#41
Craig Dr
Flint, MI 48506
|
870 sq. feet
|
1 baths 3 beds |
show details | |

|
#42
Eaton Pl
Flint, MI 48506
|
1,257 sq. feet
|
1 baths 4 beds |
show details | |

|
#43
Chalmers St
Flint, MI 48503
|
1,926 sq. feet
|
1 baths 3 beds |
show details | |

|
#44
Darcey Ln
Flint, MI 48506
|
1,379 sq. feet
|
1 baths 3 beds |
show details | |

|
#45
Kent St
Flint, MI 48503
|
1,252 sq. feet
|
1 baths 3 beds |
show details | |

|
#46
Kent St
Flint, MI 48503
|
1,074 sq. feet
|
1 baths 3 beds |
show details | |

|
#47
Gloucester St
Flint, MI 48503
|
1,008 sq. feet
|
2 baths 3 beds |
show details | |

|
#48
Kentucky Ave
Flint, MI 48506
|
1,264 sq. feet
|
1 baths 3 beds |
show details | |

|
#49
Hosler St
Flint, MI 48503
|
1,249 sq. feet
|
1 baths 3 beds |
show details | |

|
Check over 1 million property listings on Foreclosure.com!
|
browse all offers | |||

Latest news about housing in Columbiaville, MI collected exclusively by city-data.com from local newspapers, TV, and radio stations

 | Why is Lapeer so run down? Any chance Lapeer-Metamora see a housing boom? (17 replies) |
| Michigan home prices surging (24 replies) |
| Possibly moving to Flint (young family...is this even safe?) (43 replies) |
| Columbiaville, Michigan William Peter ledgers (3 replies) |
| Where to live in MI??? (52 replies) |
Median year apartment built: 1953
Household type by relationship:
Households: 774- Male householders: 177 (45 living alone), Female householders: 158 (43 living alone)
183 spouses (183 opposite-sex spouses), 44 unmarried partners, (44 opposite-sex unmarried partners), 194 children (178 natural, 2 adopted, 14 stepchildren), 7 grandchildren, 2 brothers or sisters, 4 parents, 0 foster children, 5 other relatives, 0 non-relatives
Size of family households: 93 2-persons, 78 3-persons, 35 4-persons, 12 5-persons, 3 6-persons, 2 7-or-more-persons.
Size of nonfamily households: 88 1-person, 33 2-persons.
86 married couples with children.
36 single-parent households (0 men, 36 women).
95.7% of residents of Columbiaville speak English at home.
1.7% of residents speak Spanish at home (75% speak English very well, 25% speak English well).
2.4% of residents speak other Indo-European language at home (59% speak English very well, 12% speak English well, 29% speak English not well).
Foreign born population: 5 (0.6%)
(60.0% of them are naturalized citizens)
| Here: | 6.0 |
| State: | 6.5 |
| Here: | 3.7 |
| State: | 4.3 |
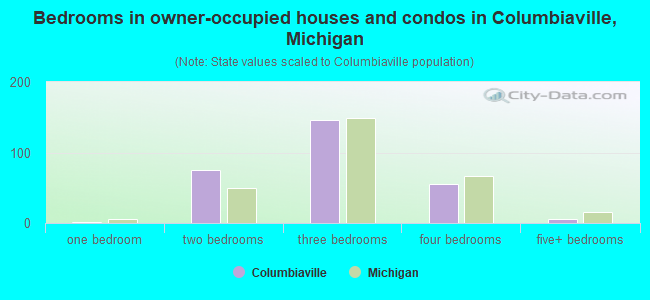
- Bedrooms in owner-occupied houses and condos in Columbiaville, Michigan
- 0no bedroom
- 21 bedroom
- 752 bedrooms
- 1463 bedrooms
- 564 bedrooms
- 65+ bedrooms
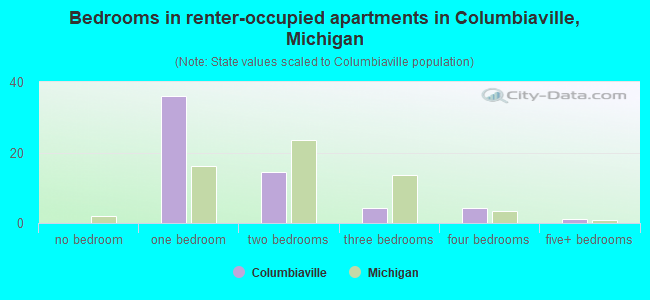
- Bedrooms in renter-occupied apartments in Columbiaville, Michigan
- 0no bedroom
- 361 bedroom
- 142 bedrooms
- 43 bedrooms
- 44 bedrooms
- 15+ bedrooms
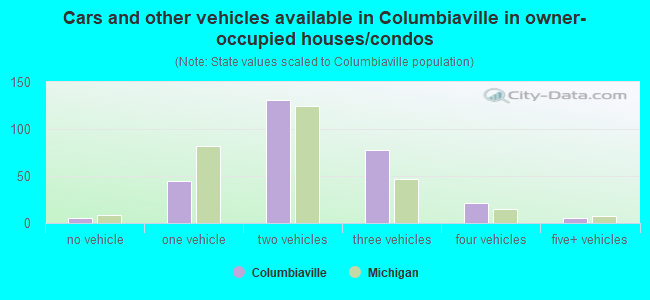
- Cars and other vehicles available in Columbiaville in owner-occupied houses/condos
- 5no vehicle
- 451 vehicle
- 1312 vehicles
- 783 vehicles
- 214 vehicles
- 55+ vehicles
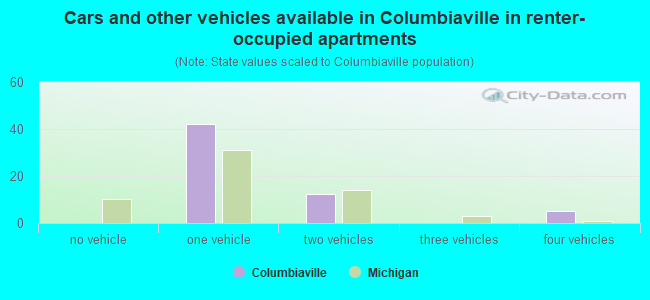
- Cars and other vehicles available in Columbiaville in renter-occupied apartments
- 0no vehicle
- 421 vehicle
- 122 vehicles
- 03 vehicles
- 54 vehicles
- 05+ vehicles
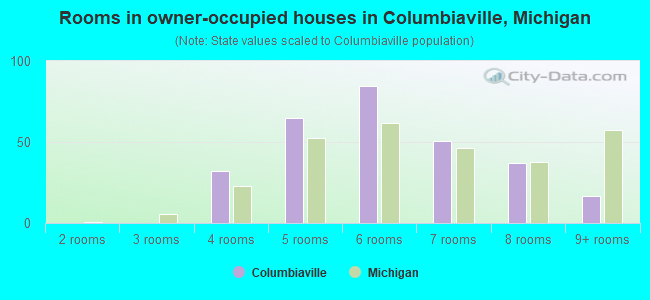
- Rooms in owner-occupied houses in Columbiaville, Michigan
- 01 room
- 02 rooms
- 03 rooms
- 324 rooms
- 655 rooms
- 846 rooms
- 507 rooms
- 378 rooms
- 169+ rooms
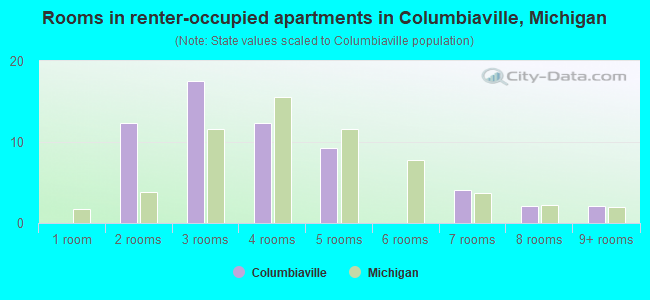
- Rooms in renter-occupied apartments in Columbiaville, Michigan
- 01 room
- 122 rooms
- 183 rooms
- 124 rooms
- 95 rooms
- 06 rooms
- 47 rooms
- 28 rooms
- 29+ rooms
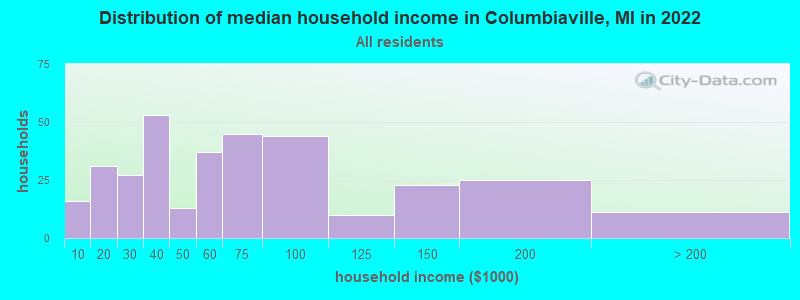
Columbiaville, MI household income distribution

- 16Less than $10,000
- 31$10,000 to $19,999
- 27$20,000 to $29,999
- 53$30,000 to $39,999
- 13$40,000 to $49,999
- 37$50,000 to $59,999
- 45$60,000 to $74,999
- 44$75,000 to $99,999
- 10$100,000 to $124,999
- 23$125,000 to $149,999
- 25$150,000 to $199,999
- 11$200,000 or more
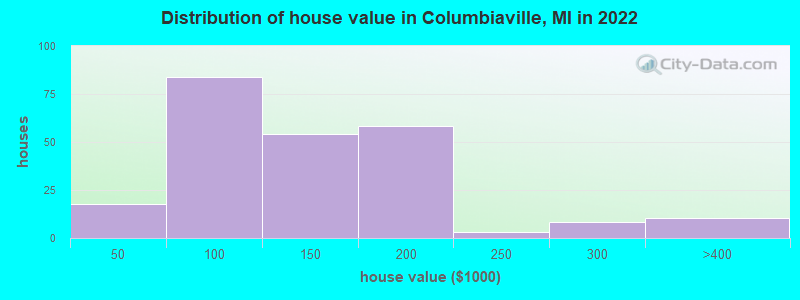
Home value of owner - occupied houses in 2022 in Columbiaville, MI
-
- 10$25,000 to $29,999
- 6$40,000 to $49,999
- 1$50,000 to $59,999
- 9$60,000 to $69,999
- 18$70,000 to $79,999
- 11$80,000 to $89,999
- 35$90,000 to $99,999
- 32$100,000 to $124,999
- 22$125,000 to $149,999
- 21$150,000 to $174,999
- 36$175,000 to $199,999
- 2$200,000 to $249,999
- 8$250,000 to $299,999
- 10$300,000 to $399,999
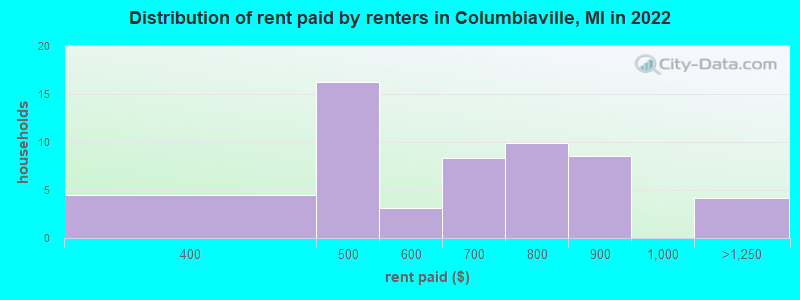
Rent paid by renters in 2022 in Columbiaville, MI
-
- 4$350 to $399
- 8$400 to $449
- 8$450 to $499
- 2$500 to $549
- 0$550 to $599
- 4$600 to $649
- 3$650 to $699
- 5$700 to $749
- 4$750 to $799
- 8$800 to $899
- 4$1,000 to $1,249
Percentage of workers working in this county: 59.7%
Number of people working at home: 21 (6.4% of all workers)
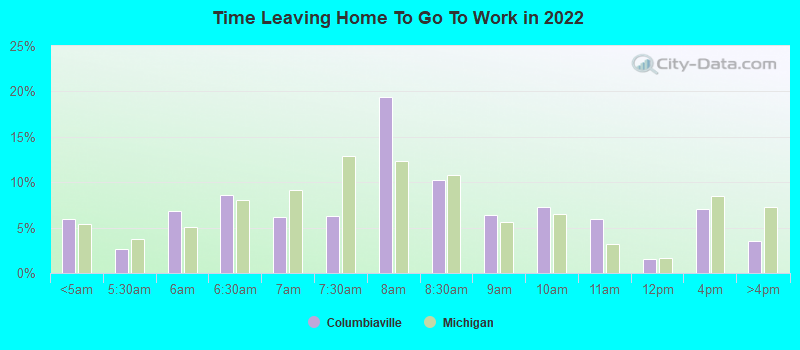
Travel time to work (commute)
- Less than 5 minutes: 10
- 5 to 9 minutes: 13
- 10 to 14 minutes: 30
- 15 to 19 minutes: 25
- 20 to 24 minutes: 38
- 25 to 29 minutes: 26
- 30 to 34 minutes: 39
- 35 to 39 minutes: 29
- 40 to 44 minutes: 16
- 45 to 59 minutes: 29
- 60 to 89 minutes: 16
- 90 or more minutes: 20
Means of transportation to work:
- Drove a car alone: 266 (77.6%)
- Carpooled: 52 (15.2%)
- Walked: 18 (5.2%)
- Worked at home: 7 (2.0%)
- Unemployment by race in 2022
- Unemployment rate for White non-Hispanic residents
- 6.5%Males
- 8.3%Females
- Unemployment rate for Hispanic or Latino residents
- 27.9%Males
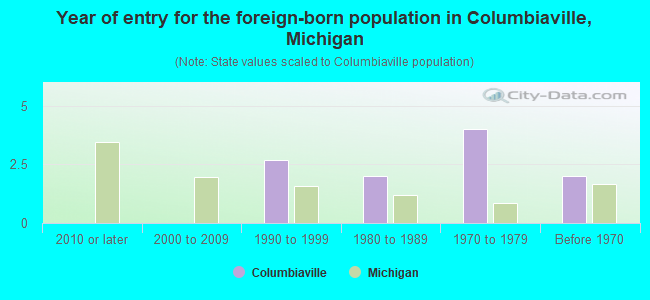
- Year of entry for the foreign-born population in Columbiaville, Michigan
- 02010 or later
- 02000 to 2009
- 31990 to 1999
- 21980 to 1989
- 41970 to 1979
- 2Before 1970
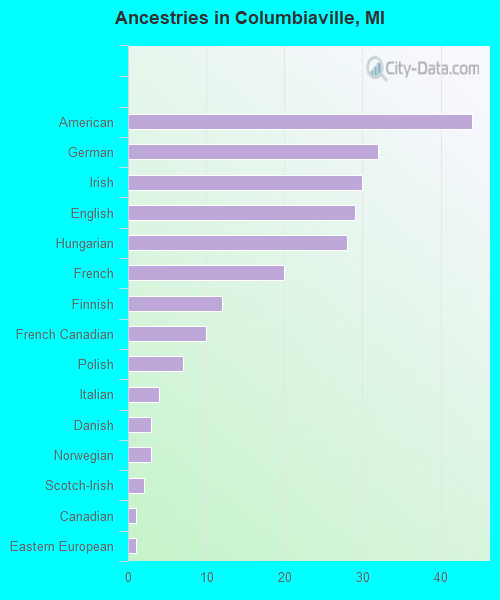
First ancestries reported:
- American: 44 (19.2%)
- German: 32 (13.9%)
- Irish: 30 (13.1%)
- English: 29 (12.6%)
- Hungarian: 28 (12.2%)
- French: 20 (8.7%)
- Finnish: 12 (5.2%)
- French Canadian: 10 (4.4%)
- Polish: 7 (3.1%)
- Italian: 4 (1.7%)
- Danish: 3 (1.3%)
- Norwegian: 3 (1.3%)
- Scotch-Irish: 2 (0.9%)
- Canadian: 1 (0.4%)
- Eastern European: 1 (0.4%)
Most common places of birth for foreign-born residents (%):
| Columbiaville: | 36.4% (4) |
| Michigan: | 5.0% (35,052) |
| Columbiaville: | 18.2% (2) |
| Michigan: | 2.3% (16,126) |
| Columbiaville: | 18.2% (2) |
| Michigan: | 10.9% (75,965) |
Place of birth for U.S.-born residents:
- This state: 716
- Other state: 48
- Northeast: 4
- Midwest: 16
- South: 17
- West: 9
93.1% of Columbiaville residents lived in the same house 1 years ago.
Out of people who lived in different houses, 31.6% lived in this county.
Out of people who lived in different counties, 100.0% lived in Michigan.
| Columbiaville: | 93.1% |
| State average: | 88.4% |
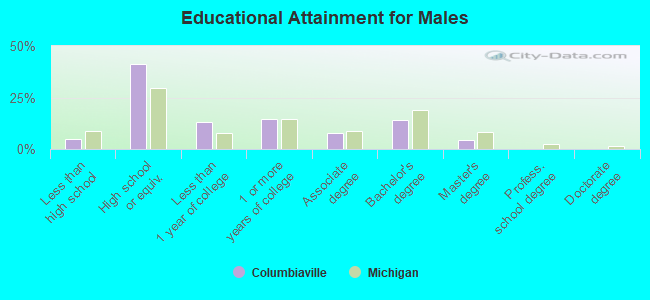
Education attainment for males 25 years and older:
- No schooling: 3
- Nursery to 4th grade: 0
- 5th and 6th grade: 0
- 7th and 8th grade: 0
- 9th grade: 7
- 10th grade: 0
- 11th grade: 0
- 12th grade, no diploma: 3
- High school graduate (or equivalency): 112
- Less than 1 year of college: 35
- Some college more than 1 year, no degree: 39
- Associate degree: 21
- Bachelor's degree: 38
- Master's degree: 12
- Professional school degree: 0
- Doctorate degree: 0
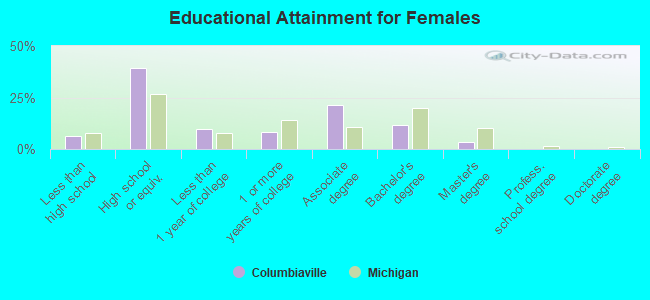
Education attainment for females 25 years and older:
- No schooling: 4
- Nursery to 4th grade: 0
- 5th and 6th grade: 0
- 7th and 8th grade: 0
- 9th grade: 0
- 10th grade: 0
- 11th grade: 6
- 12th grade, no diploma: 8
- High school graduate (or equivalency): 112
- Less than 1 year of college: 28
- Some college more than 1 year, no degree: 24
- Associate degree: 61
- Bachelor's degree: 33
- Master's degree: 9
- Professional school degree: 0
- Doctorate degree: 0
Housing units in structures:
- One, detached: 298
- Two: 5
- 3 or 4: 16
- 5 to 9: 6
- 20 to 49: 13
- Mobile homes: 18
Median worth of mobile homes: $118,216
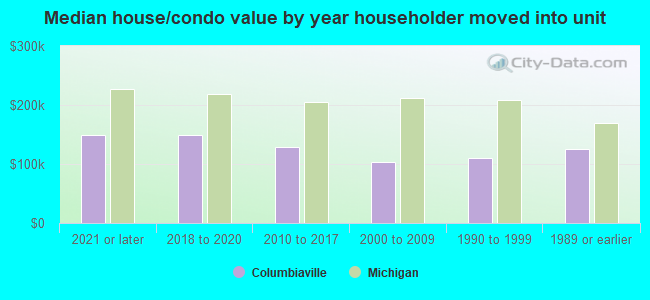
House/condo owner moved in on average 9 years ago
Renter moved in on average 2 years ago
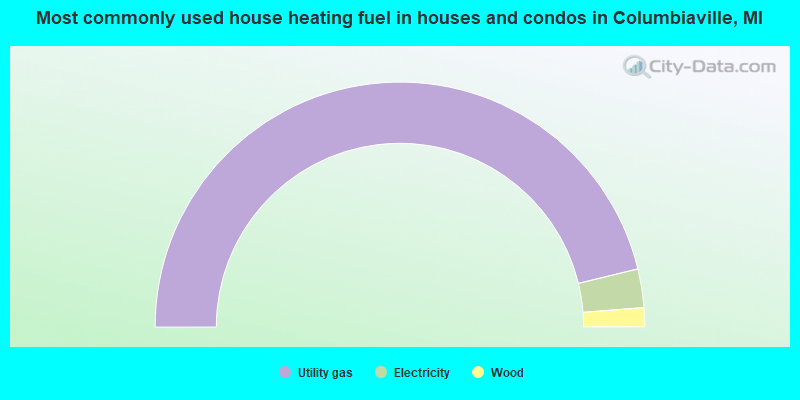
- 92.4%Utility gas
- 5.1%Electricity
- 2.5%Wood
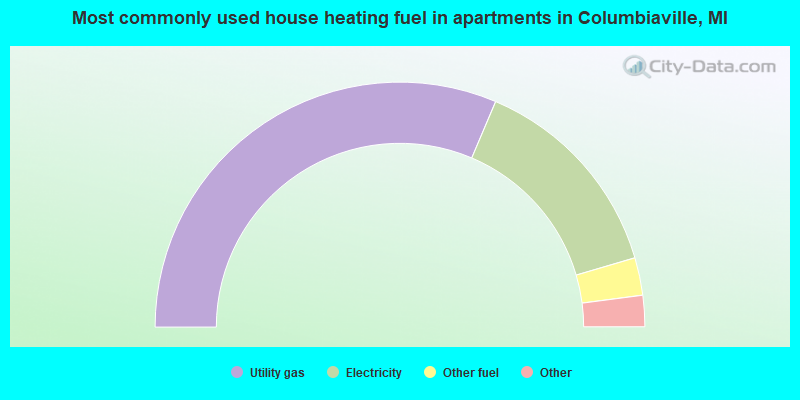
- 65.5%Utility gas
- 29.3%Electricity
- 5.2%Other fuel
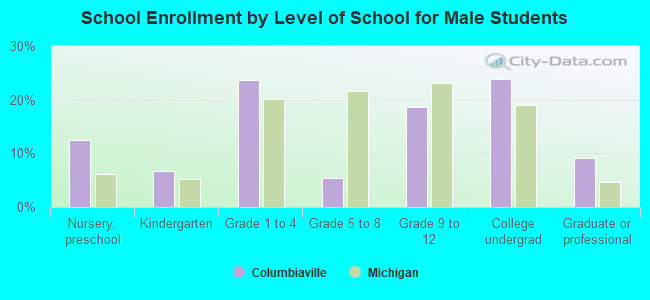
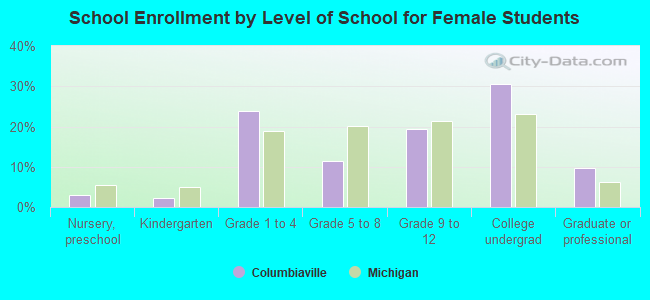
Private vs. public school enrollment:
| Here: | 10.2% |
| Michigan: | 12.4% |
| Here: | 27.6% |
| Michigan: | 9.8% |
| Here: | 0.0% |
| Michigan: | 14.9% |