Housing density: 1,591 houses/condos per square mile
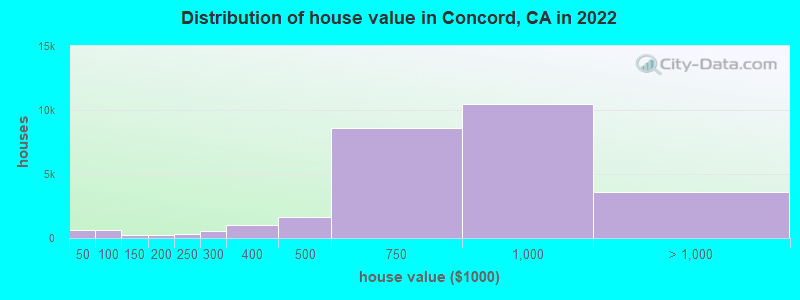
Median price asked for vacant for-sale houses and condos in 2022: $869,408.
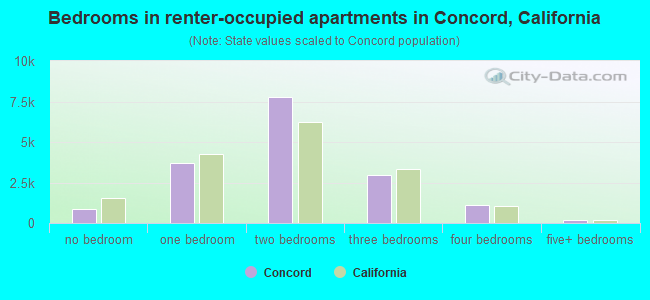
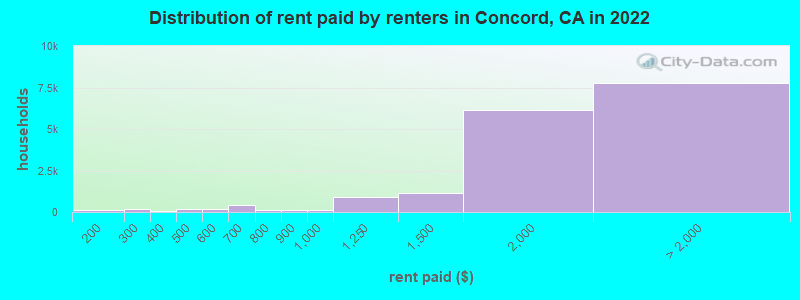
Median contract rent in 2022: $1,824 (lower quartile is $1,504, upper quartile is over $2,000)
Median rent asked for vacant for-rent units in 2022: $2,127
Median gross rent in Concord, CA in 2022: over $2,000
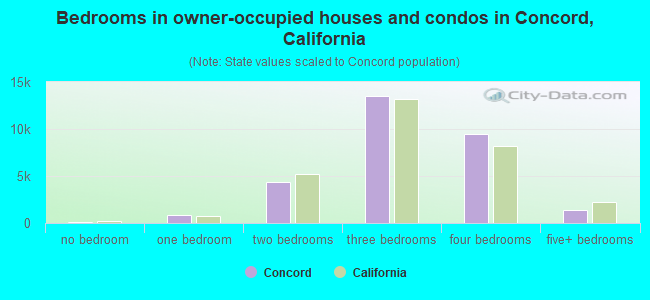
Housing units in Concord with a mortgage: 22,237 (1,700 second mortgage, 144 home equity loan, 1,334 both second mortgage and home equity loan) Houses without a mortgage: 244
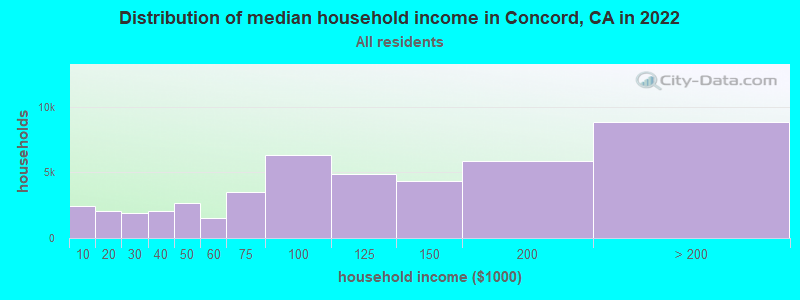
Median household income for houses/condos with a mortgage: $142,346
Median household income for apartments without a mortgage: $74,348
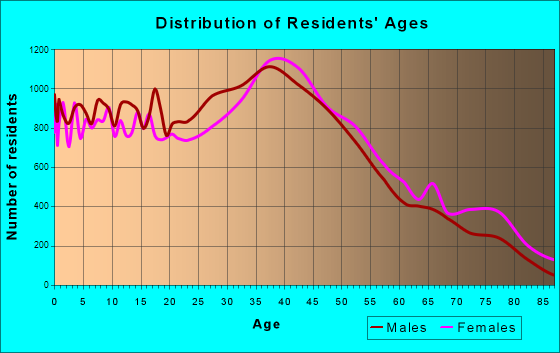
16,728 married couples with children.
4,192 single-parent households (1,173 men, 3,019 women).
56.7% of residents of Concord speak English at home.
26.0% of residents speak Spanish at home (52% speak English very well, 21% speak English well, 20% speak English not well, 6% don't speak English at all).
6.4% of residents speak other Indo-European language at home (51% speak English very well, 28% speak English well, 17% speak English not well, 5% don't speak English at all).
9.6% of residents speak Asian or Pacific Island language at home (64% speak English very well, 26% speak English well, 11% speak English not well).
1.3% of residents speak other language at home (55% speak English very well, 25% speak English well, 20% speak English not well).
Foreign born population: 34,995 (28.5%)
(48.7% of them are naturalized citizens)
Percentage of workers working in this county: 77.5% Number of people working at home: 9,509 (15.5% of all workers)
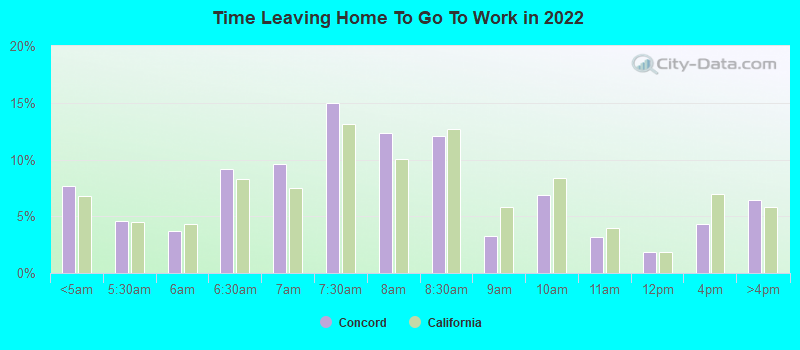
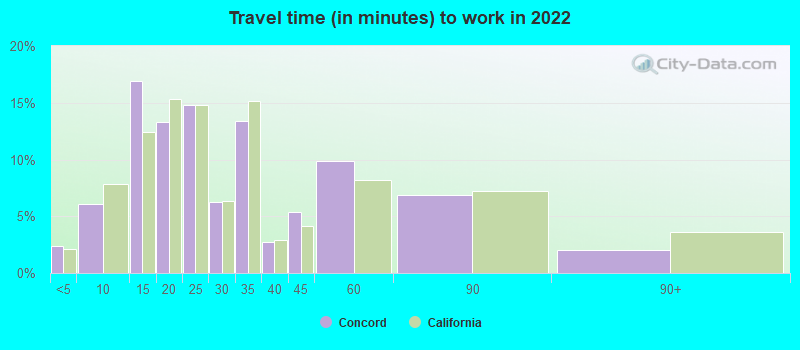
Travel time to work (commute)
Less than 5 minutes: 845
5 to 9 minutes: 1,364
10 to 14 minutes: 7,312
15 to 19 minutes: 8,593
20 to 24 minutes: 7,262
25 to 29 minutes: 2,617
30 to 34 minutes: 6,848
35 to 39 minutes: 2,073
40 to 44 minutes: 2,603
45 to 59 minutes: 4,726
60 to 89 minutes: 5,454
90 or more minutes: 2,271
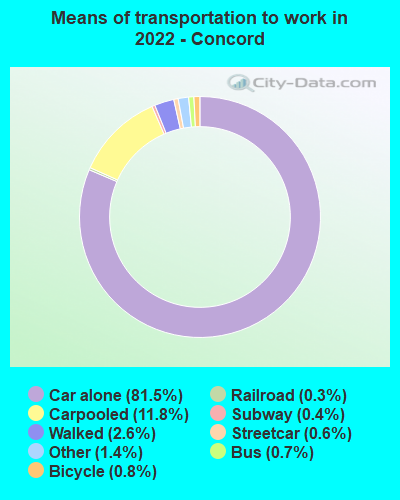
Means of transportation to work:
Drove a car alone: 39,898 (65.0%)
Carpooled: 6,445 (10.5%)
Bus: 283 (0.5%)
Subway or elevated rail: 206 (0.3%)
Long-distance train or commuter rail: 137 (0.2%)
Light rail, streetcar or trolley: 92 (0.1%)
Ferryboat: 7 (0.0%)
Taxi: 726 (1.2%)
Bicycle: 276 (0.4%)
Walked: 1,800 (2.9%)
Worked at home: 10,540 (17.2%)
Unemployment by race in 2022
Unemployment rate for White non-Hispanic residents
3.9%Males
5.2%Females
Unemployment rate for Black residents
5.8%Males
7.2%Females
Unemployment rate for American Indian and Alaska Native residents
1.1%Males
10.6%Females
Unemployment rate for Asian residents
2.1%Males
4.7%Females
Unemployment rate for other race residents
1.8%Males
2.7%Females
Unemployment rate for two or more race residents
3.1%Males
4.2%Females
Unemployment rate for Hispanic or Latino residents
3.1%Males
2.9%Females
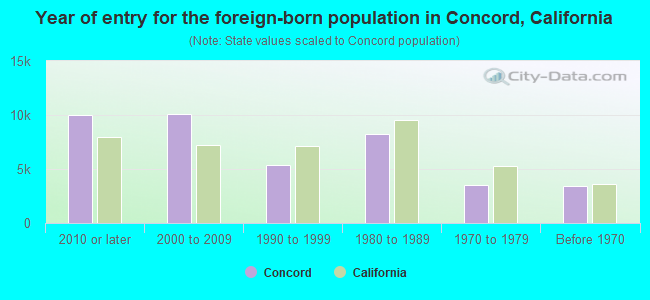
Year of entry for the foreign-born population in Concord, California
10,0322010 or later
10,1242000 to 2009
5,3871990 to 1999
8,2671980 to 1989
3,5501970 to 1979
3,463Before 1970
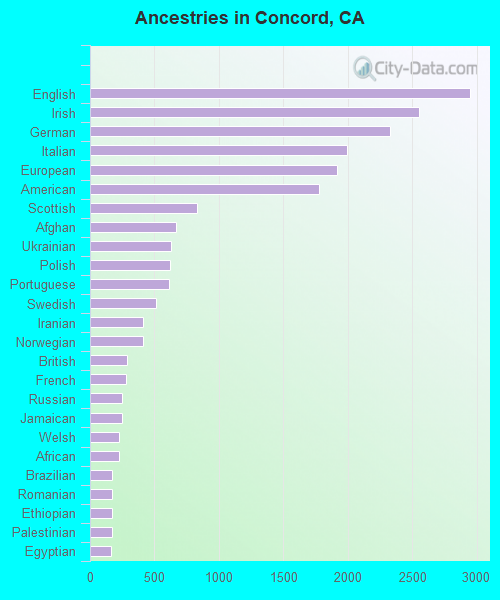
First ancestries reported:
English: 2,949 (4.3%)
Irish: 2,550 (3.7%)
German: 2,327 (3.4%)
Italian: 1,993 (2.9%)
European: 1,916 (2.8%)
American: 1,780 (2.6%)
Scottish: 830 (1.2%)
Afghan: 666 (1.0%)
Ukrainian: 629 (0.9%)
Polish: 619 (0.9%)
Portuguese: 610 (0.9%)
Swedish: 515 (0.8%)
Iranian: 412 (0.6%)
Norwegian: 408 (0.6%)
British: 290 (0.4%)
French: 281 (0.4%)
Russian: 252 (0.4%)
Jamaican: 245 (0.4%)
Welsh: 228 (0.3%)
African: 223 (0.3%)
Brazilian: 171 (0.2%)
Romanian: 171 (0.2%)
Ethiopian: 169 (0.2%)
Palestinian: 167 (0.2%)
Egyptian: 165 (0.2%)
Czech: 165 (0.2%)
Jordanian: 152 (0.2%)
Eastern European: 152 (0.2%)
Scotch-Irish: 150 (0.2%)
Yugoslavian: 149 (0.2%)
Danish: 139 (0.2%)
Hungarian: 122 (0.2%)
Croatian: 121 (0.2%)
Bulgarian: 117 (0.2%)
Dutch: 115 (0.2%)
Armenian: 115 (0.2%)
Greek: 96 (0.1%)
Ghanaian: 94 (0.1%)
Kenyan: 90 (0.1%)
Scandinavian: 77 (0.1%)
Syrian: 75 (0.1%)
Belizean: 75 (0.1%)
French Canadian: 73 (0.1%)
Canadian: 70 (0.1%)
West Indian: 70 (0.1%)
Slavic: 63 (0.09%)
Northern European: 60 (0.09%)
Australian: 59 (0.09%)
Nigerian: 54 (0.08%)
Belgian: 47 (0.07%)
Moroccan: 45 (0.07%)
South African: 45 (0.07%)
Swiss: 44 (0.06%)
Lebanese: 43 (0.06%)
Maltese: 41 (0.06%)
Latvian: 41 (0.06%)
Austrian: 38 (0.06%)
Slovene: 37 (0.05%)
Finnish: 35 (0.05%)
Turkish: 35 (0.05%)
Slovak: 30 (0.04%)
Arab: 28 (0.04%)
Israeli: 28 (0.04%)
Lithuanian: 12 (0.02%)
Basque: 10 (0.01%)
Trinidadian and Tobagonian: 10 (0.01%)
Icelander: 7 (0.01%)
Most common places of birth for foreign-born residents (%):
Mexico
Concord:
29.9% (9,536)
California:
37.2% (3,881,193)
Philippines
Concord:
14.8% (4,737)
California:
7.8% (818,297)
El Salvador
Concord:
5.0% (1,608)
California:
4.2% (440,287)
Afghanistan
Concord:
4.8% (1,537)
California:
0.5% (53,260)
China, excluding Hong Kong and Taiwan
Concord:
3.6% (1,152)
California:
6.6% (684,672)
India
Concord:
3.2% (1,017)
California:
5.2% (539,184)
Colombia
Concord:
2.1% (681)
California:
0.5% (55,249)
Algeria
Concord:
2.0% (645)
California:
0.0% (4,729)
Peru
Concord:
2.0% (640)
California:
0.7% (74,025)
Guatemala
Concord:
2.0% (624)
California:
2.8% (290,436)
Nicaragua
Concord:
1.9% (620)
California:
0.6% (58,161)
Vietnam
Concord:
1.8% (589)
California:
4.9% (512,335)
Ukraine
Concord:
1.8% (559)
California:
0.6% (60,761)
Venezuela
Concord:
1.7% (530)
California:
0.2% (16,998)
Place of birth for U.S.-born residents:
This state: 67,004
Other state: 18,417
Northeast: 3,505
Midwest: 5,856
South: 5,654
West: 3,402
87.8% of Concord residents lived in the same house 1 years ago. Out of people who lived in different houses, 38.9% lived in this county. Out of people who lived in different counties, 78.8% lived in California.
Concord:
87.8%
State average:
88.9%
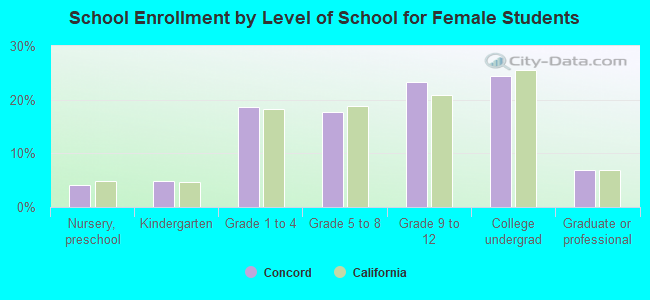
Education attainment for males 25 years and older:
No schooling: 1,591
Nursery to 4th grade: 391
5th and 6th grade: 1,100
7th and 8th grade: 95
9th grade: 902
10th grade: 610
11th grade: 406
12th grade, no diploma: 1,079
High school graduate (or equivalency): 10,765
Less than 1 year of college: 2,290
Some college more than 1 year, no degree: 5,841
Associate degree: 4,159
Bachelor's degree: 11,453
Master's degree: 4,125
Professional school degree: 570
Doctorate degree: 834
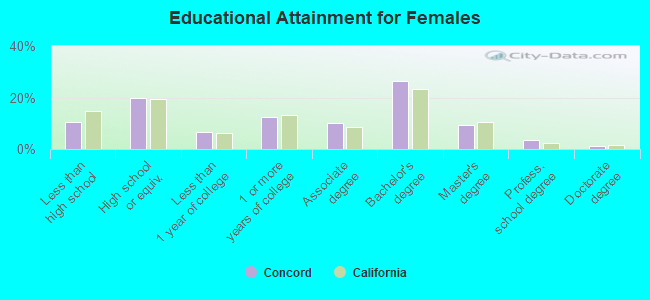
Education attainment for females 25 years and older:
No schooling: 1,272
Nursery to 4th grade: 591
5th and 6th grade: 756
7th and 8th grade: 214
9th grade: 271
10th grade: 368
11th grade: 460
12th grade, no diploma: 628
High school graduate (or equivalency): 8,725
Less than 1 year of college: 2,989
Some college more than 1 year, no degree: 5,448
Associate degree: 4,435
Bachelor's degree: 11,679
Master's degree: 4,172
Professional school degree: 1,612
Doctorate degree: 556
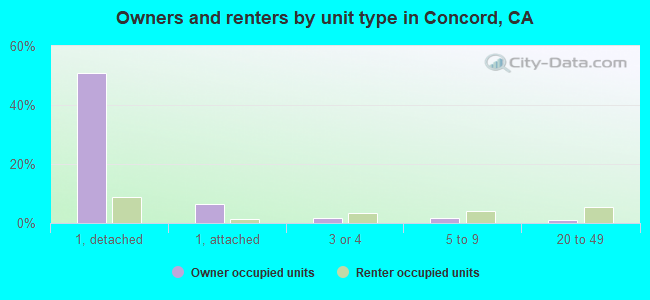
Housing units in structures:
One, detached: 28,114
One, attached: 3,797
Two: 530
3 or 4: 2,299
5 to 9: 2,998
10 to 19: 2,004
20 to 49: 3,294
50 or more: 3,997
Mobile homes: 920
Median worth of mobile homes: $172,700
Housing units lacking complete plumbing facilities in 2022: 1.2%
Housing units lacking complete kitchen facilities in 2022: 1.4%
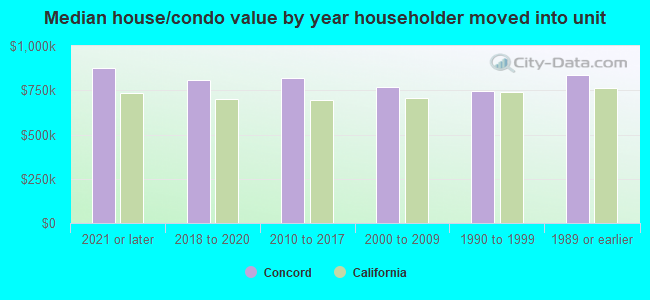
House/condo owner moved in on average 14 years ago