Connersville, IN (Indiana) Houses and Residents
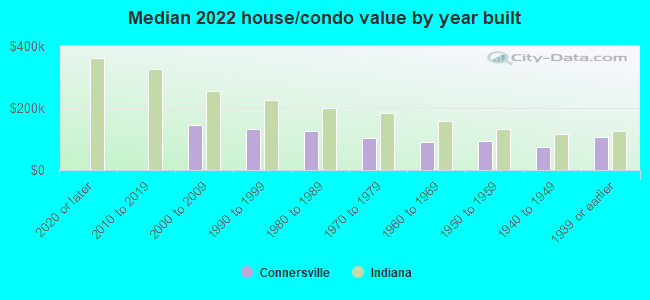
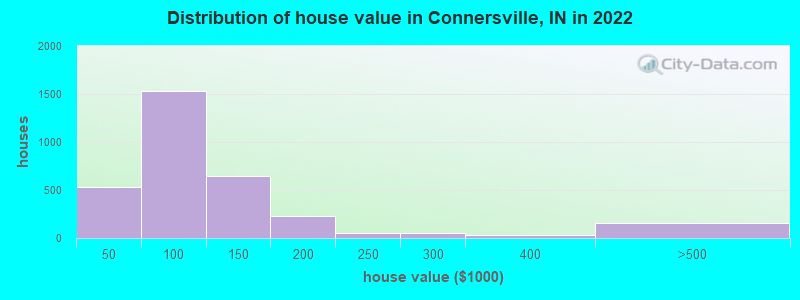
Estimated median house or condo value in 2022: $102,190 (it was $67,700 in 2000 )
Connersville:
$102,190Indiana:
$208,700
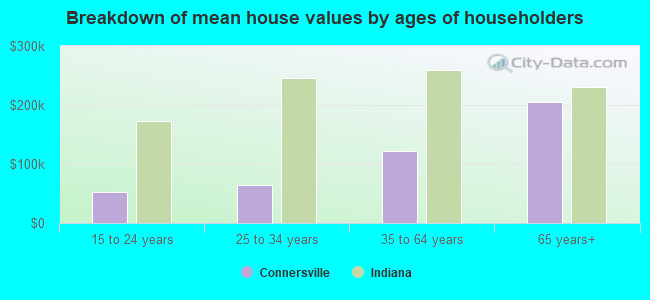
Lower value quartile - upper value quartile: $67,881 - $143,813Mean price in 2022: Detached houses: $118,253 Here:
$118,253State:
$257,916
In 2-unit structures: $95,349 Here:
$95,349State:
$175,375
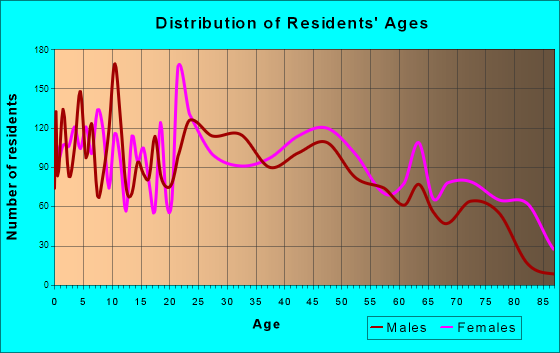
Total population: 13,032 (All urban)
Houses: 6,536 (5,794 occupied: 3,526 owner occupied, 2,336 renter occupied )
% of renters here:
40%State:
29%
Housing density: 803 houses/condos per square mile
Median price asked for vacant for-sale houses and condos in 2022: $71,209.
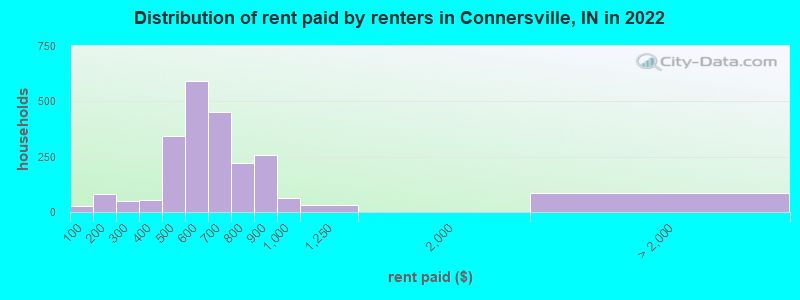
Median contract rent in 2022: $597 (lower quartile is $485, upper quartile is $752)
Median rent asked for vacant for-rent units in 2022: $1,434
Median gross rent in Connersville, IN in 2022: $750
Housing units in Connersville with a mortgage: 2,058 (186 second mortgage, 0 home equity loan, 123 both second mortgage and home equity loan )Houses without a mortgage: 262
Median household income for houses/condos with a mortgage: $66,927
Median household income for apartments without a mortgage: $39,146
Median monthly housing costs: $714
Data:
Median house or condo value ($)
Median house or condo value ($ change since 2000)
Median house or condo value ($) - White
Median house or condo value ($) - Black or African American
Median house or condo value ($) - Asian
Median house or condo value ($) - Hispanic or Latino
Median house or condo value ($) - American Indian and Alaska Native
Median house or condo value ($) - Multirace
Median house or condo value ($) - Other Race
Median price asked for mobile homes ($)
Household density (households per square mile)
Mean house or condo value by units in structure - 1, detached ($)
Mean house or condo value by units in structure - 1, attached ($)
Mean house or condo value by units in structure - 2 ($)
Mean house or condo value by units in structure by units in structure - 3 or 4 ($)
Mean house or condo value by units in structure - 5 or more ($)
Mean house or condo value by units in structure - Boat, RV, van, etc. ($)
Mean house or condo value by units in structure - Mobile home ($)
Median contract rent ($)
Median contract rent - Lower quartile ($)
Median contract rent - Upper quartile ($)
Median gross rent ($)
Urban houses (%)
Rural houses (%)
Houses occupied (%)
Houses occupied (% change since 2000)
Houses owner occupied (%)
Houses owner occupied (% change since 2000)
Houses renter occupied (%)
Houses renter occupied (% change since 2000)
Vacant housing units - For rent (%)
Vacant housing units - For rent (% change since 2000)
Vacant housing units - For sale only (%)
Vacant housing units - For sale only (% change since 2000)
Vacant housing units - Rented or sold, not occupied (%)
Vacant housing units - Rented or sold, not occupied (% change since 2000)
Vacant housing units - For seasonal, recreational, or occasional use (%)
Vacant housing units - For seasonal, recreational, or occasional use (% change since 2000)
Vacant housing units - For migrant workers (%)
Vacant housing units - For migrant workers (% change since 2000)
Vacant housing units - Other vacant (%)
Vacant housing units - Other vacant (% change since 2000)
Median monthly housing costs ($)
Median household income for houses/condos with a mortgage ($)
Median household income for houses/condos without a mortgage ($)
Median household income ($)
Median household income ($) - White
Median household income ($) - Black or African American
Median household income ($) - Asian
Median household income ($) - Hispanic or Latino
Median household income ($) - American Indian and Alaska Native
Median household income ($) - Multirace
Median household income ($) - Other Race
Mortgage status - with mortgage (%)
Mortgage status - with second mortgage (%)
Mortgage status - with home equity loan (%)
Mortgage status - with both second mortgage and home equity loan (%)
Mortgage status - without a mortgage (%)
Median year house/condo built
Median year apartment built
Household type by relationship - Male householder living alone (%)
Household type by relationship - Male householder not living alone (%)
Household type by relationship - Female householder living alone (%)
Household type by relationship - Female householder not living alone (%)
Household type by relationship - Opposite-Sex spouse (%)
Household type by relationship - Same-Sex spouse (%)
Household type by relationship - Opposite-Sex unmarried partner (%)
Household type by relationship - Same-Sex unmarried partner (%)
Household type by relationship - In group quarters (%)
Size of family households - 2-person household (%)
Size of family households - 3-person household (%)
Size of family households - 4-person household (%)
Size of family households - 5-person household (%)
Size of family households - 6-person household (%)
Size of family households - 7-or-more-person household (%)
Size of nonfamily households - 1-person household (%)
Size of nonfamily households - 2-person household (%)
Size of nonfamily households - 3-person household (%)
Size of nonfamily households - 4-person household (%)
Size of nonfamily households - 5-person household (%)
Size of nonfamily households - 6-person household (%)
Size of nonfamily households - 7-or-moreperson household (%)
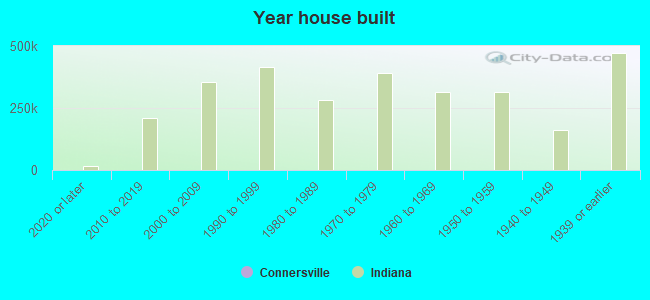
Year house built - Built 2010 or later (%)
Year house built - Built 2000 to 2009 (%)
Year house built - Built 1990 to 1999 (%)
Year house built - Built 1980 to 1989 (%)
Year house built - Built 1970 to 1979 (%)
Year house built - Built 1960 to 1969 (%)
Year house built - Built 1950 to 1959 (%)
Year house built - Built 1940 to 1949 (%)
Year house built - Built 1939 or earlier (%)
Median number of rooms in houses and condos
Median number of rooms in apartments
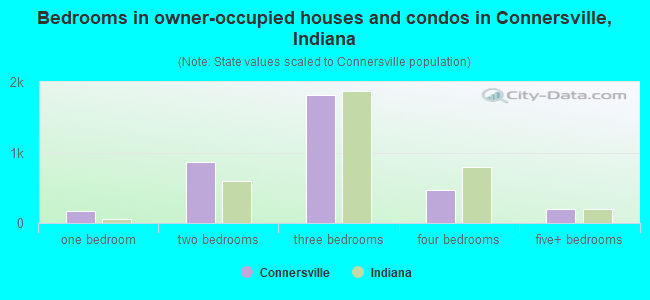
Median number of bedrooms in owner occupied houses
Mean number of bedrooms in owner occupied houses
Median number of bedrooms in renter occupied houses
Mean number of bedrooms in renter occupied houses
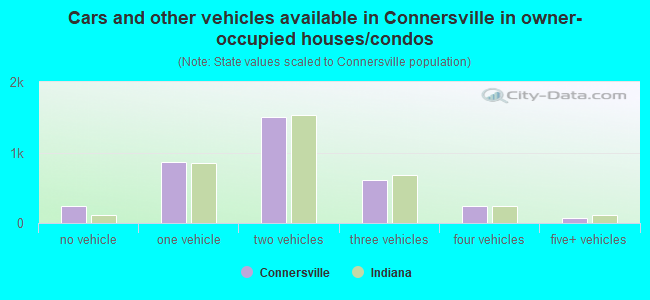
Median number of vehichles in owner occupied houses
Mean number of vehichles in owner occupied houses
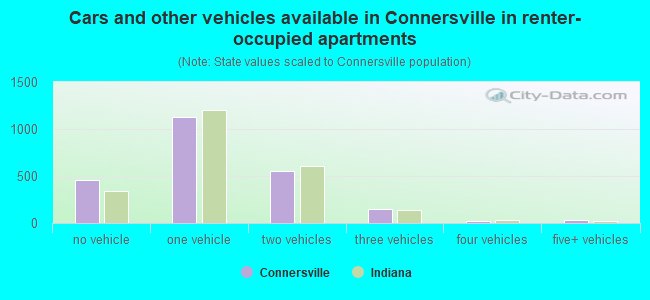
Median number of vehichles in renter occupied houses
Mean number of vehichles in renter occupied houses
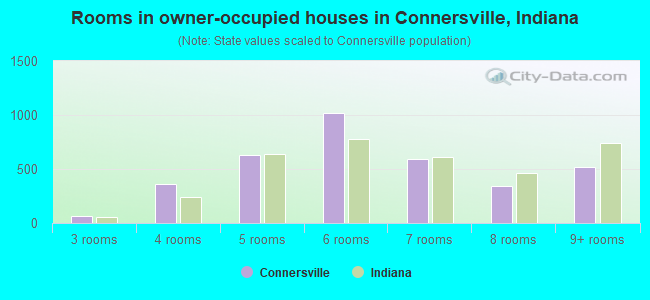
Rooms in owner-occupied houses - 1 room (%)
Rooms in owner-occupied houses - 2 rooms (%)
Rooms in owner-occupied houses - 3 rooms (%)
Rooms in owner-occupied houses - 4 rooms (%)
Rooms in owner-occupied houses - 5 rooms (%)
Rooms in owner-occupied houses - 6 rooms (%)
Rooms in owner-occupied houses - 7 rooms (%)
Rooms in owner-occupied houses - 8 rooms (%)
Rooms in owner-occupied houses - 9+ rooms (%)
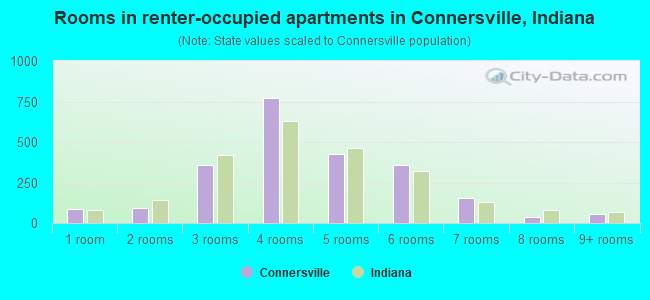
Rooms in renter-occupied houses - 1 room (%)
Rooms in renter-occupied houses - 2 rooms (%)
Rooms in renter-occupied houses - 3 rooms (%)
Rooms in renter-occupied houses - 4 rooms (%)
Rooms in renter-occupied houses - 5 rooms (%)
Rooms in renter-occupied houses - 6 rooms (%)
Rooms in renter-occupied houses - 7 rooms (%)
Rooms in renter-occupied houses - 8 rooms (%)
Rooms in renter-occupied houses - 9+ rooms (%)
Bedrooms in owner-occupied houses - no bedrooms (%)
Bedrooms in owner-occupied houses - 1 bedroom (%)
Bedrooms in owner-occupied houses - 2 bedrooms (%)
Bedrooms in owner-occupied houses - 3 bedrooms (%)
Bedrooms in owner-occupied houses - 4 bedrooms (%)
Bedrooms in owner-occupied houses - 5+ bedrooms (%)
Bedrooms in renter-occupied houses - no bedrooms (%)
Bedrooms in renter-occupied houses - 1 bedroom (%)
Bedrooms in renter-occupied houses - 2 bedrooms (%)
Bedrooms in renter-occupied houses - 3 bedrooms (%)
Bedrooms in renter-occupied houses - 4 bedrooms (%)
Bedrooms in renter-occupied houses - 5+ bedrooms (%)
Vehicles available in owner-occupied houses - no vehicle available (%)
Vehicles available in owner-occupied houses - 1 vehicle available(%)
Vehicles available in owner-occupied houses - 2 Vehicles available (%)
Vehicles available in owner-occupied houses - 3 Vehicles available (%)
Vehicles available in owner-occupied houses - 4 Vehicles available (%)
Vehicles available in owner-occupied houses - 5+ Vehicles available (%)
Vehicles available in renter-occupied houses - no vehicle available (%)
Vehicles available in renter-occupied houses - 1 vehicle available (%)
Vehicles available in renter-occupied houses - 2 Vehicles available (%)
Vehicles available in renter-occupied houses - 3 Vehicles available (%)
Vehicles available in renter-occupied houses - 4 Vehicles available (%)
Vehicles available in renter-occupied houses - 5+ Vehicles available (%)
Housing units in structures - 1, detached (%)
Housing units in structures - 1, attached (%)
Housing units in structures - 2 (%)
Housing units in structures - 3 or 4 (%)
Housing units in structures - 5 to 9 (%)
Housing units in structures - 10 to 19 (%)
Housing units in structures - 20 to 49 (%)
Housing units in structures - 50 or more (%)
Housing units in structures - Mobile home (%)
Housing units in structures - Boat, RV, van, etc. (%)
Housing units in structures - Owners - 1, detached (%)
Housing units in structures - Owners - 1, attached (%)
Housing units in structures - Owners - 2 (%)
Housing units in structures - Owners - 3 or 4 (%)
Housing units in structures - Owners - 5 to 9 (%)
Housing units in structures - Owners - 10 to 19 (%)
Housing units in structures - Owners - 20 to 49 (%)
Housing units in structures - Owners - 50 or more (%)
Housing units in structures - Owners - Mobile home (%)
Housing units in structures - Owners - Boat, RV, van, etc. (%)
Housing units in structures - Renters - 1, detached (%)
Housing units in structures - Renters - 1, attached (%)
Housing units in structures - Renters - 2 (%)
Housing units in structures - Renters - 3 or 4 (%)
Housing units in structures - Renters - 5 to 9 (%)
Housing units in structures - Renters - 10 to 19 (%)
Housing units in structures - Renters - 20 to 49 (%)
Housing units in structures - Renters - 50 or more (%)
Housing units in structures - Renters - Mobile home (%)
Housing units in structures - Renters - Boat, RV, van, etc. (%)
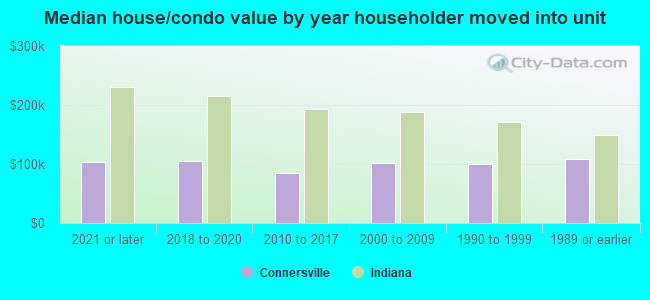
House/condo owner moved in on average (years ago)
Renter moved in on average (years ago)
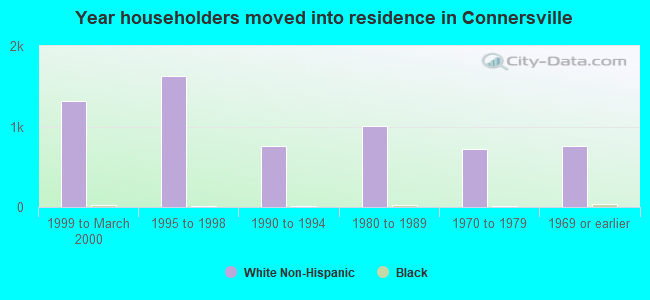
Year householder moved into unit - Moved in 1999 to March 2000 (%)
Year householder moved into unit - Moved in 1999 to March 2000 (%) - White
Year householder moved into unit - Moved in 1999 to March 2000 (%) - Black or African American
Year householder moved into unit - Moved in 1999 to March 2000 (%) - Asian
Year householder moved into unit - Moved in 1999 to March 2000 (%) - Hispanic or Latino
Year householder moved into unit - Moved in 1999 to March 2000 (%) - American Indian and Alaska Native
Year householder moved into unit - Moved in 1999 to March 2000 (%) - Multirace
Year householder moved into unit - Moved in 1999 to March 2000 (%) - Other Race
Year householder moved into unit - Moved in 1995 to 1998 (%)
Year householder moved into unit - Moved in 1995 to 1998 (%) - White
Year householder moved into unit - Moved in 1995 to 1998 (%) - Black or African American
Year householder moved into unit - Moved in 1995 to 1998 (%) - Asian
Year householder moved into unit - Moved in 1995 to 1998 (%) - Hispanic or Latino
Year householder moved into unit - Moved in 1995 to 1998 (%) - American Indian and Alaska Native
Year householder moved into unit - Moved in 1995 to 1998 (%) - Multirace
Year householder moved into unit - Moved in 1995 to 1998 (%) - Other Race
Year householder moved into unit - Moved in 1990 to 1994 (%)
Year householder moved into unit - Moved in 1990 to 1994 (%) - White
Year householder moved into unit - Moved in 1990 to 1994 (%) - Black or African American
Year householder moved into unit - Moved in 1990 to 1994 (%) - Asian
Year householder moved into unit - Moved in 1990 to 1994 (%) - Hispanic or Latino
Year householder moved into unit - Moved in 1990 to 1994 (%) - American Indian and Alaska Native
Year householder moved into unit - Moved in 1990 to 1994 (%) - Multirace
Year householder moved into unit - Moved in 1990 to 1994 (%) - Other Race
Year householder moved into unit - Moved in 1980 to 1989 (%)
Year householder moved into unit - Moved in 1980 to 1989 (%) - White
Year householder moved into unit - Moved in 1980 to 1989 (%) - Black or African American
Year householder moved into unit - Moved in 1980 to 1989 (%) - Asian
Year householder moved into unit - Moved in 1980 to 1989 (%) - Hispanic or Latino
Year householder moved into unit - Moved in 1980 to 1989 (%) - American Indian and Alaska Native
Year householder moved into unit - Moved in 1980 to 1989 (%) - Multirace
Year householder moved into unit - Moved in 1980 to 1989 (%) - Other Race
Year householder moved into unit - Moved in 1970 to 1979 (%)
Year householder moved into unit - Moved in 1970 to 1979 (%) - White
Year householder moved into unit - Moved in 1970 to 1979 (%) - Black or African American
Year householder moved into unit - Moved in 1970 to 1979 (%) - Asian
Year householder moved into unit - Moved in 1970 to 1979 (%) - Hispanic or Latino
Year householder moved into unit - Moved in 1970 to 1979 (%) - American Indian and Alaska Native
Year householder moved into unit - Moved in 1970 to 1979 (%) - Multirace
Year householder moved into unit - Moved in 1970 to 1979 (%) - Other Race
Year householder moved into unit - Moved in 1969 or earlier (%)
Year householder moved into unit - Moved in 1969 or earlier (%) - White
Year householder moved into unit - Moved in 1969 or earlier (%) - Black or African American
Year householder moved into unit - Moved in 1969 or earlier (%) - Asian
Year householder moved into unit - Moved in 1969 or earlier (%) - Hispanic or Latino
Year householder moved into unit - Moved in 1969 or earlier (%) - American Indian and Alaska Native
Year householder moved into unit - Moved in 1969 or earlier (%) - Multirace
Year householder moved into unit - Moved in 1969 or earlier (%) - Other Race
Housing units lacking complete plumbing facilities (%)
Housing units lacking complete kitchen facilities (%)
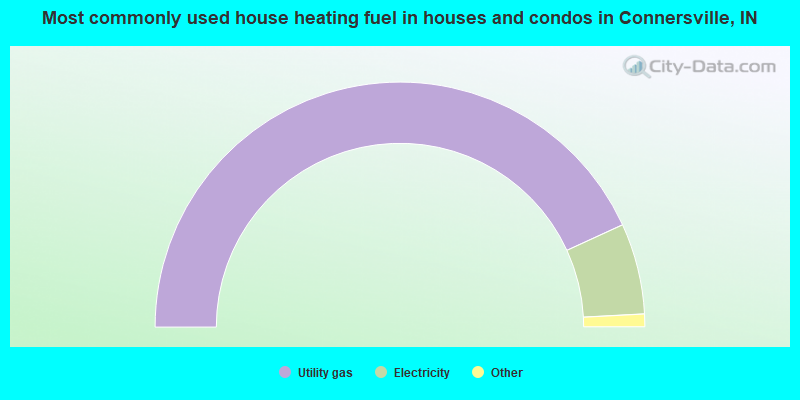
House heating fuel used in houses and condos - Utility gas (%)
House heating fuel used in houses and condos - Bottled, tank, or LP gas (%)
House heating fuel used in houses and condos - Electricity (%)
House heating fuel used in houses and condos - Fuel oil, kerosene, etc. (%)
House heating fuel used in houses and condos - Coal or coke (%)
House heating fuel used in houses and condos - Wood (%)
House heating fuel used in houses and condos - Solar energy (%)
House heating fuel used in houses and condos - Other fuel (%)
House heating fuel used in houses and condos - No fuel used (%)
House heating fuel used in apartments - Utility gas (%)
House heating fuel used in apartments - Bottled, tank, or LP gas (%)
House heating fuel used in apartments - Electricity (%)
House heating fuel used in apartments - Fuel oil, kerosene, etc. (%)
House heating fuel used in apartments - Coal or coke (%)
House heating fuel used in apartments - Wood (%)
House heating fuel used in apartments - Solar energy (%)
House heating fuel used in apartments - Other fuel (%)
House heating fuel used in apartments - No fuel used (%)
Latest news about housing in Connersville, IN collected exclusively by city-data.com from local newspapers, TV, and radio stations
Median year house/condo built: 1948Median year apartment built: 1968Household type by relationship:
Households: 13,491
Male householders: 2,952 (947 living alone ), Female householders: 2,794 (1,234 living alone )2,060 spouses (2,051 opposite-sex spouses ), 450 unmarried partners , (436 opposite-sex unmarried partners ), 3,023 children (2,779 natural , 138 adopted , 104 stepchildren ), 914 grandchildren , 0 brothers or sisters , 65 parents , 10 foster children , 368 other relatives , 574 non-relatives In group quarters: 276
Size of family households: 1,655 2-persons , 547 3-persons , 623 4-persons , 236 5-persons , 160 6-persons , 39 7-or-more-persons .
Size of nonfamily households: 2,237 1-person , 287 2-persons , 40 3-persons , 9 4-persons , 28 5-persons .
1,132 married couples with children. single-parent households (319 men , 492 women ).
95.9% of residents of Connersville speak English at home. of residents speak Spanish at home (54% speak English very well , 46% speak English well ).of residents speak other Indo-European language at home (44% speak English very well , 5% speak English well , 50% speak English not well ).of residents speak other language at home (100% speak English very well ).
Foreign born population: 272 (2.0%)of them are naturalized citizens )
Median number of rooms in houses and condos:
Median number of rooms in apartments
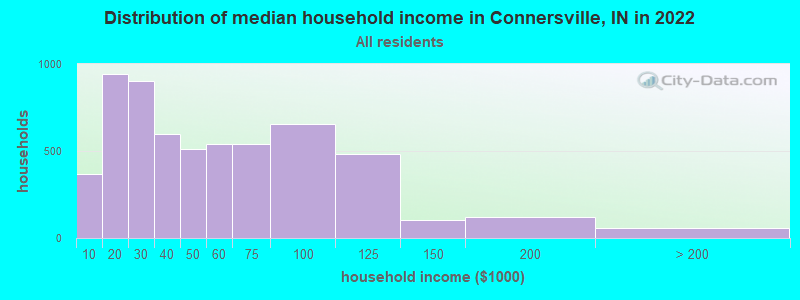
Connersville, IN household income distribution 366 Less than $10,000945 $10,000 to $19,999902 $20,000 to $29,999597 $30,000 to $39,999514 $40,000 to $49,999540 $50,000 to $59,999541 $60,000 to $74,999656 $75,000 to $99,999482 $100,000 to $124,999102 $125,000 to $149,999120 $150,000 to $199,99960 $200,000 or more
Home value of owner - occupied houses in 2022 in Connersville, IN 70 Less than $10,00055 $10,000 to $14,99914 $15,000 to $19,99922 $20,000 to $24,99917 $25,000 to $29,99957 $30,000 to $34,99989 $35,000 to $39,999200 $40,000 to $49,999197 $50,000 to $59,999138 $60,000 to $69,999355 $70,000 to $79,999341 $80,000 to $89,999297 $90,000 to $99,999328 $100,000 to $124,999317 $125,000 to $149,999151 $150,000 to $174,99977 $175,000 to $199,99949 $200,000 to $249,99952 $250,000 to $299,99933 $300,000 to $399,999141 $400,000 to $499,99915 $500,000 to $749,999Rent paid by renters in 2022 in Connersville, IN 26 Less than $10081 $150 to $1996 $200 to $24941 $250 to $29941 $300 to $34914 $350 to $399292 $400 to $44952 $450 to $499354 $500 to $549237 $550 to $599249 $600 to $649201 $650 to $699133 $700 to $74986 $750 to $799257 $800 to $89964 $900 to $99931 $1,000 to $1,2496 $3,000 to $3,49980 No cash rent
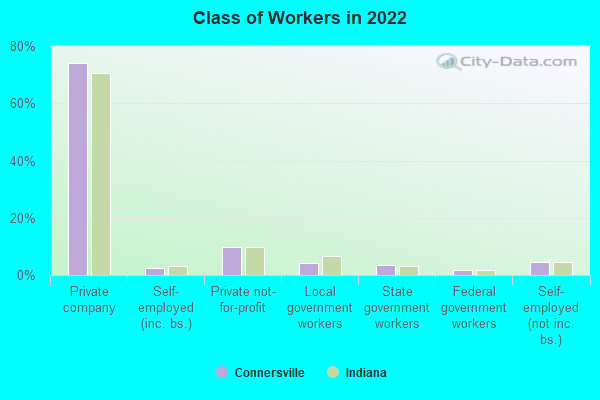
Percentage of workers working in this county: 62.3%Number of people working at home: 229 (4.0% of all workers )
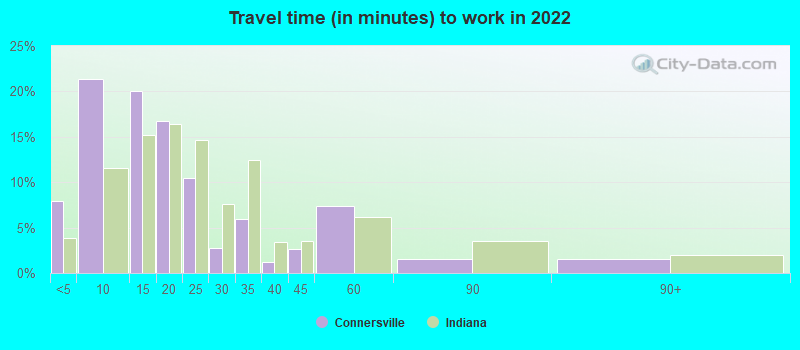
Travel time to work (commute)
Less than 5 minutes: 5095 to 9 minutes: 1,29410 to 14 minutes: 90315 to 19 minutes: 46020 to 24 minutes: 25825 to 29 minutes: 15830 to 34 minutes: 24135 to 39 minutes: 8440 to 44 minutes: 19945 to 59 minutes: 67760 to 89 minutes: 36090 or more minutes: 150
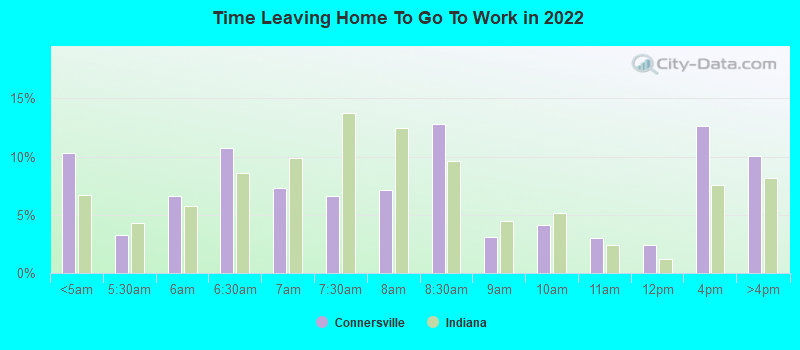
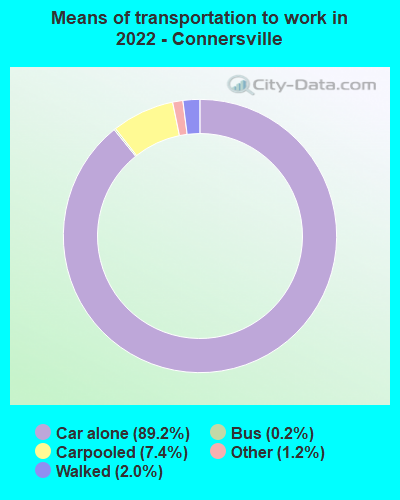
Means of transportation to work:
Drove a car alone: 5,302 (83.4%)Carpooled: 482 (7.6%)Bus : 10 (0.2%)Taxi: 85 (1.3%)Walked: 121 (1.9%)Worked at home: 229 (3.6%)
Unemployment by race in 2022
Unemployment rate for White non-Hispanic residents 4.9% Males4.4% FemalesUnemployment rate for two or more race residents 10.7% Males
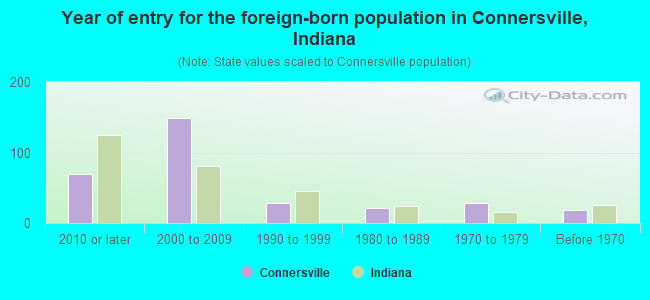
Year of entry for the foreign-born population in Connersville, Indiana
69 2010 or later 149 2000 to 2009 28 1990 to 1999 21 1980 to 1989 29 1970 to 1979 19 Before 1970
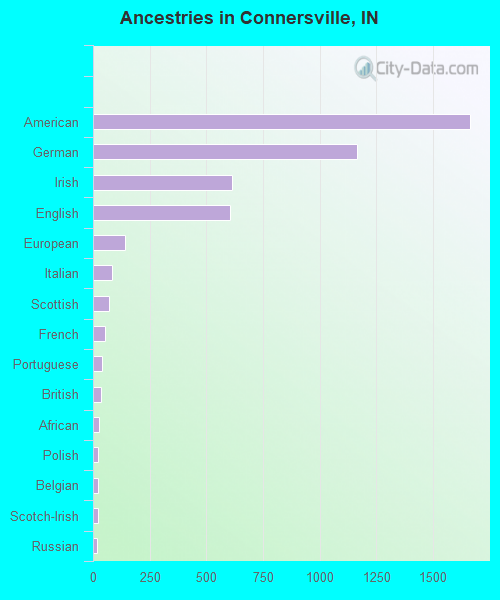
First ancestries reported:
American: 1,665 (28.2%)
German: 1,167 (19.8%)
Irish: 613 (10.4%)
English: 606 (10.3%)
European: 142 (2.4%)
Italian: 86 (1.5%)
Scottish: 71 (1.2%)
French: 54 (0.9%)
Portuguese: 40 (0.7%)
British: 35 (0.6%)
African: 26 (0.4%)
Polish: 24 (0.4%)
Belgian: 21 (0.4%)
Scotch-Irish: 21 (0.4%)
Russian: 18 (0.3%)
Scandinavian: 12 (0.2%)
Dutch: 10 (0.2%)
Welsh: 10 (0.2%)
New Zealander: 6 (0.1%)
Hungarian: 4 (0.07%) Most common places of birth for foreign-born residents (%): Mexico Connersville:
41.9% (114)Indiana:
27.0% (101,996)
Guatemala Connersville:
29.8% (81)Indiana:
2.3% (8,656)
Other Western Africa Connersville:
16.2% (44)Indiana:
0.6% (2,251)
Russia Connersville:
6.2% (17)Indiana:
0.9% (3,307)
Venezuela Connersville:
3.3% (9)Indiana:
1.8% (6,718)
Iraq Connersville:
2.6% (7)Indiana:
0.2% (599)
Place of birth for U.S.-born residents:
This state: 9,878Other state: 3,208Northeast: 307Midwest: 1,919South: 762West: 222 83.4% of Connersville residents lived in the same house 1 years ago.
Out of people who lived in different houses, 32.9% lived in this county.
Out of people who lived in different counties, 84.7% lived in Indiana.
Connersville:
83.4%State average:
87.1%
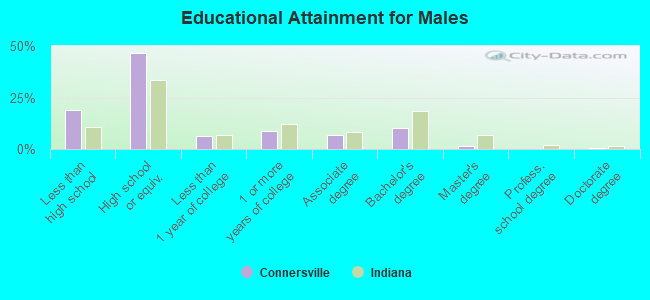
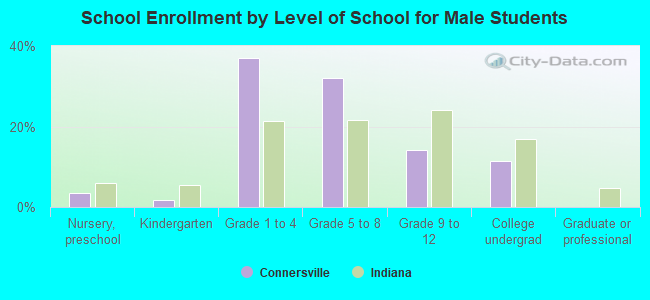
Education attainment for males 25 years and older:
No schooling: 125Nursery to 4th grade: 05th and 6th grade: 1327th and 8th grade: 789th grade: 6310th grade: 15611th grade: 16812th grade, no diploma: 111High school graduate (or equivalency): 2,027Less than 1 year of college: 283Some college more than 1 year, no degree: 391Associate degree: 301Bachelor's degree: 438Master's degree: 72Professional school degree: 2Doctorate degree: 20
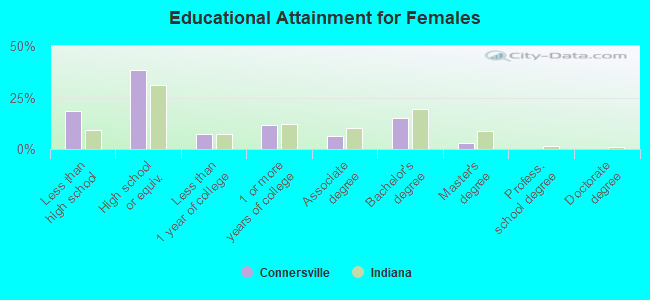
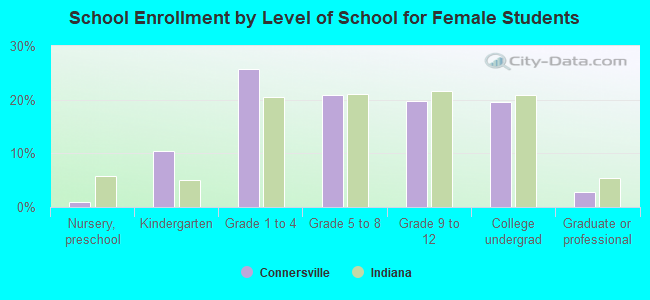
Education attainment for females 25 years and older:
No schooling: 59Nursery to 4th grade: 05th and 6th grade: 37th and 8th grade: 2219th grade: 14210th grade: 19311th grade: 14112th grade, no diploma: 101High school graduate (or equivalency): 1,788Less than 1 year of college: 327Some college more than 1 year, no degree: 537Associate degree: 301Bachelor's degree: 688Master's degree: 135Professional school degree: 2Doctorate degree: 8
Housing units in structures:
One, detached: 5,032One, attached: 74Two: 3023 or 4: 3915 to 9: 13210 to 19: 10820 to 49: 8050 or more: 270Mobile homes: 144Median worth of mobile homes: $11,413
Housing units lacking complete plumbing facilities in 2022: 3.4%Housing units lacking complete kitchen facilities in 2022: 2.2%House/condo owner moved in on average 9 years ago
Renter moved in on average 4 years ago
Private vs. public school enrollment:
Students in private schools in grades 1 to 8 (elementary and middle school): 279 Students in private schools in grades 9 to 12 (high school): 85 Students in private undergraduate colleges: 76