Conway, FL (Florida) Houses and Residents
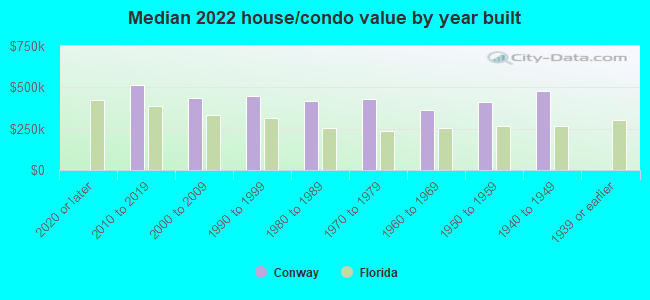
| Conway: | $395,558 |
| Florida: | $354,100 |
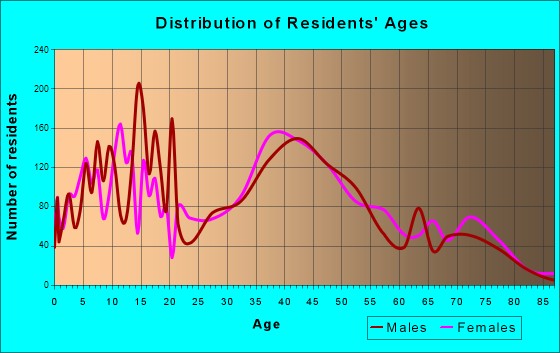
Total population: 13,467 (All urban)
Houses: 5,735 (5,409 occupied: 4,868 owner occupied, 906 renter occupied)
| % of renters here: | 16% |
| State: | 33% |
Housing density: 1,662 houses/condos per square mile
Median price asked for vacant for-sale houses and condos in 2022: $285,650.
Median contract rent in 2022: $1,265 (lower quartile is $1,104, upper quartile is $1,481)
Median rent asked for vacant for-rent units in 2022: $1,764
Median gross rent in Conway, FL in 2022: $1,445
Housing units in Conway with a mortgage: 3,254 (556 second mortgage, 9 home equity loan, 401 both second mortgage and home equity loan)
Houses without a mortgage: 83
Median household income for houses/condos with a mortgage: $106,692
Median household income for apartments without a mortgage: $73,365
Median monthly housing costs: $1,470
Compare current foreclosures near Conway, FL:
| Photo | Address | Area | Beds / Baths | Price | Details |
|---|---|---|---|---|---|

|
#1
Idaho Ave
Orlando, FL 32809
|
1,326 sq. feet
|
2 baths 3 beds |
$279,000
|
show details |

|
#2
Ambassador Dr
Orlando, FL 32818
|
2,120 sq. feet
|
2 baths 4 beds |
$218,400
|
show details |

|
#3
Ford St
Orlando, FL 32811
|
726 sq. feet
|
1 baths 2 beds |
$255,000
|
show details |

|
#4
Anzle Ave
Winter Park, FL 32789
|
1,808 sq. feet
|
2 baths 3 beds |
$574,900
|
show details |

|
#5
Anna Dr
Apopka, FL 32703
|
864 sq. feet
|
1 baths 3 beds |
$146,500
|
show details |

|
#6
Cannon Way
Casselberry, FL 32707
|
1,428 sq. feet
|
1 baths 3 beds |
$345,000
|
show details |

|
#7
Bahia Ave
Orlando, FL 32807
|
1,877 sq. feet
|
1 baths 3 beds |
show details | |

|
#8
Palio Ct
Ocoee, FL 34761
|
3,227 sq. feet
|
3 baths 4 beds |
show details | |

|
#9
N Hart Blvd
Orlando, FL 32835
|
1,296 sq. feet
|
2 baths 3 beds |
show details | |

|
#10
Oyster Bay Cir Apt 100
Altamonte Springs, FL 32701
|
992 sq. feet
|
2 baths 2 beds |
show details |
| Photo | Address | Area | Beds / Baths | Price | Details |
|---|---|---|---|---|---|

|
#11
Ayden Oak Ln
Ocoee, FL 34761
|
2,706 sq. feet
|
4 baths 4 beds |
show details | |

|
#12
Biscayne Dr
Orlando, FL 32804
|
2,758 sq. feet
|
3 baths 4 beds |
show details | |

|
#13
Shady Willow Dr
Orlando, FL 32808
|
1,460 sq. feet
|
2 baths 3 beds |
show details | |

|
#14
Nan Dr
Ocoee, FL 34761
|
1,753 sq. feet
|
2 baths 3 beds |
show details | |

|
#15
Pineview Way
Apopka, FL 32703
|
1,299 sq. feet
|
2 baths 3 beds |
show details | |

|
#16
Blanton Ct
Orlando, FL 32809
|
1,425 sq. feet
|
2 baths 3 beds |
show details | |

|
#17
Formax Dr
Orlando, FL 32828
|
1,793 sq. feet
|
2 baths 3 beds |
show details | |

|
#18
Shackley Pl
Apopka, FL 32703
|
1,920 sq. feet
|
2 baths 3 beds |
show details | |

|
#19
N Hastings St
Orlando, FL 32808
|
1,220 sq. feet
|
2 baths 3 beds |
show details | |

|
#20
Empire Ave
Orlando, FL 32810
|
1,612 sq. feet
|
1 baths 2 beds |
show details |
| Photo | Address | Area | Beds / Baths | Price | Details |
|---|---|---|---|---|---|

|
#21
Oak Dr
Longwood, FL 32779
|
1,922 sq. feet
|
2 baths 3 beds |
show details | |

|
#22
Windcrest Lake Cir
Orlando, FL 32824
|
2,959 sq. feet
|
2 baths 4 beds |
show details | |

|
#23
Youngford St
Orlando, FL 32824
|
2,027 sq. feet
|
3 baths 4 beds |
show details | |

|
#24
Cherry Grove Cir
Orlando, FL 32809
|
1,895 sq. feet
|
2 baths 3 beds |
show details | |

|
#25
Brisbane Ct
Orlando, FL 32835
|
1,473 sq. feet
|
2 baths 3 beds |
show details | |

|
#26
Luzon Dr
Orlando, FL 32809
|
1,225 sq. feet
|
2 baths 3 beds |
show details | |

|
#27
Lyman St
Ocoee, FL 34761
|
1,197 sq. feet
|
1 baths 3 beds |
show details | |

|
#28
Margaret Ct
Orlando, FL 32801
|
2,993 sq. feet
|
3 baths 4 beds |
show details | |

|
#29
Guildhall Cir
Orlando, FL 32828
|
2,634 sq. feet
|
3 baths 4 beds |
show details | |

|
#30
Dianjo Dr
Orlando, FL 32810
|
1,539 sq. feet
|
2 baths 4 beds |
show details |
| Photo | Address | Area | Beds / Baths | Price | Details |
|---|---|---|---|---|---|

|
#31
Crayford Ave
Orlando, FL 32837
|
1,964 sq. feet
|
2 baths 3 beds |
show details | |

|
#32
Kantor Blvd
Casselberry, FL 32707
|
1,511 sq. feet
|
2 baths 3 beds |
show details | |

|
#33
Bridgeton Ln
Orlando, FL 32817
|
1,569 sq. feet
|
2 baths 3 beds |
show details | |

|
#34
Aguila Pl
Orlando, FL 32826
|
1,958 sq. feet
|
2 baths 4 beds |
show details | |

|
#35
W Cottesmore Cir
Longwood, FL 32779
|
1,861 sq. feet
|
2 baths 4 beds |
show details | |

|
#36
Hunley Ave
Apopka, FL 32703
|
2,477 sq. feet
|
2 baths 4 beds |
show details | |

|
#37
Natchez Trace Blvd
Orlando, FL 32818
|
1,398 sq. feet
|
2 baths 3 beds |
show details | |

|
#38
Meridian Way
Orlando, FL 32808
|
1,244 sq. feet
|
2 baths 3 beds |
show details | |

|
#39
Alfred Dr
Orlando, FL 32810
|
1,752 sq. feet
|
2 baths 3 beds |
show details | |

|
#40
Atlin Dr
Orlando, FL 32837
|
1,018 sq. feet
|
2 baths 2 beds |
show details |
| Photo | Address | Area | Beds / Baths | Price | Details |
|---|---|---|---|---|---|

|
#41
Mandolin Dr
Kissimmee, FL 34744
|
2,392 sq. feet
|
2 baths 3 beds |
show details | |

|
#42
Forest St
Orlando, FL 32806
|
1,971 sq. feet
|
2 baths 3 beds |
show details | |

|
#43
Tenita Dr
Winter Park, FL 32792
|
2,104 sq. feet
|
2 baths 4 beds |
show details | |

|
#44
Conway Rd Apt 4
Orlando, FL 32812
|
1,238 sq. feet
|
1 baths 2 beds |
show details | |

|
#45
Delcrest Dr
Orlando, FL 32817
|
2,053 sq. feet
|
2 baths 3 beds |
show details | |

|
#46
Autumn Chase Cir
Sanford, FL 32773
|
2,465 sq. feet
|
3 baths 4 beds |
show details | |

|
#47
Cardiff Dr
Orlando, FL 32837
|
1,490 sq. feet
|
2 baths 4 beds |
show details | |

|
#48
Simmons Rd
Orlando, FL 32812
|
3,936 sq. feet
|
3 baths 4 beds |
show details | |

|
#49
Buttercup Ln
Orlando, FL 32825
|
1,220 sq. feet
|
1 baths 3 beds |
show details | |

|
Check over 1 million property listings on Foreclosure.com!
|
browse all offers | |||

Latest news about housing in Conway, FL collected exclusively by city-data.com from local newspapers, TV, and radio stations

 | Housing bubble? (42 replies) |
| Excessive homes selling conway area (1 reply) |
| Buying a home (Single, 35f, 2020 Edition) (29 replies) |
| Apartments in Orlando area (8 replies) |
| Rising Housing Costs vs. Stagnant Incomes - What will come of it? (102 replies) |
| Best places to live near Downtown Orlando? (22 replies) |
Median year apartment built: 1981
Household type by relationship:
Households: 13,758- Male householders: 2,446 (393 living alone), Female householders: 2,844 (694 living alone)
2,931 spouses (2,897 opposite-sex spouses), 349 unmarried partners, (349 opposite-sex unmarried partners), 3,712 children (3,404 natural, 20 adopted, 288 stepchildren), 217 grandchildren, 110 brothers or sisters, 252 parents, 0 foster children, 537 other relatives, 351 non-relatives
- In group quarters: 5
Size of family households: 2,062 2-persons, 1,071 3-persons, 781 4-persons, 204 5-persons, 87 6-persons, 50 7-or-more-persons.
Size of nonfamily households: 1,201 1-person, 270 2-persons, 27 3-persons.
1,636 married couples with children.
611 single-parent households (372 men, 239 women).
81.1% of residents of Conway speak English at home.
14.1% of residents speak Spanish at home (73% speak English very well, 15% speak English well, 4% speak English not well, 8% don't speak English at all).
3.8% of residents speak other Indo-European language at home (84% speak English very well, 16% speak English well).
1.1% of residents speak Asian or Pacific Island language at home (80% speak English very well, 11% speak English well, 9% speak English not well).
0.3% of residents speak other language at home (38% speak English very well, 20% speak English well, 42% speak English not well).
Foreign born population: 1,409 (10.2%)
(65.6% of them are naturalized citizens)
| Here: | 6.8 |
| State: | 5.9 |
| Here: | 5.1 |
| State: | 4.2 |
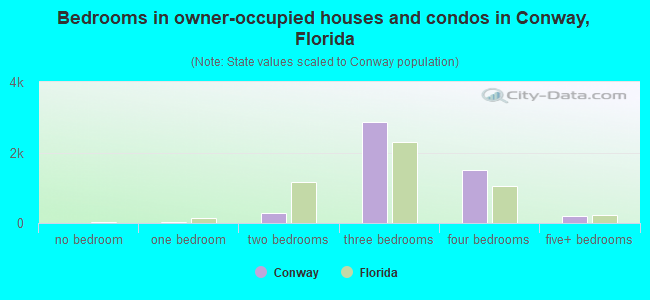
- Bedrooms in owner-occupied houses and condos in Conway, Florida
- 0no bedroom
- 371 bedroom
- 2742 bedrooms
- 2,8673 bedrooms
- 1,5044 bedrooms
- 1875+ bedrooms
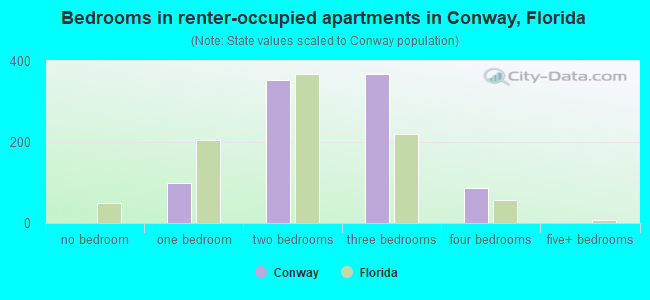
- Bedrooms in renter-occupied apartments in Conway, Florida
- 0no bedroom
- 981 bedroom
- 3532 bedrooms
- 3693 bedrooms
- 874 bedrooms
- 05+ bedrooms
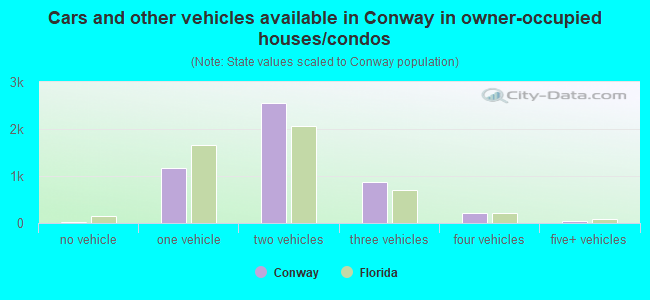
- Cars and other vehicles available in Conway in owner-occupied houses/condos
- 26no vehicle
- 1,1631 vehicle
- 2,5562 vehicles
- 8643 vehicles
- 2104 vehicles
- 505+ vehicles
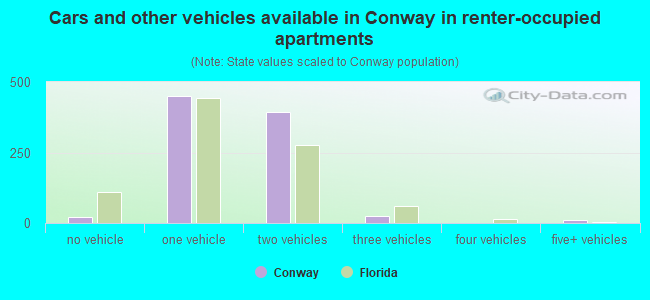
- Cars and other vehicles available in Conway in renter-occupied apartments
- 23no vehicle
- 4511 vehicle
- 3952 vehicles
- 263 vehicles
- 04 vehicles
- 115+ vehicles
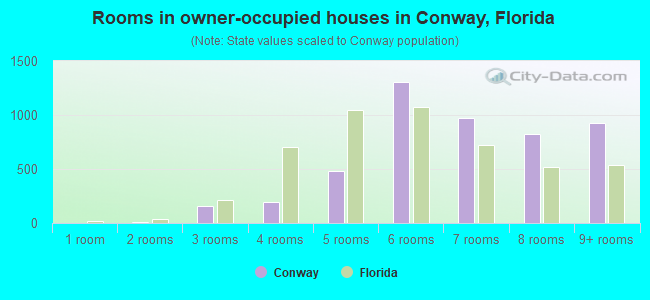
- Rooms in owner-occupied houses in Conway, Florida
- 01 room
- 92 rooms
- 1543 rooms
- 1924 rooms
- 4795 rooms
- 1,3096 rooms
- 9727 rooms
- 8248 rooms
- 9299+ rooms
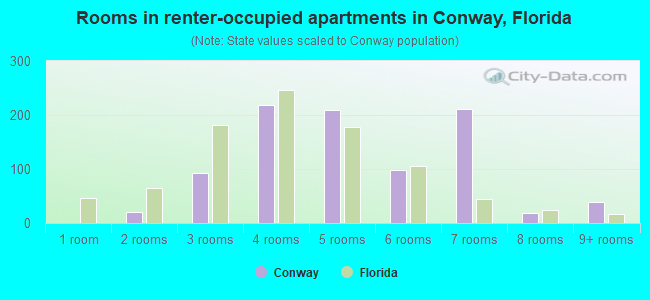
- Rooms in renter-occupied apartments in Conway, Florida
- 01 room
- 202 rooms
- 933 rooms
- 2184 rooms
- 2095 rooms
- 996 rooms
- 2117 rooms
- 188 rooms
- 399+ rooms
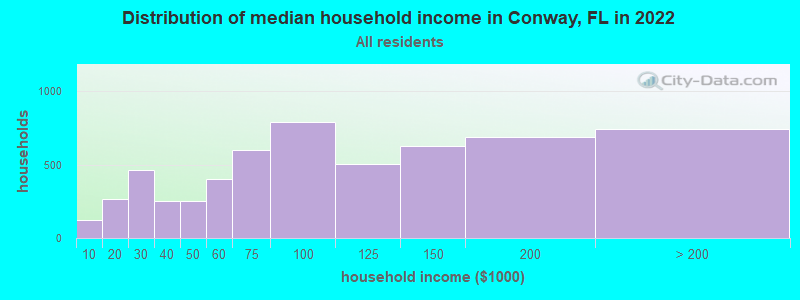
Conway, FL household income distribution

- 124Less than $10,000
- 269$10,000 to $19,999
- 467$20,000 to $29,999
- 249$30,000 to $39,999
- 249$40,000 to $49,999
- 405$50,000 to $59,999
- 598$60,000 to $74,999
- 791$75,000 to $99,999
- 505$100,000 to $124,999
- 627$125,000 to $149,999
- 686$150,000 to $199,999
- 742$200,000 or more
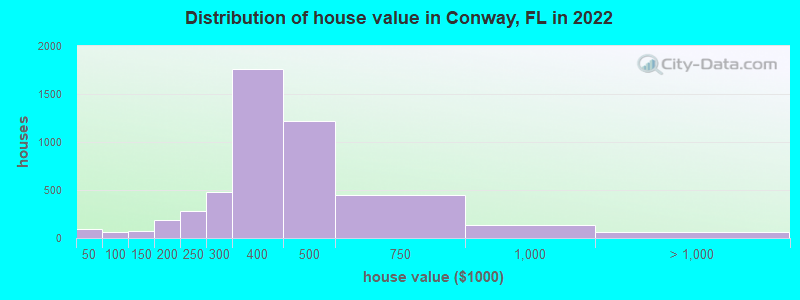
Home value of owner - occupied houses in 2022 in Conway, FL
-
- 6Less than $10,000
- 4$10,000 to $14,999
- 17$15,000 to $19,999
- 13$30,000 to $34,999
- 37$35,000 to $39,999
- 17$40,000 to $49,999
- 3$50,000 to $59,999
- 12$80,000 to $89,999
- 29$90,000 to $99,999
- 15$100,000 to $124,999
- 59$125,000 to $149,999
- 119$150,000 to $174,999
- 72$175,000 to $199,999
- 286$200,000 to $249,999
- 481$250,000 to $299,999
- 1,759$300,000 to $399,999
- 1,223$400,000 to $499,999
- 449$500,000 to $749,999
- 137$750,000 to $999,999
- 56$1,000,000 to $1,499,999
- 10$2,000,000 or more
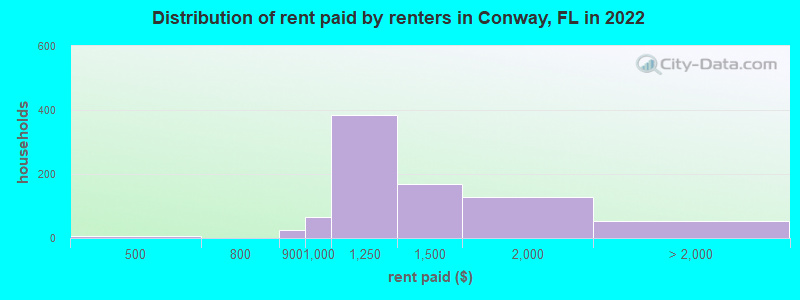
Rent paid by renters in 2022 in Conway, FL
-
- 5$450 to $499
- 26$800 to $899
- 66$900 to $999
- 382$1,000 to $1,249
- 169$1,250 to $1,499
- 128$1,500 to $1,999
- 34$2,000 to $2,499
- 17No cash rent
Percentage of workers working in this county: 90.9%
Number of people working at home: 1,318 (17.1% of all workers)
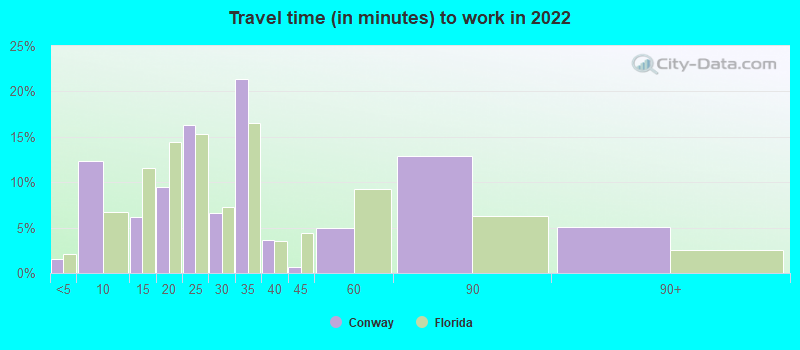
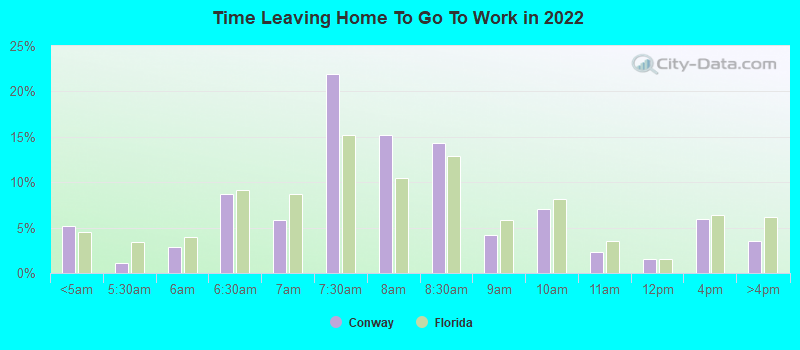
Travel time to work (commute)
- Less than 5 minutes: 33
- 5 to 9 minutes: 251
- 10 to 14 minutes: 322
- 15 to 19 minutes: 1,043
- 20 to 24 minutes: 1,470
- 25 to 29 minutes: 739
- 30 to 34 minutes: 1,303
- 35 to 39 minutes: 321
- 40 to 44 minutes: 174
- 45 to 59 minutes: 238
- 60 to 89 minutes: 262
- 90 or more minutes: 195
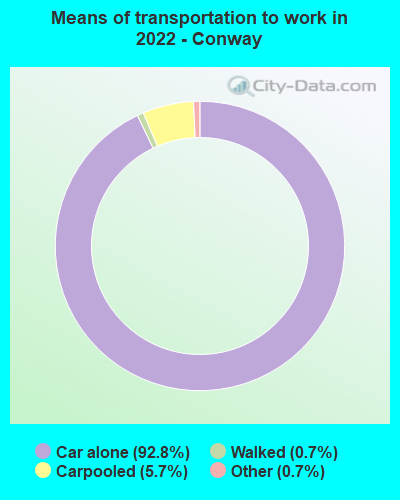
Means of transportation to work:
- Drove a car alone: 1,118 (51.1%)
- Carpooled: 73 (3.3%)
- Taxi: 9 (0.4%)
- Walked: 11 (0.5%)
- Worked at home: 1,318 (60.2%)
- Unemployment by race in 2022
- Unemployment rate for White non-Hispanic residents
- 1.3%Males
- 3.0%Females
- Unemployment rate for Black residents
- 4.1%Females
- Unemployment rate for other race residents
- 6.6%Females
- Unemployment rate for two or more race residents
- 2.7%Males
- 2.6%Females
- Unemployment rate for Hispanic or Latino residents
- 1.3%Females
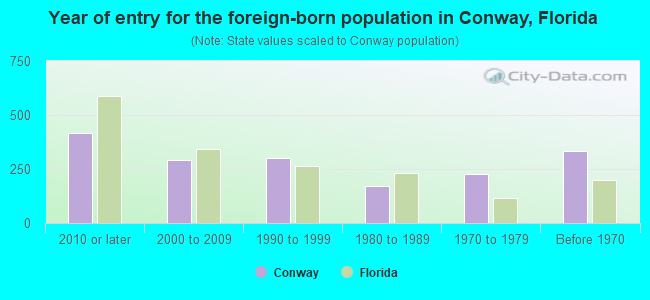
- Year of entry for the foreign-born population in Conway, Florida
- 4182010 or later
- 2912000 to 2009
- 2991990 to 1999
- 1731980 to 1989
- 2291970 to 1979
- 332Before 1970
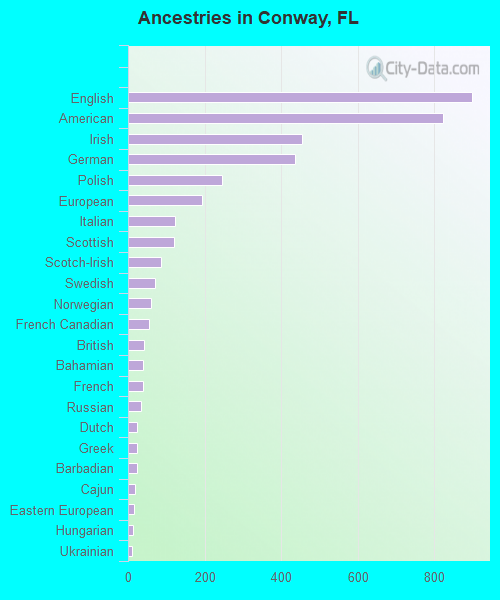
First ancestries reported:
- English: 898 (13.9%)
- American: 824 (12.8%)
- Irish: 455 (7.1%)
- German: 436 (6.8%)
- Polish: 245 (3.8%)
- European: 192 (3.0%)
- Italian: 124 (1.9%)
- Scottish: 119 (1.8%)
- Scotch-Irish: 85 (1.3%)
- Swedish: 71 (1.1%)
- Norwegian: 61 (0.9%)
- French Canadian: 54 (0.8%)
- British: 41 (0.6%)
- Bahamian: 40 (0.6%)
- French: 38 (0.6%)
- Russian: 35 (0.5%)
- Dutch: 24 (0.4%)
- Greek: 23 (0.4%)
- Barbadian: 23 (0.4%)
- Cajun: 17 (0.3%)
- Eastern European: 16 (0.2%)
- Hungarian: 13 (0.2%)
- Ukrainian: 11 (0.2%)
- Czech: 8 (0.1%)
- Portuguese: 8 (0.1%)
- Canadian: 2 (0.03%)
- Israeli: 1 (0.02%)
Most common places of birth for foreign-born residents (%):
| Conway: | 21.7% (302) |
| Florida: | 22.0% (1,006,576) |
| Conway: | 14.0% (194) |
| Florida: | 6.5% (298,669) |
| Conway: | 13.5% (187) |
| Florida: | 2.1% (94,349) |
| Conway: | 4.3% (60) |
| Florida: | 2.3% (105,066) |
| Conway: | 3.3% (46) |
| Florida: | 1.3% (60,604) |
| Conway: | 3.2% (45) |
| Florida: | 0.8% (37,723) |
| Conway: | 3.2% (45) |
| Florida: | 5.7% (262,042) |
| Conway: | 3.0% (41) |
| Florida: | 1.2% (56,071) |
| Conway: | 2.7% (38) |
| Florida: | 0.3% (13,569) |
| Conway: | 2.4% (34) |
| Florida: | 2.1% (96,693) |
| Conway: | 2.3% (32) |
| Florida: | 0.4% (17,749) |
| Conway: | 2.1% (29) |
| Florida: | 5.0% (227,319) |
| Conway: | 1.9% (27) |
| Florida: | 1.2% (54,272) |
| Conway: | 1.9% (27) |
| Florida: | 0.3% (13,998) |
| Conway: | 1.9% (26) |
| Florida: | 0.1% (2,947) |
| Conway: | 1.7% (24) |
| Florida: | 2.4% (109,132) |
| Conway: | 1.7% (23) |
| Florida: | 0.0% (586) |
| Conway: | 1.6% (22) |
| Florida: | 0.2% (9,990) |
Place of birth for U.S.-born residents:
- This state: 6,220
- Other state: 5,446
- Northeast: 1,887
- Midwest: 1,761
- South: 1,377
- West: 355
90.0% of Conway residents lived in the same house 1 years ago.
Out of people who lived in different houses, 41.4% lived in this county.
Out of people who lived in different counties, 59.0% lived in Florida.
| Conway: | 90.0% |
| State average: | 86.3% |
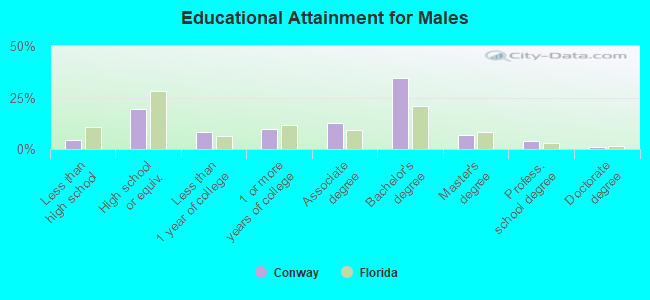
Education attainment for males 25 years and older:
- No schooling: 17
- Nursery to 4th grade: 9
- 5th and 6th grade: 0
- 7th and 8th grade: 10
- 9th grade: 41
- 10th grade: 34
- 11th grade: 26
- 12th grade, no diploma: 72
- High school graduate (or equivalency): 945
- Less than 1 year of college: 402
- Some college more than 1 year, no degree: 466
- Associate degree: 616
- Bachelor's degree: 1,686
- Master's degree: 335
- Professional school degree: 197
- Doctorate degree: 40
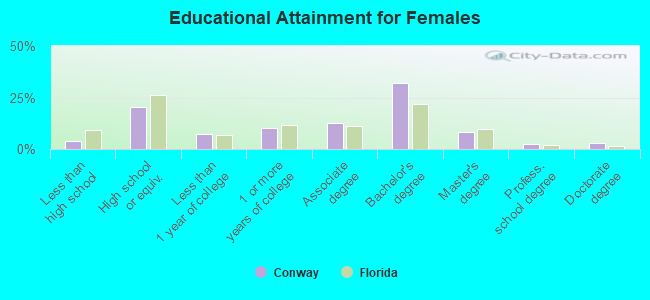
Education attainment for females 25 years and older:
- No schooling: 48
- Nursery to 4th grade: 62
- 5th and 6th grade: 1
- 7th and 8th grade: 0
- 9th grade: 0
- 10th grade: 28
- 11th grade: 52
- 12th grade, no diploma: 36
- High school graduate (or equivalency): 1,153
- Less than 1 year of college: 403
- Some college more than 1 year, no degree: 593
- Associate degree: 717
- Bachelor's degree: 1,838
- Master's degree: 475
- Professional school degree: 143
- Doctorate degree: 158
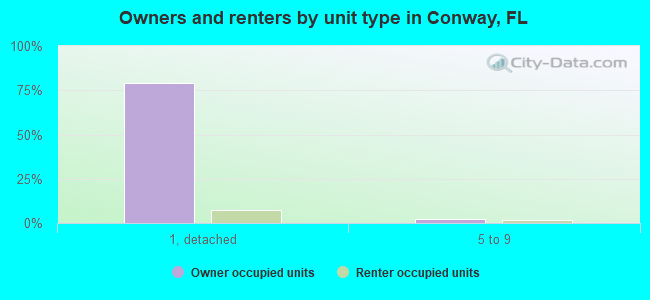
Housing units in structures:
- One, detached: 5,050
- One, attached: 32
- Two: 34
- 3 or 4: 235
- 5 to 9: 192
- 10 to 19: 96
- 20 to 49: 10
- 50 or more: 11
- Mobile homes: 66
- Boats, RVs, vans, etc.: 5
Median worth of mobile homes: $119,106
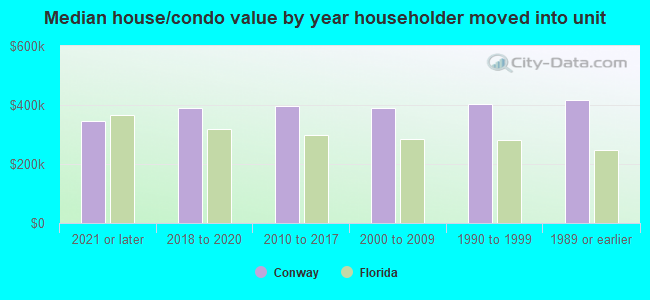
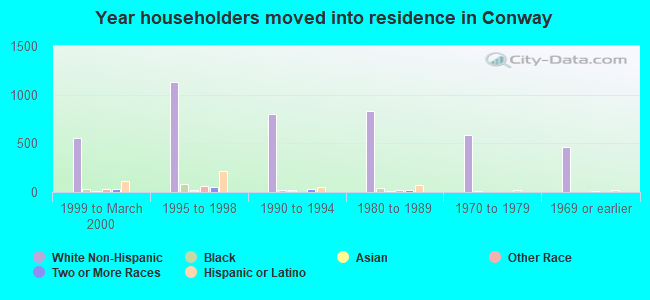
House/condo owner moved in on average 15 years ago
Renter moved in on average 6 years ago
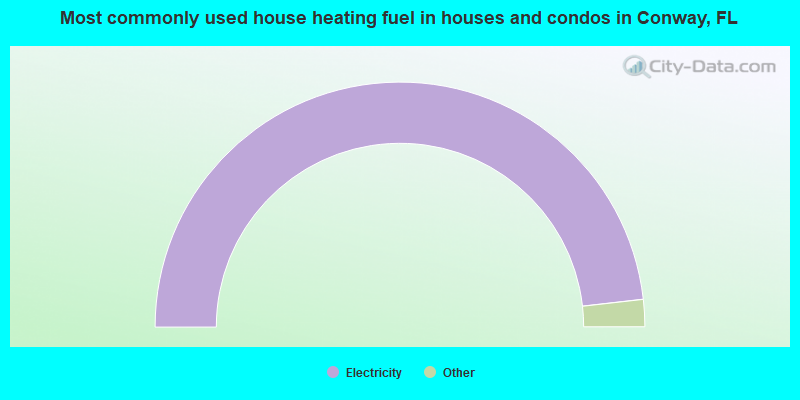
- 96.4%Electricity
- 1.7%Utility gas
- 0.9%No fuel used
- 0.7%Fuel oil, kerosene, etc.
- 0.2%Bottled, tank, or LP gas
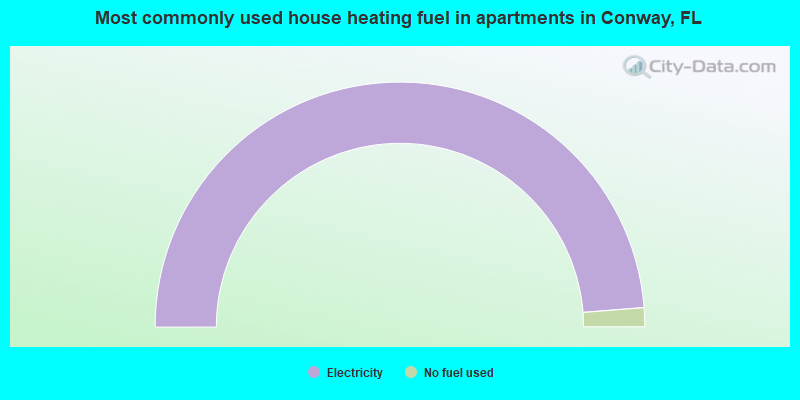
- 97.5%Electricity
- 2.5%No fuel used
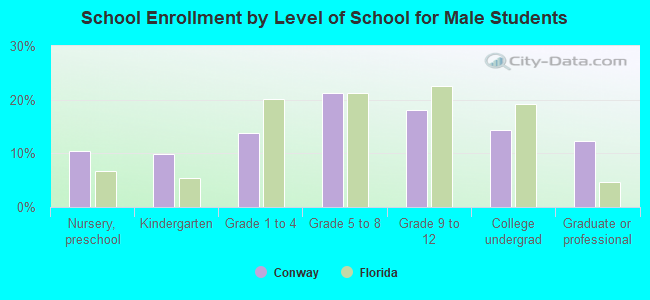
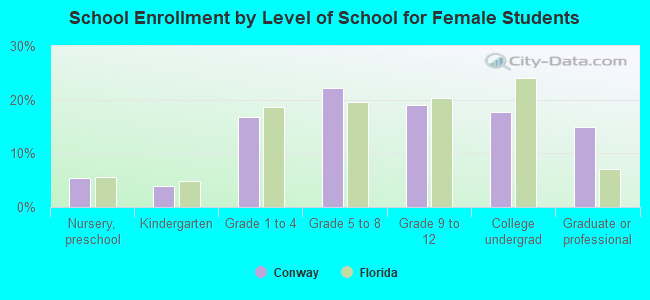
Private vs. public school enrollment:
| Here: | 12.7% |
| Florida: | 15.8% |
| Here: | 32.6% |
| Florida: | 12.9% |
| Here: | 12.6% |
| Florida: | 23.6% |