Crown Point, IN (Indiana) Houses and Residents
Estimated median house or condo value in 2022: $289,493 (it was $124,300 in 2000 )
Crown Point:
$289,493Indiana:
$208,700
Lower value quartile - upper value quartile: $225,644 - $399,599Mean price in 2022: Detached houses: $334,008 Here:
$334,008State:
$257,916
Townhouses or other attached units: $223,877 Here:
$223,877State:
$224,114
In 2-unit structures: $171,165 Here:
$171,165State:
$175,375
In 3-to-4-unit structures: $280,138 Here:
$280,138State:
$151,116
In 5-or-more-unit structures: $114,378 Here:
$114,378State:
$200,844
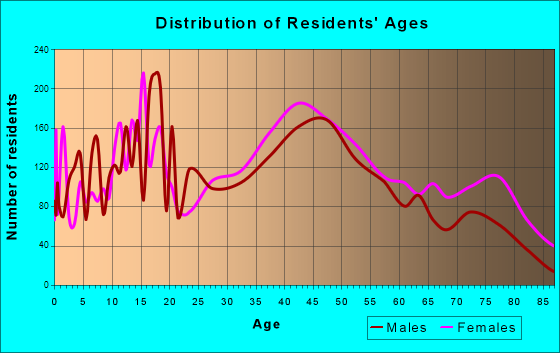
Total population: 28,623 (Urban population: 18,886, Rural population: 681 (37 farm, 644 nonfarm ))
Houses: 12,631 (12,254 occupied: 10,560 owner occupied, 1,705 renter occupied )
% of renters here:
14%State:
29%
Housing density: 760 houses/condos per square mile
Median price asked for vacant for-sale houses and condos in 2022: $198,120.
Median contract rent in 2022: $1,076 (lower quartile is $916, upper quartile is $1,390)
Median rent asked for vacant for-rent units in 2022: $1,241
Median gross rent in Crown Point, IN in 2022: $1,239
Housing units in Crown Point with a mortgage: 7,050 (650 second mortgage, 11 home equity loan, 544 both second mortgage and home equity loan )Houses without a mortgage: 190
Median household income for houses/condos with a mortgage: $105,156
Median household income for apartments without a mortgage: $68,329
Median monthly housing costs: $1,303
Data:
Median house or condo value ($)
Median house or condo value ($ change since 2000)
Median house or condo value ($) - White
Median house or condo value ($) - Black or African American
Median house or condo value ($) - Asian
Median house or condo value ($) - Hispanic or Latino
Median house or condo value ($) - American Indian and Alaska Native
Median house or condo value ($) - Multirace
Median house or condo value ($) - Other Race
Median price asked for mobile homes ($)
Household density (households per square mile)
Mean house or condo value by units in structure - 1, detached ($)
Mean house or condo value by units in structure - 1, attached ($)
Mean house or condo value by units in structure - 2 ($)
Mean house or condo value by units in structure by units in structure - 3 or 4 ($)
Mean house or condo value by units in structure - 5 or more ($)
Mean house or condo value by units in structure - Boat, RV, van, etc. ($)
Mean house or condo value by units in structure - Mobile home ($)
Median contract rent ($)
Median contract rent - Lower quartile ($)
Median contract rent - Upper quartile ($)
Median gross rent ($)
Urban houses (%)
Rural houses (%)
Houses occupied (%)
Houses occupied (% change since 2000)
Houses owner occupied (%)
Houses owner occupied (% change since 2000)
Houses renter occupied (%)
Houses renter occupied (% change since 2000)
Vacant housing units - For rent (%)
Vacant housing units - For rent (% change since 2000)
Vacant housing units - For sale only (%)
Vacant housing units - For sale only (% change since 2000)
Vacant housing units - Rented or sold, not occupied (%)
Vacant housing units - Rented or sold, not occupied (% change since 2000)
Vacant housing units - For seasonal, recreational, or occasional use (%)
Vacant housing units - For seasonal, recreational, or occasional use (% change since 2000)
Vacant housing units - For migrant workers (%)
Vacant housing units - For migrant workers (% change since 2000)
Vacant housing units - Other vacant (%)
Vacant housing units - Other vacant (% change since 2000)
Median monthly housing costs ($)
Median household income for houses/condos with a mortgage ($)
Median household income for houses/condos without a mortgage ($)
Median household income ($)
Median household income ($) - White
Median household income ($) - Black or African American
Median household income ($) - Asian
Median household income ($) - Hispanic or Latino
Median household income ($) - American Indian and Alaska Native
Median household income ($) - Multirace
Median household income ($) - Other Race
Mortgage status - with mortgage (%)
Mortgage status - with second mortgage (%)
Mortgage status - with home equity loan (%)
Mortgage status - with both second mortgage and home equity loan (%)
Mortgage status - without a mortgage (%)
Median year house/condo built
Median year apartment built
Household type by relationship - Male householder living alone (%)
Household type by relationship - Male householder not living alone (%)
Household type by relationship - Female householder living alone (%)
Household type by relationship - Female householder not living alone (%)
Household type by relationship - Opposite-Sex spouse (%)
Household type by relationship - Same-Sex spouse (%)
Household type by relationship - Opposite-Sex unmarried partner (%)
Household type by relationship - Same-Sex unmarried partner (%)
Household type by relationship - In group quarters (%)
Size of family households - 2-person household (%)
Size of family households - 3-person household (%)
Size of family households - 4-person household (%)
Size of family households - 5-person household (%)
Size of family households - 6-person household (%)
Size of family households - 7-or-more-person household (%)
Size of nonfamily households - 1-person household (%)
Size of nonfamily households - 2-person household (%)
Size of nonfamily households - 3-person household (%)
Size of nonfamily households - 4-person household (%)
Size of nonfamily households - 5-person household (%)
Size of nonfamily households - 6-person household (%)
Size of nonfamily households - 7-or-moreperson household (%)
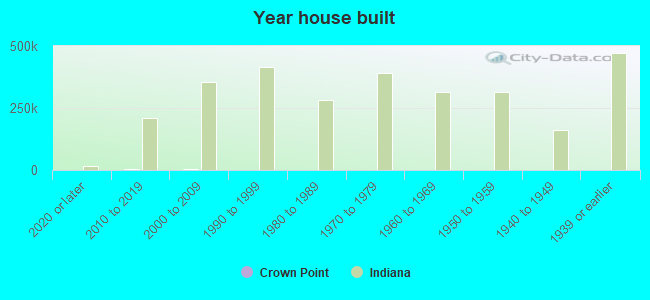
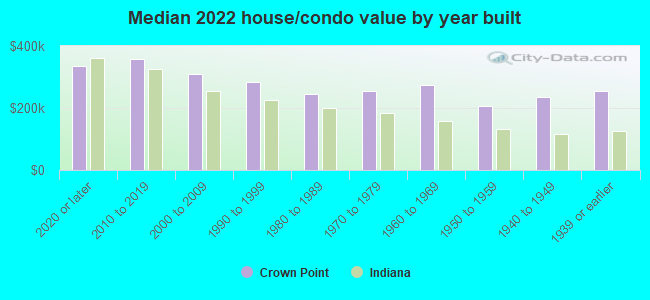
Year house built - Built 2010 or later (%)
Year house built - Built 2000 to 2009 (%)
Year house built - Built 1990 to 1999 (%)
Year house built - Built 1980 to 1989 (%)
Year house built - Built 1970 to 1979 (%)
Year house built - Built 1960 to 1969 (%)
Year house built - Built 1950 to 1959 (%)
Year house built - Built 1940 to 1949 (%)
Year house built - Built 1939 or earlier (%)
Median number of rooms in houses and condos
Median number of rooms in apartments
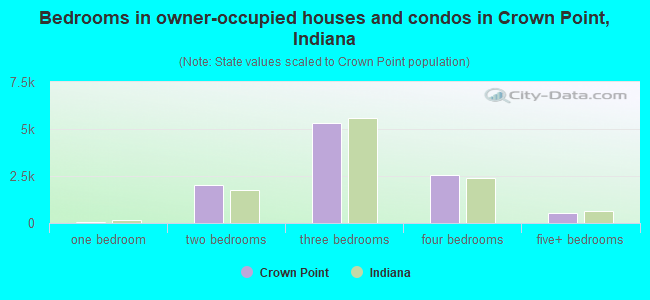
Median number of bedrooms in owner occupied houses
Mean number of bedrooms in owner occupied houses
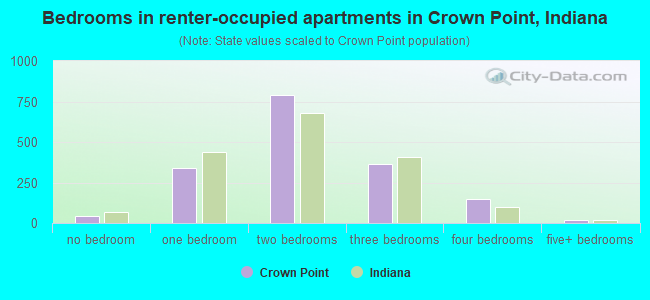
Median number of bedrooms in renter occupied houses
Mean number of bedrooms in renter occupied houses
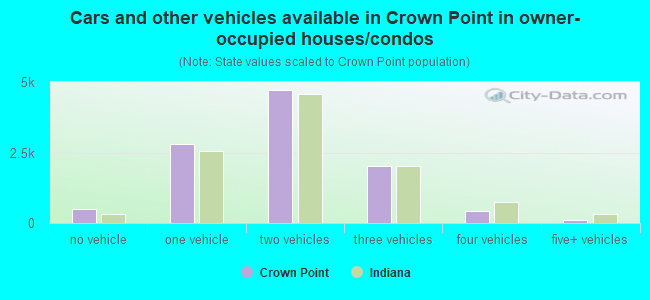
Median number of vehichles in owner occupied houses
Mean number of vehichles in owner occupied houses
Median number of vehichles in renter occupied houses
Mean number of vehichles in renter occupied houses
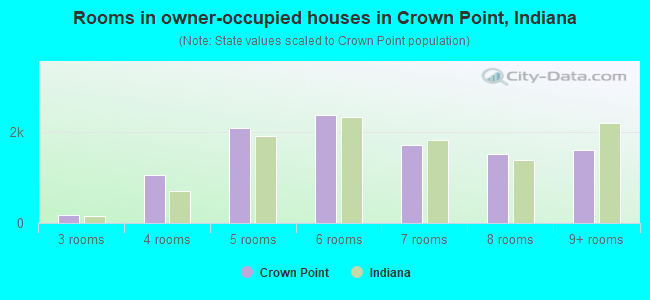
Rooms in owner-occupied houses - 1 room (%)
Rooms in owner-occupied houses - 2 rooms (%)
Rooms in owner-occupied houses - 3 rooms (%)
Rooms in owner-occupied houses - 4 rooms (%)
Rooms in owner-occupied houses - 5 rooms (%)
Rooms in owner-occupied houses - 6 rooms (%)
Rooms in owner-occupied houses - 7 rooms (%)
Rooms in owner-occupied houses - 8 rooms (%)
Rooms in owner-occupied houses - 9+ rooms (%)
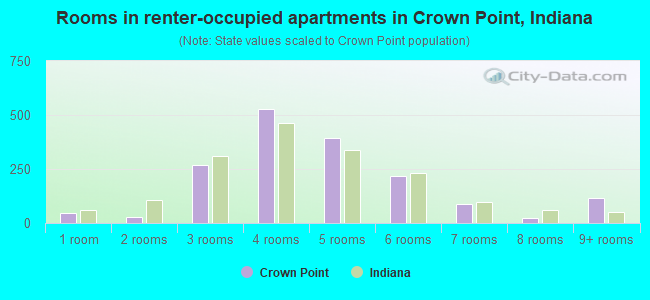
Rooms in renter-occupied houses - 1 room (%)
Rooms in renter-occupied houses - 2 rooms (%)
Rooms in renter-occupied houses - 3 rooms (%)
Rooms in renter-occupied houses - 4 rooms (%)
Rooms in renter-occupied houses - 5 rooms (%)
Rooms in renter-occupied houses - 6 rooms (%)
Rooms in renter-occupied houses - 7 rooms (%)
Rooms in renter-occupied houses - 8 rooms (%)
Rooms in renter-occupied houses - 9+ rooms (%)
Bedrooms in owner-occupied houses - no bedrooms (%)
Bedrooms in owner-occupied houses - 1 bedroom (%)
Bedrooms in owner-occupied houses - 2 bedrooms (%)
Bedrooms in owner-occupied houses - 3 bedrooms (%)
Bedrooms in owner-occupied houses - 4 bedrooms (%)
Bedrooms in owner-occupied houses - 5+ bedrooms (%)
Bedrooms in renter-occupied houses - no bedrooms (%)
Bedrooms in renter-occupied houses - 1 bedroom (%)
Bedrooms in renter-occupied houses - 2 bedrooms (%)
Bedrooms in renter-occupied houses - 3 bedrooms (%)
Bedrooms in renter-occupied houses - 4 bedrooms (%)
Bedrooms in renter-occupied houses - 5+ bedrooms (%)
Vehicles available in owner-occupied houses - no vehicle available (%)
Vehicles available in owner-occupied houses - 1 vehicle available(%)
Vehicles available in owner-occupied houses - 2 Vehicles available (%)
Vehicles available in owner-occupied houses - 3 Vehicles available (%)
Vehicles available in owner-occupied houses - 4 Vehicles available (%)
Vehicles available in owner-occupied houses - 5+ Vehicles available (%)
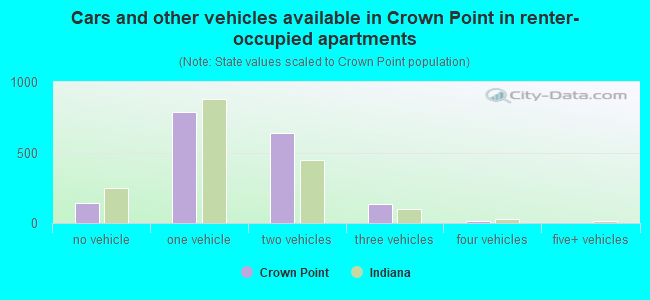
Vehicles available in renter-occupied houses - no vehicle available (%)
Vehicles available in renter-occupied houses - 1 vehicle available (%)
Vehicles available in renter-occupied houses - 2 Vehicles available (%)
Vehicles available in renter-occupied houses - 3 Vehicles available (%)
Vehicles available in renter-occupied houses - 4 Vehicles available (%)
Vehicles available in renter-occupied houses - 5+ Vehicles available (%)
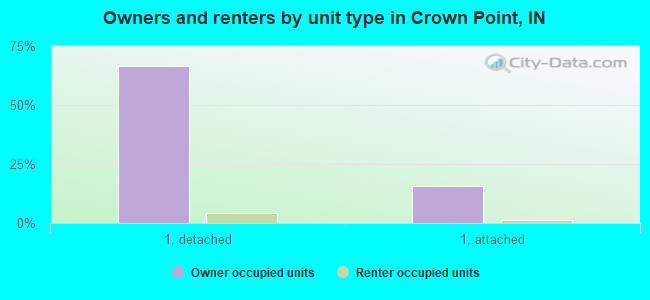
Housing units in structures - 1, detached (%)
Housing units in structures - 1, attached (%)
Housing units in structures - 2 (%)
Housing units in structures - 3 or 4 (%)
Housing units in structures - 5 to 9 (%)
Housing units in structures - 10 to 19 (%)
Housing units in structures - 20 to 49 (%)
Housing units in structures - 50 or more (%)
Housing units in structures - Mobile home (%)
Housing units in structures - Boat, RV, van, etc. (%)
Housing units in structures - Owners - 1, detached (%)
Housing units in structures - Owners - 1, attached (%)
Housing units in structures - Owners - 2 (%)
Housing units in structures - Owners - 3 or 4 (%)
Housing units in structures - Owners - 5 to 9 (%)
Housing units in structures - Owners - 10 to 19 (%)
Housing units in structures - Owners - 20 to 49 (%)
Housing units in structures - Owners - 50 or more (%)
Housing units in structures - Owners - Mobile home (%)
Housing units in structures - Owners - Boat, RV, van, etc. (%)
Housing units in structures - Renters - 1, detached (%)
Housing units in structures - Renters - 1, attached (%)
Housing units in structures - Renters - 2 (%)
Housing units in structures - Renters - 3 or 4 (%)
Housing units in structures - Renters - 5 to 9 (%)
Housing units in structures - Renters - 10 to 19 (%)
Housing units in structures - Renters - 20 to 49 (%)
Housing units in structures - Renters - 50 or more (%)
Housing units in structures - Renters - Mobile home (%)
Housing units in structures - Renters - Boat, RV, van, etc. (%)
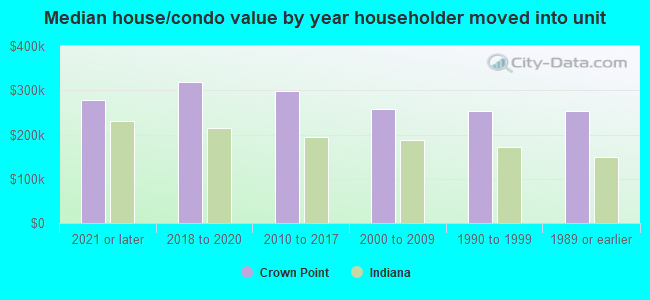
House/condo owner moved in on average (years ago)
Renter moved in on average (years ago)
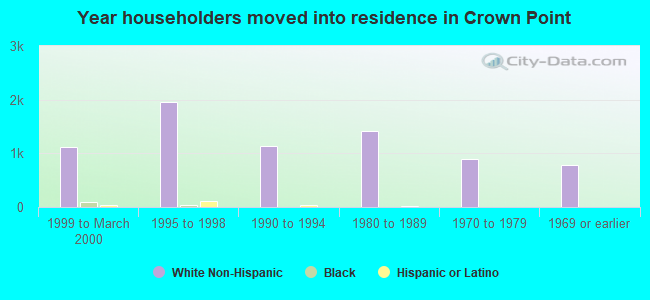
Year householder moved into unit - Moved in 1999 to March 2000 (%)
Year householder moved into unit - Moved in 1999 to March 2000 (%) - White
Year householder moved into unit - Moved in 1999 to March 2000 (%) - Black or African American
Year householder moved into unit - Moved in 1999 to March 2000 (%) - Asian
Year householder moved into unit - Moved in 1999 to March 2000 (%) - Hispanic or Latino
Year householder moved into unit - Moved in 1999 to March 2000 (%) - American Indian and Alaska Native
Year householder moved into unit - Moved in 1999 to March 2000 (%) - Multirace
Year householder moved into unit - Moved in 1999 to March 2000 (%) - Other Race
Year householder moved into unit - Moved in 1995 to 1998 (%)
Year householder moved into unit - Moved in 1995 to 1998 (%) - White
Year householder moved into unit - Moved in 1995 to 1998 (%) - Black or African American
Year householder moved into unit - Moved in 1995 to 1998 (%) - Asian
Year householder moved into unit - Moved in 1995 to 1998 (%) - Hispanic or Latino
Year householder moved into unit - Moved in 1995 to 1998 (%) - American Indian and Alaska Native
Year householder moved into unit - Moved in 1995 to 1998 (%) - Multirace
Year householder moved into unit - Moved in 1995 to 1998 (%) - Other Race
Year householder moved into unit - Moved in 1990 to 1994 (%)
Year householder moved into unit - Moved in 1990 to 1994 (%) - White
Year householder moved into unit - Moved in 1990 to 1994 (%) - Black or African American
Year householder moved into unit - Moved in 1990 to 1994 (%) - Asian
Year householder moved into unit - Moved in 1990 to 1994 (%) - Hispanic or Latino
Year householder moved into unit - Moved in 1990 to 1994 (%) - American Indian and Alaska Native
Year householder moved into unit - Moved in 1990 to 1994 (%) - Multirace
Year householder moved into unit - Moved in 1990 to 1994 (%) - Other Race
Year householder moved into unit - Moved in 1980 to 1989 (%)
Year householder moved into unit - Moved in 1980 to 1989 (%) - White
Year householder moved into unit - Moved in 1980 to 1989 (%) - Black or African American
Year householder moved into unit - Moved in 1980 to 1989 (%) - Asian
Year householder moved into unit - Moved in 1980 to 1989 (%) - Hispanic or Latino
Year householder moved into unit - Moved in 1980 to 1989 (%) - American Indian and Alaska Native
Year householder moved into unit - Moved in 1980 to 1989 (%) - Multirace
Year householder moved into unit - Moved in 1980 to 1989 (%) - Other Race
Year householder moved into unit - Moved in 1970 to 1979 (%)
Year householder moved into unit - Moved in 1970 to 1979 (%) - White
Year householder moved into unit - Moved in 1970 to 1979 (%) - Black or African American
Year householder moved into unit - Moved in 1970 to 1979 (%) - Asian
Year householder moved into unit - Moved in 1970 to 1979 (%) - Hispanic or Latino
Year householder moved into unit - Moved in 1970 to 1979 (%) - American Indian and Alaska Native
Year householder moved into unit - Moved in 1970 to 1979 (%) - Multirace
Year householder moved into unit - Moved in 1970 to 1979 (%) - Other Race
Year householder moved into unit - Moved in 1969 or earlier (%)
Year householder moved into unit - Moved in 1969 or earlier (%) - White
Year householder moved into unit - Moved in 1969 or earlier (%) - Black or African American
Year householder moved into unit - Moved in 1969 or earlier (%) - Asian
Year householder moved into unit - Moved in 1969 or earlier (%) - Hispanic or Latino
Year householder moved into unit - Moved in 1969 or earlier (%) - American Indian and Alaska Native
Year householder moved into unit - Moved in 1969 or earlier (%) - Multirace
Year householder moved into unit - Moved in 1969 or earlier (%) - Other Race
Housing units lacking complete plumbing facilities (%)
Housing units lacking complete kitchen facilities (%)
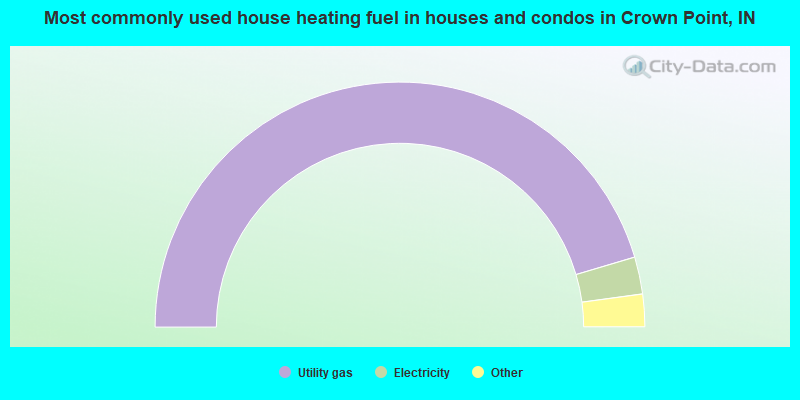
House heating fuel used in houses and condos - Utility gas (%)
House heating fuel used in houses and condos - Bottled, tank, or LP gas (%)
House heating fuel used in houses and condos - Electricity (%)
House heating fuel used in houses and condos - Fuel oil, kerosene, etc. (%)
House heating fuel used in houses and condos - Coal or coke (%)
House heating fuel used in houses and condos - Wood (%)
House heating fuel used in houses and condos - Solar energy (%)
House heating fuel used in houses and condos - Other fuel (%)
House heating fuel used in houses and condos - No fuel used (%)
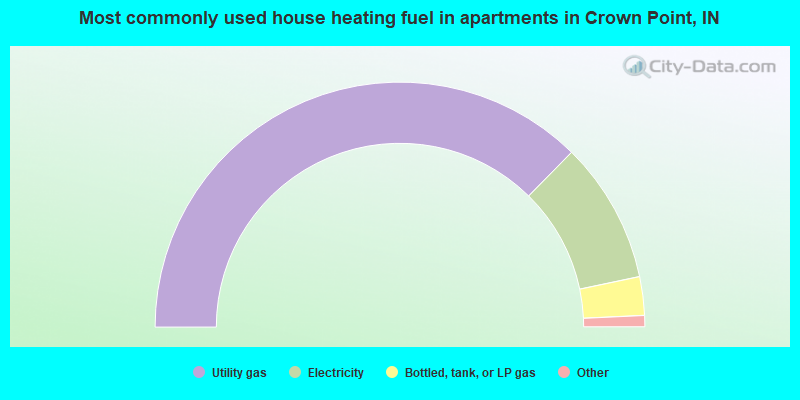
House heating fuel used in apartments - Utility gas (%)
House heating fuel used in apartments - Bottled, tank, or LP gas (%)
House heating fuel used in apartments - Electricity (%)
House heating fuel used in apartments - Fuel oil, kerosene, etc. (%)
House heating fuel used in apartments - Coal or coke (%)
House heating fuel used in apartments - Wood (%)
House heating fuel used in apartments - Solar energy (%)
House heating fuel used in apartments - Other fuel (%)
House heating fuel used in apartments - No fuel used (%)
Median year house/condo built: 1996Median year apartment built: 1972Household type by relationship:
Households: 33,871
Male householders: 6,301 (1,013 living alone ), Female householders: 5,866 (1,788 living alone )6,942 spouses (6,871 opposite-sex spouses ), 665 unmarried partners , (642 opposite-sex unmarried partners ), 10,404 children (9,458 natural , 384 adopted , 561 stepchildren ), 363 grandchildren , 347 brothers or sisters , 595 parents , 0 foster children , 261 other relatives , 707 non-relatives In group quarters: 1,414
Size of family households: 3,701 2-persons , 1,788 3-persons , 2,089 4-persons , 875 5-persons , 231 6-persons , 59 7-or-more-persons .
Size of nonfamily households: 2,870 1-person , 534 2-persons , 13 3-persons , 10 4-persons .
6,363 married couples with children. single-parent households (665 men , 823 women ).
86.6% of residents of Crown Point speak English at home. of residents speak Spanish at home (67% speak English very well , 21% speak English well , 9% speak English not well , 3% don't speak English at all ).of residents speak other Indo-European language at home (78% speak English very well , 18% speak English well , 4% speak English not well ).of residents speak Asian or Pacific Island language at home (77% speak English very well , 6% speak English well , 17% speak English not well ).of residents speak other language at home (76% speak English very well , 11% speak English well , 12% speak English not well ).
Foreign born population: 2,222 (6.6%)of them are naturalized citizens )
Median number of rooms in houses and condos:
Median number of rooms in apartments
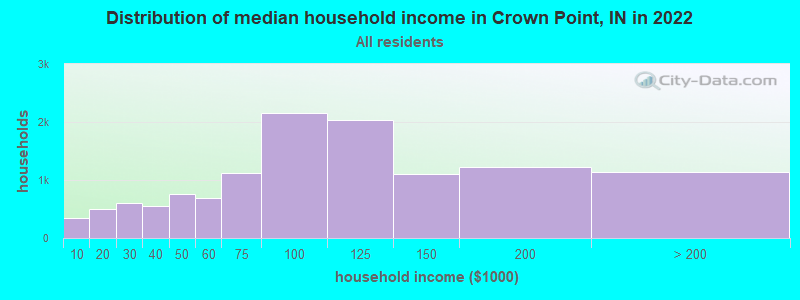
Crown Point, IN household income distribution 340 Less than $10,000508 $10,000 to $19,999601 $20,000 to $29,999552 $30,000 to $39,999757 $40,000 to $49,999694 $50,000 to $59,9991,128 $60,000 to $74,9992,157 $75,000 to $99,9992,042 $100,000 to $124,9991,103 $125,000 to $149,9991,226 $150,000 to $199,9991,135 $200,000 or more
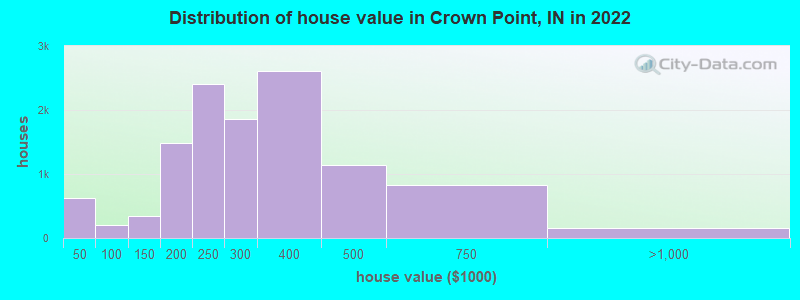
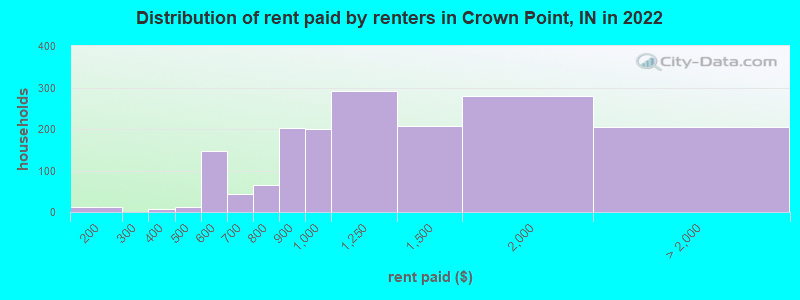
Home value of owner - occupied houses in 2022 in Crown Point, IN 421 Less than $10,000126 $15,000 to $19,99930 $20,000 to $24,99916 $25,000 to $29,9998 $35,000 to $39,99916 $40,000 to $49,9997 $50,000 to $59,99941 $60,000 to $69,99952 $70,000 to $79,99943 $80,000 to $89,99939 $90,000 to $99,999171 $100,000 to $124,999178 $125,000 to $149,999500 $150,000 to $174,999981 $175,000 to $199,9992,407 $200,000 to $249,9991,861 $250,000 to $299,9992,605 $300,000 to $399,9991,140 $400,000 to $499,999827 $500,000 to $749,999134 $750,000 to $999,9994 $1,500,000 to $1,999,99918 $2,000,000 or moreRent paid by renters in 2022 in Crown Point, IN 12 $150 to $1997 $350 to $39911 $400 to $44963 $500 to $54982 $550 to $59942 $650 to $69965 $700 to $749201 $800 to $899199 $900 to $999291 $1,000 to $1,249208 $1,250 to $1,499278 $1,500 to $1,99965 $2,000 to $2,499138 No cash rent
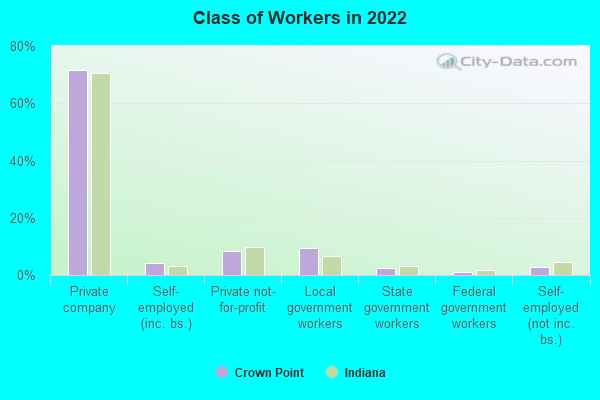
Percentage of workers working in this county: 80.8%Number of people working at home: 1,950 (12.6% of all workers )
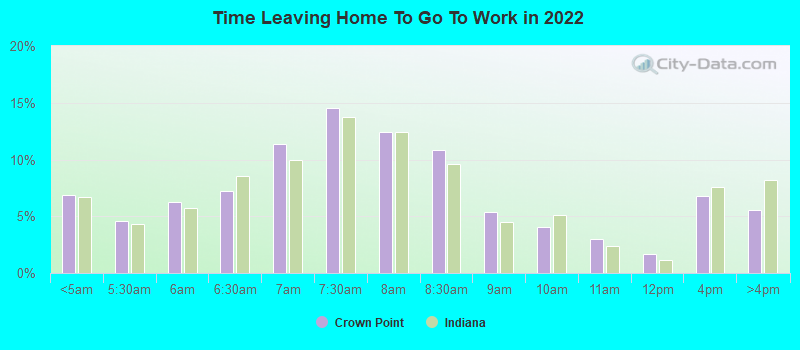
Travel time to work (commute)
Less than 5 minutes: 4855 to 9 minutes: 1,84210 to 14 minutes: 1,82715 to 19 minutes: 1,67320 to 24 minutes: 1,07125 to 29 minutes: 1,19830 to 34 minutes: 1,59335 to 39 minutes: 44040 to 44 minutes: 88245 to 59 minutes: 1,35360 to 89 minutes: 92690 or more minutes: 321
Means of transportation to work:
Drove a car alone: 14,229 (77.7%)Carpooled: 1,681 (9.2%)Bus : 1 (0.0%)Taxi: 324 (1.8%)Walked: 135 (0.7%)Worked at home: 1,950 (10.6%)
Unemployment by race in 2022
Unemployment rate for White non-Hispanic residents 2.2% Males2.1% FemalesUnemployment rate for Black residents 3.9% Males1.0% FemalesUnemployment rate for Asian residents 23.5% MalesUnemployment rate for other race residents 16.2% MalesUnemployment rate for two or more race residents 5.2% MalesUnemployment rate for Hispanic or Latino residents 6.3% Males13.4% Females
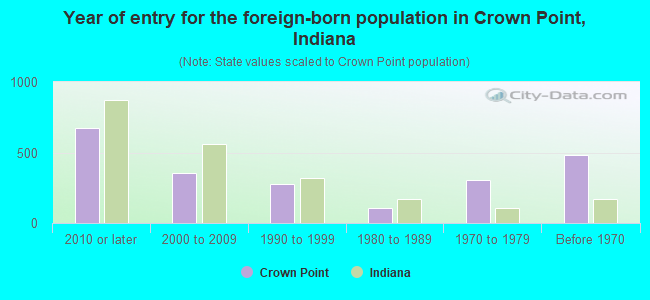
Year of entry for the foreign-born population in Crown Point, Indiana
676 2010 or later 355 2000 to 2009 275 1990 to 1999 105 1980 to 1989 304 1970 to 1979 482 Before 1970
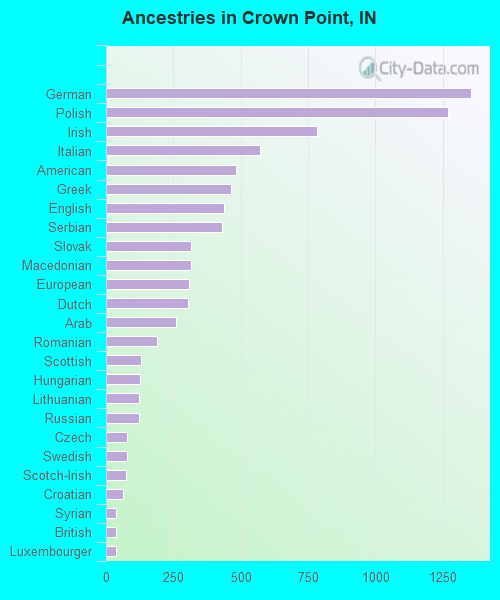
First ancestries reported:
German: 1,354 (9.4%)
Polish: 1,270 (8.8%)
Irish: 783 (5.4%)
Italian: 570 (4.0%)
American: 481 (3.3%)
Greek: 464 (3.2%)
English: 437 (3.0%)
Serbian: 431 (3.0%)
Slovak: 317 (2.2%)
Macedonian: 314 (2.2%)
European: 308 (2.1%)
Dutch: 306 (2.1%)
Arab: 258 (1.8%)
Romanian: 189 (1.3%)
Scottish: 129 (0.9%)
Hungarian: 125 (0.9%)
Lithuanian: 123 (0.9%)
Russian: 122 (0.8%)
Czech: 78 (0.5%)
Swedish: 77 (0.5%)
Scotch-Irish: 73 (0.5%)
Croatian: 62 (0.4%)
Syrian: 38 (0.3%)
British: 36 (0.2%)
Luxembourger: 36 (0.2%)
Norwegian: 30 (0.2%)
French: 27 (0.2%)
Nigerian: 27 (0.2%)
Ukrainian: 27 (0.2%)
French Canadian: 26 (0.2%)
Welsh: 26 (0.2%)
Northern European: 25 (0.2%)
Finnish: 19 (0.1%)
Egyptian: 12 (0.08%)
Eastern European: 12 (0.08%)
Scandinavian: 11 (0.08%)
Palestinian: 9 (0.06%) Most common places of birth for foreign-born residents (%): Mexico Crown Point:
15.7% (360)Indiana:
27.0% (101,996)
North Macedonia (Macedonia) Crown Point:
11.9% (273)Indiana:
0.3% (1,056)
Germany Crown Point:
5.1% (116)Indiana:
1.7% (6,439)
Philippines Crown Point:
4.3% (98)Indiana:
3.1% (11,851)
Other Northern Africa Crown Point:
4.2% (97)Indiana:
0.1% (239)
Czechoslovakia (includes Czech Republic and Slovakia) Crown Point:
3.5% (80)Indiana:
0.1% (274)
Canada Crown Point:
3.0% (68)Indiana:
2.1% (7,834)
Pakistan Crown Point:
2.8% (65)Indiana:
0.9% (3,221)
Greece Crown Point:
2.8% (64)Indiana:
0.3% (1,317)
Croatia Crown Point:
2.7% (61)Indiana:
0.3% (968)
Europe, n.e.c. Crown Point:
2.5% (58)Indiana:
0.0% (65)
Russia Crown Point:
2.4% (55)Indiana:
0.9% (3,307)
Spain Crown Point:
2.3% (53)Indiana:
0.4% (1,393)
Korea Crown Point:
2.1% (49)Indiana:
2.0% (7,653)
Egypt Crown Point:
2.1% (48)Indiana:
0.6% (2,303)
Bosnia and Herzegovina Crown Point:
2.0% (47)Indiana:
0.3% (1,277)
Serbia Crown Point:
1.7% (38)Indiana:
0.3% (978)
Poland Crown Point:
1.6% (36)Indiana:
0.8% (2,959)
Other Eastern Europe Crown Point:
1.5% (35)Indiana:
0.3% (1,096)
Place of birth for U.S.-born residents:
This state: 20,507Other state: 10,932Northeast: 917Midwest: 8,252South: 1,225West: 530 91.2% of Crown Point residents lived in the same house 1 years ago.
Out of people who lived in different houses, 41.7% lived in this county.
Out of people who lived in different counties, 18.8% lived in Indiana.
Crown Point:
91.2%State average:
87.1%
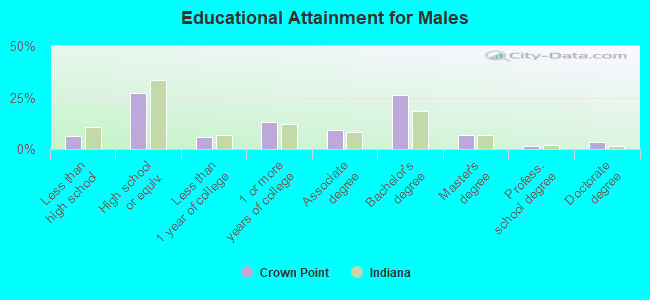
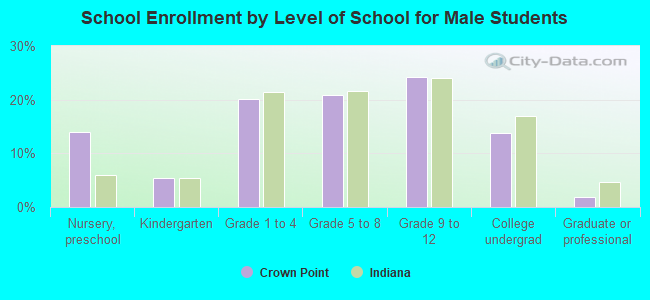
Education attainment for males 25 years and older:
No schooling: 107Nursery to 4th grade: 85th and 6th grade: 07th and 8th grade: 799th grade: 2310th grade: 11611th grade: 28212th grade, no diploma: 140High school graduate (or equivalency): 3,192Less than 1 year of college: 697Some college more than 1 year, no degree: 1,540Associate degree: 1,049Bachelor's degree: 3,043Master's degree: 820Professional school degree: 197Doctorate degree: 380
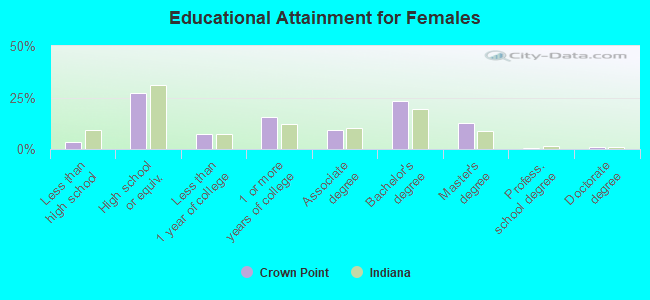
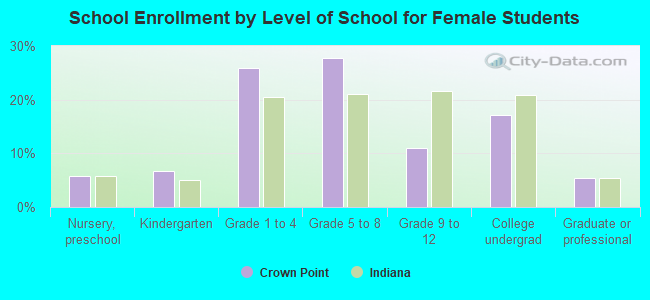
Education attainment for females 25 years and older:
No schooling: 93Nursery to 4th grade: 85th and 6th grade: 227th and 8th grade: 509th grade: 2910th grade: 6711th grade: 8712th grade, no diploma: 75High school graduate (or equivalency): 3,365Less than 1 year of college: 899Some college more than 1 year, no degree: 1,923Associate degree: 1,127Bachelor's degree: 2,847Master's degree: 1,542Professional school degree: 65Doctorate degree: 143
Housing units in structures:
One, detached: 8,871One, attached: 1,914Two: 2413 or 4: 2415 to 9: 38910 to 19: 23020 to 49: 25350 or more: 196Mobile homes: 292Median worth of mobile homes: $7,178
Housing units lacking complete plumbing facilities in 2022: 0.4%Housing units lacking complete kitchen facilities in 2022: 1.6%House/condo owner moved in on average 10 years ago
Renter moved in on average 1 years ago
Private vs. public school enrollment:
Students in private schools in grades 1 to 8 (elementary and middle school): 497 Students in private schools in grades 9 to 12 (high school): 44 Students in private undergraduate colleges: 119