Cumberland Plateau, TN (Tennessee) Houses and Residents
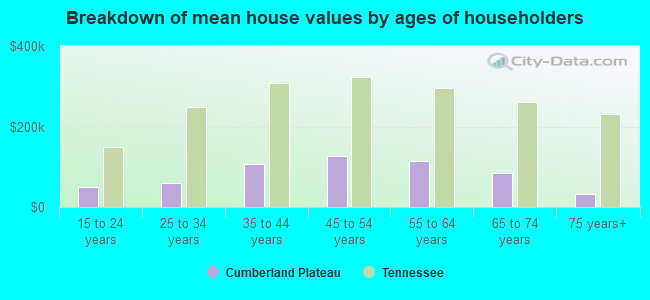
| Cumberland Plateau: | $174,091 |
| Tennessee: | $284,800 |
Total population: 4,307 (Urban population: 0, Rural population: 4,096 (165 farm, 3,931 nonfarm))
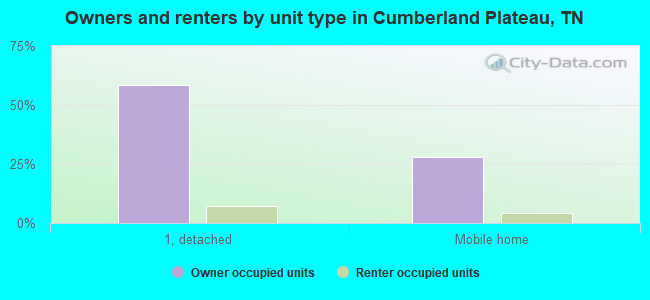
Houses: 1,303 (1,130 occupied: 993 owner occupied, 137 renter occupied)
| % of renters here: | 12% |
| State: | 33% |
Housing density: 8 houses/condos per square mile
Median price asked for vacant for-sale houses and condos in 2022 in this county: $225,665.
Median contract rent in 2022: $448 (lower quartile is $391, upper quartile is $608)
Median rent asked for vacant for-rent units in 2022: $551
Median gross rent in Cumberland Plateau, TN in 2022: $611
Housing units in Cumberland Plateau with a mortgage: 195 (17 second mortgage, 5 home equity loan, 0 both second mortgage and home equity loan)
Houses without a mortgage: 233


Household type by relationship:
Households: 11,775- In family households: 10,154 (2,530 male householders, 809 female householders)
2,641 spouses, 3,072 children (2,717 natural, 103 adopted, 252 stepchildren), 427 grandchildren, 95 brothers or sisters, 82 parents, foster children, 139 other relatives, 278 non-relatives
- In nonfamily households: 1,621 (689 male householders (537 living alone)), 669 female householders (591 living alone)), 263 nonrelatives
- In group quarters: 1,101 (1,091 institutionalized population)
1,908 married couples with children.
528 single-parent households (180 men, 348 women).
98.0% of residents of Cumberland Plateau speak English at home.
1.2% of residents speak Spanish at home (85% speak English very well, 15% speak English well).
0.5% of residents speak other Indo-European language at home (100% speak English very well).
0.3% of residents speak other language at home (60% speak English well, 40% speak English not well).
Foreign born population: 8 (0.2%)
(0.0% of them are naturalized citizens)
| Here: | 6.3 |
| State: | 6.5 |
| Here: | 4.9 |
| State: | 4.4 |
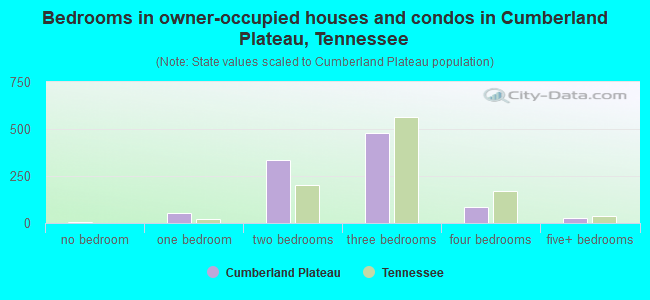
- Bedrooms in owner-occupied houses and condos in Cumberland Plateau, Tennessee
- 6no bedroom
- 551 bedroom
- 3372 bedrooms
- 4803 bedrooms
- 874 bedrooms
- 285+ bedrooms
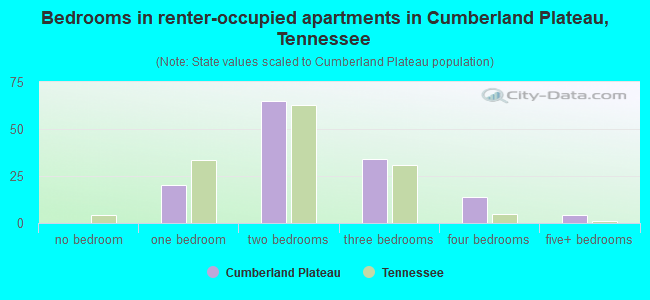
- Bedrooms in renter-occupied apartments in Cumberland Plateau, Tennessee
- 0no bedroom
- 201 bedroom
- 652 bedrooms
- 343 bedrooms
- 144 bedrooms
- 45+ bedrooms
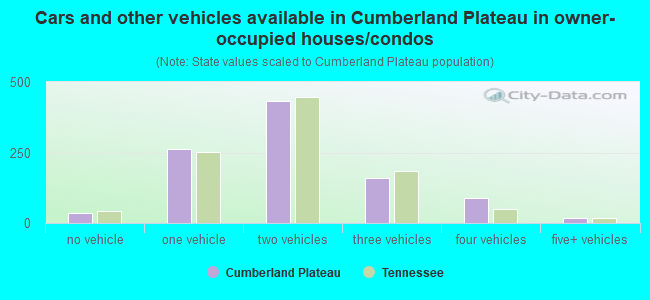
- Cars and other vehicles available in Cumberland Plateau in owner-occupied houses/condos
- 34no vehicle
- 2631 vehicle
- 4322 vehicles
- 1583 vehicles
- 874 vehicles
- 195+ vehicles
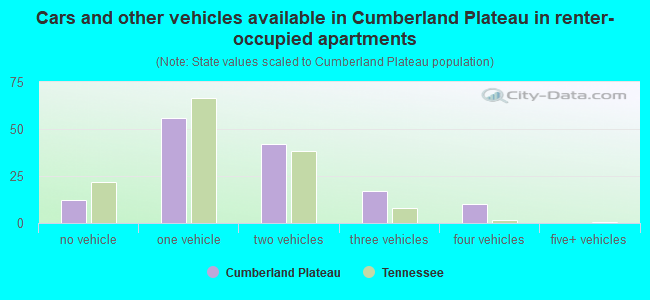
- Cars and other vehicles available in Cumberland Plateau in renter-occupied apartments
- 12no vehicle
- 561 vehicle
- 422 vehicles
- 173 vehicles
- 104 vehicles
- 05+ vehicles
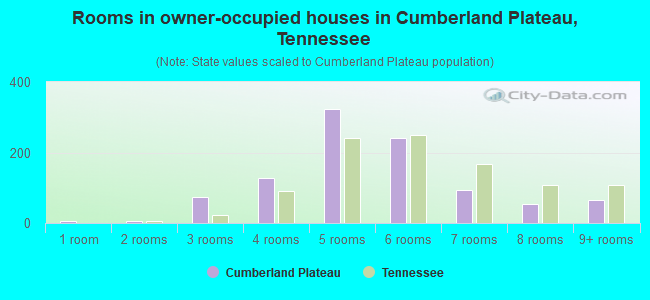
- Rooms in owner-occupied houses in Cumberland Plateau, Tennessee
- 61 room
- 62 rooms
- 743 rooms
- 1294 rooms
- 3225 rooms
- 2426 rooms
- 947 rooms
- 548 rooms
- 669+ rooms
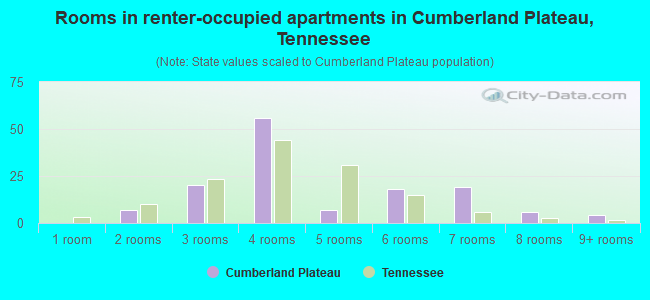
- Rooms in renter-occupied apartments in Cumberland Plateau, Tennessee
- 01 room
- 72 rooms
- 203 rooms
- 564 rooms
- 75 rooms
- 186 rooms
- 197 rooms
- 68 rooms
- 49+ rooms
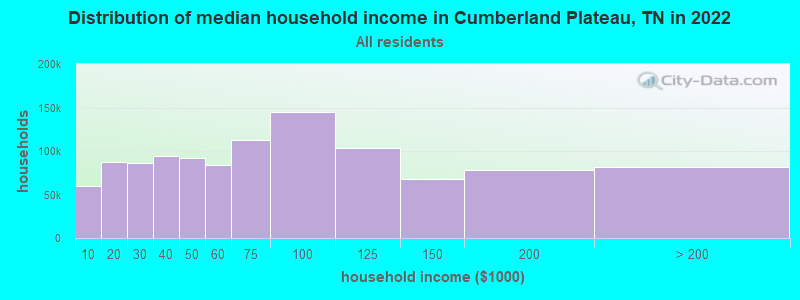
Cumberland Plateau, TN household income distribution

- 39,274Less than $10,000
- 65,874$10,000 to $19,999
- 62,473$20,000 to $29,999
- 63,875$30,000 to $39,999
- 61,760$40,000 to $49,999
- 57,163$50,000 to $59,999
- 77,936$60,000 to $74,999
- 99,339$75,000 to $99,999
- 74,294$100,000 to $124,999
- 44,253$125,000 to $149,999
- 48,572$150,000 to $199,999
- 41,061$200,000 or more
Percentage of workers working in this county: 56.7%
Number of people working at home: 138 (9.8% of all workers)
Travel time to work (commute)
- Less than 5 minutes: 27
- 5 to 9 minutes: 35
- 10 to 14 minutes: 108
- 15 to 19 minutes: 175
- 20 to 24 minutes: 182
- 25 to 29 minutes: 84
- 30 to 34 minutes: 153
- 35 to 39 minutes: 65
- 40 to 44 minutes: 50
- 45 to 59 minutes: 127
- 60 to 89 minutes: 153
- 90 or more minutes: 55
Means of transportation to work:
- Drove a car alone: 977 (77.3%)
- Carpooled: 216 (17.1%)
- Walked: 10 (0.8%)
- Other means: 11 (0.9%)
- Worked at home: 50 (4.0%)
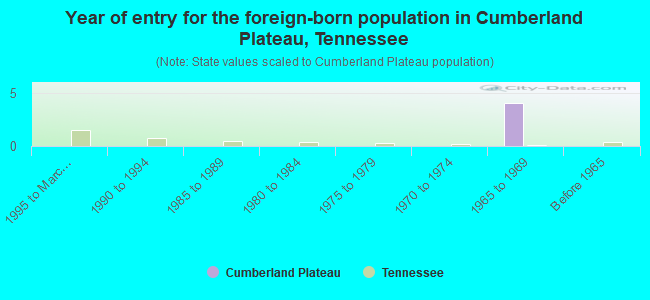
- Year of entry for the foreign-born population in Cumberland Plateau, Tennessee
- 01995 to March 2000
- 01990 to 1994
- 01985 to 1989
- 01980 to 1984
- 01975 to 1979
- 01970 to 1974
- 41965 to 1969
- 0Before 1965
Most common places of birth for foreign-born residents (%):
| Cumberland Plateau: | 100.0% (4) |
| Tennessee: | 0.8% (1,196) |
Place of birth for U.S.-born residents:
- This state: 2,901
- Other state: 1,183
- Northeast: 90
- Midwest: 298
- South: 649
- West: 146
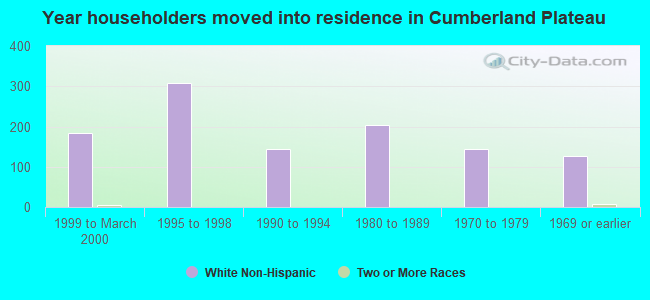
53% of Cumberland Plateau residents lived in the same house 5 years ago.
Out of people who lived in different houses, 26% lived in this county.
Out of people who lived in different counties, 79% lived in Tennessee.
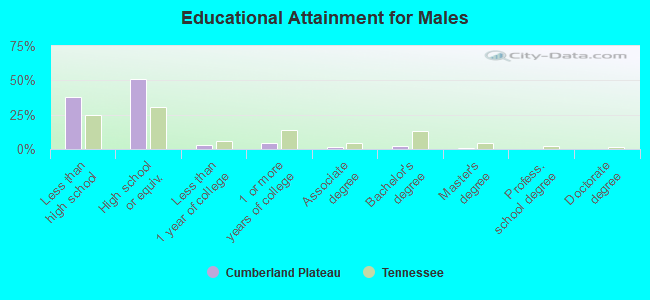
Education attainment for males 25 years and older:
- No schooling: 39
- Nursery to 4th grade: 21
- 5th and 6th grade: 36
- 7th and 8th grade: 212
- 9th grade: 90
- 10th grade: 147
- 11th grade: 141
- 12th grade, no diploma: 27
- High school graduate (or equivalency): 955
- Less than 1 year of college: 55
- Some college more than 1 year, no degree: 76
- Associate degree: 30
- Bachelor's degree: 42
- Master's degree: 16
- Professional school degree: 0
- Doctorate degree: 0
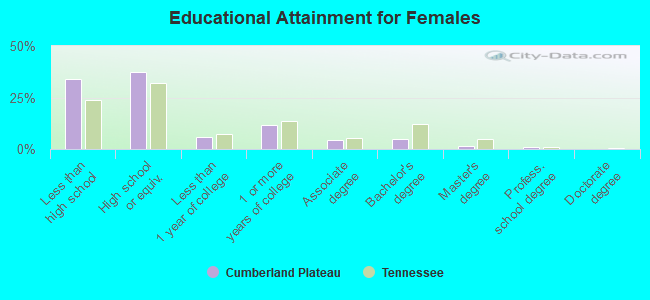
Education attainment for females 25 years and older:
- No schooling: 0
- Nursery to 4th grade: 0
- 5th and 6th grade: 31
- 7th and 8th grade: 142
- 9th grade: 62
- 10th grade: 39
- 11th grade: 35
- 12th grade, no diploma: 22
- High school graduate (or equivalency): 361
- Less than 1 year of college: 55
- Some college more than 1 year, no degree: 115
- Associate degree: 43
- Bachelor's degree: 46
- Master's degree: 12
- Professional school degree: 9
- Doctorate degree: 0


Housing units in structures:
- One, detached: 856
- 5 to 9: 4
- Mobile homes: 425
- Boats, RVs, vans, etc.: 18
Median worth of mobile homes: $69,243
Housing units lacking complete kitchen facilities: 3.1%
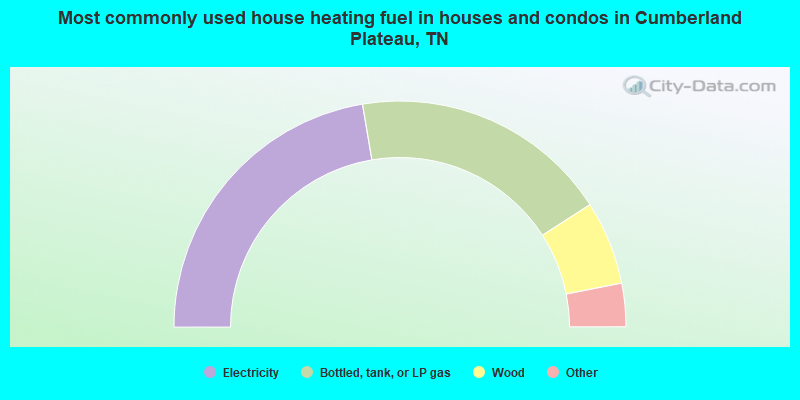
- 44.7%Electricity
- 37.1%Bottled, tank, or LP gas
- 12.0%Wood
- 3.5%Fuel oil, kerosene, etc.
- 2.1%Utility gas
- 0.6%No fuel used
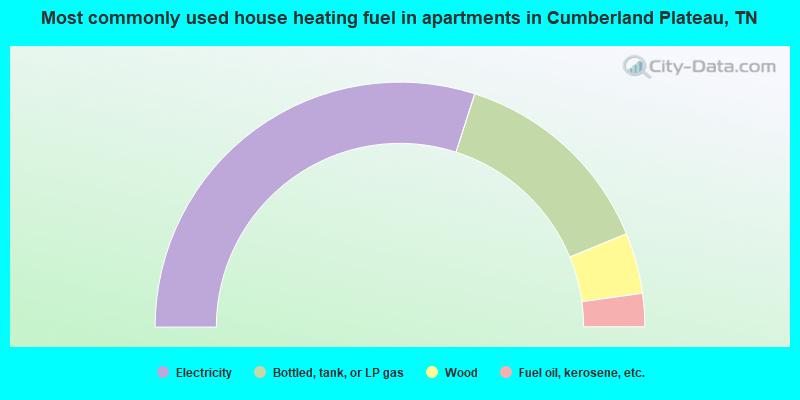
- 59.9%Electricity
- 27.7%Bottled, tank, or LP gas
- 8.0%Wood
- 4.4%Fuel oil, kerosene, etc.
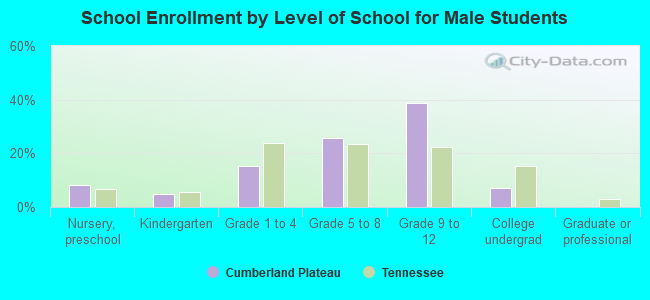
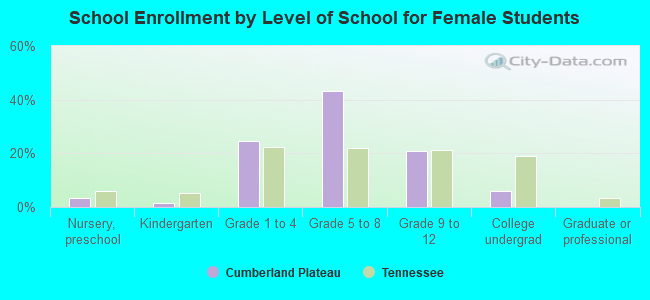
Private vs. public school enrollment:
| Here: | 14.4% |
| Tennessee: | 9.5% |
| Here: | 14.6% |
| Tennessee: | 10.4% |
| Here: | 25.9% |
| Tennessee: | 22.8% |