Dale, IN (Indiana) Houses and Residents
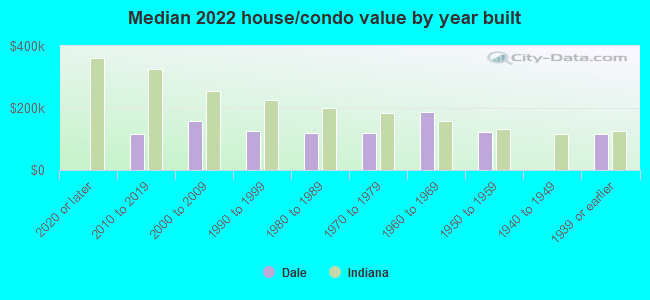
| Dale: | $129,358 |
| Indiana: | $208,700 |
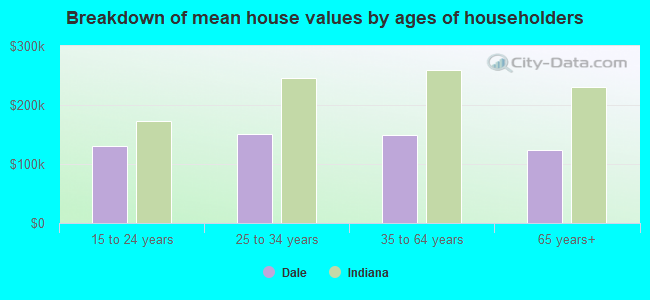
Mean price in 2022:
Detached houses: $162,467
Here: $162,467 State: $257,916 Mobile homes: $24,247
Here: $24,247 State: $67,116
Total population: 1,556 (Urban population: 0, Rural population: 1,574 (all nonfarm))
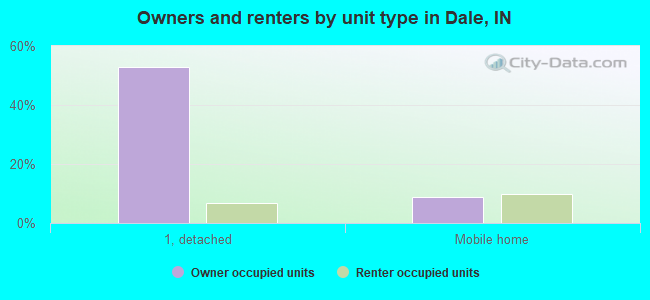
Houses: 568 (506 occupied: 343 owner occupied, 169 renter occupied)
| % of renters here: | 33% |
| State: | 29% |
Housing density: 371 houses/condos per square mile
Median price asked for vacant for-sale houses and condos in 2022 in this county: $119,168.
Median contract rent in 2022: $565 (lower quartile is $369, upper quartile is $619)
Median rent asked for vacant for-rent units in 2022: $634
Median gross rent in Dale, IN in 2022: $767
Housing units in Dale with a mortgage: 171 (18 second mortgage, 2 home equity loan, 9 both second mortgage and home equity loan)
Houses without a mortgage: 8
Median household income for houses/condos with a mortgage: $85,103
Median household income for apartments without a mortgage: $52,138
Median monthly housing costs: $797
Compare current foreclosures near Dale, IN:
| Photo | Address | Area | Beds / Baths | Price | Details |
|---|---|---|---|---|---|

|
#1
S Gaines St
Dale, IN 47523
|
1,620 sq. feet
|
2 baths 3 beds |
show details | |

|
#2
N County Road 700 E
Dale, IN 47523
|
- sq. feet
|
- baths - beds |
show details | |

|
#3
Yellowbanks Trl Lot 75n
Dale, IN 47523
|
- sq. feet
|
- baths - beds |
show details | |

|
#4
Ash St
Dale, IN 47523
|
- sq. feet
|
- baths - beds |
show details | |

|
#5
Rose Ln
Grandview, IN 47615
|
1,404 sq. feet
|
2 baths 3 beds |
show details | |

|
#6
Vine St
Jasper, IN 47546
|
1,274 sq. feet
|
1 baths 2 beds |
show details | |

|
#7
Meadowlane Dr
Lewisport, KY 42351
|
1,228 sq. feet
|
1 baths 3 beds |
show details | |

|
#8
Pell St
Lewisport, KY 42351
|
864 sq. feet
|
1 baths 3 beds |
show details | |

|
#9
Franklin St
Jasper, IN 47546
|
1,536 sq. feet
|
1 baths 4 beds |
show details | |

|
#10
Newton St
Jasper, IN 47546
|
1,920 sq. feet
|
1 baths 4 beds |
show details |
| Photo | Address | Area | Beds / Baths | Price | Details |
|---|---|---|---|---|---|

|
#11
S Potker St
Stendal, IN 47585
|
1,410 sq. feet
|
1 baths 2 beds |
show details | |

|
#12
W 10th St
Jasper, IN 47546
|
1,440 sq. feet
|
1 baths 2 beds |
show details | |

|
#13
River Rd
Lewisport, KY 42351
|
1,320 sq. feet
|
2 baths 4 beds |
show details | |

|
#14
W State Road 56
Jasper, IN 47546
|
1,716 sq. feet
|
2 baths 3 beds |
show details | |

|
#15
S Augusta Vigo St
Winslow, IN 47598
|
1,120 sq. feet
|
2 baths 2 beds |
show details | |

|
#16
N Truman Rd
Jasper, IN 47546
|
1,768 sq. feet
|
1 baths 3 beds |
show details | |

|
#17
Oakmount Ct
Jasper, IN 47546
|
1,092 sq. feet
|
1 baths 3 beds |
show details | |

|
#18
Candy Rd
Saint Meinrad, IN 47577
|
1,685 sq. feet
|
1 baths 2 beds |
show details | |

|
#19
S State Road 145
Birdseye, IN 47513
|
1,050 sq. feet
|
1 baths 1 beds |
show details | |

|
#20
E 2nd St
Lynnville, IN 47619
|
896 sq. feet
|
1 baths 2 beds |
show details |
| Photo | Address | Area | Beds / Baths | Price | Details |
|---|---|---|---|---|---|

|
#21
E 1st Ave
Huntingburg, IN 47542
|
806 sq. feet
|
1 baths 2 beds |
show details | |

|
#22
N Sycamore St
Huntingburg, IN 47542
|
2,808 sq. feet
|
1 baths 4 beds |
show details | |

|
#23
S Balthazar Dr
Santa Claus, IN 47579
|
1,853 sq. feet
|
1 baths 3 beds |
show details | |

|
#24
E 7th St
Huntingburg, IN 47542
|
1,724 sq. feet
|
1 baths 2 beds |
show details | |

|
#25
Huffman Rd
Bristow, IN 47515
|
2,240 sq. feet
|
1 baths - beds |
show details | |

|
#26
Alcoa Rd
Tell City, IN 47586
|
- sq. feet
|
- baths - beds |
show details | |

|
#27
E Augusta Second St
Winslow, IN 47598
|
- sq. feet
|
- baths - beds |
show details | |

|
#28
E County Road 250 S
Velpen, IN 47590
|
- sq. feet
|
- baths - beds |
show details | |

|
#29
9th St
Grandview, IN 47615
|
- sq. feet
|
- baths - beds |
show details | |

|
#30
Macarthur St
Jasper, IN 47546
|
- sq. feet
|
- baths - beds |
show details |
| Photo | Address | Area | Beds / Baths | Price | Details |
|---|---|---|---|---|---|

|
#31
Main St # 201
Jasper, IN 47546
|
- sq. feet
|
- baths - beds |
show details | |

|
#32
E State Road 62
Saint Meinrad, IN 47577
|
- sq. feet
|
- baths - beds |
show details | |

|
#33
W Iowa St
Holland, IN 47541
|
- sq. feet
|
- baths - beds |
show details | |

|
#34
W State Road 56
Jasper, IN 47546
|
- sq. feet
|
- baths - beds |
show details | |

|
#35
Clay St
Huntingburg, IN 47542
|
- sq. feet
|
- baths - beds |
show details | |

|
#36
W 14th St Apt 3
Jasper, IN 47546
|
- sq. feet
|
- baths - beds |
show details | |

|
#37
W 1025 S
Holland, IN 47541
|
- sq. feet
|
- baths - beds |
show details | |

|
#38
W Prancer Dr N
Santa Claus, IN 47579
|
- sq. feet
|
- baths - beds |
show details | |

|
#39
E 16th St
Jasper, IN 47546
|
- sq. feet
|
- baths - beds |
show details | |

|
#40
Nancy Ave
Lewisport, KY 42351
|
- sq. feet
|
- baths - beds |
show details |
| Photo | Address | Area | Beds / Baths | Price | Details |
|---|---|---|---|---|---|

|
#41
Park Dr N
Gentryville, IN 47537
|
- sq. feet
|
- baths - beds |
show details | |

|
#42
Circassian St
Gentryville, IN 47537
|
- sq. feet
|
- baths - beds |
show details | |

|
#43
5th St
Lewisport, KY 42351
|
- sq. feet
|
- baths - beds |
show details | |

|
#44
2nd Ave
Jasper, IN 47546
|
- sq. feet
|
- baths - beds |
show details | |

|
#45
S Main St
Tennyson, IN 47637
|
- sq. feet
|
- baths - beds |
show details | |

|
#46
Washington St # 8
Troy, IN 47588
|
- sq. feet
|
- baths - beds |
show details | |

|
#47
N State Road 545
Saint Meinrad, IN 47577
|
- sq. feet
|
- baths - beds |
show details | |

|
#48
Pleasant View Dr Apt 74
Huntingburg, IN 47542
|
- sq. feet
|
- baths - beds |
show details | |

|
#49
E 19th St Apt 8
Huntingburg, IN 47542
|
- sq. feet
|
- baths - beds |
show details | |

|
Check over 1 million property listings on Foreclosure.com!
|
browse all offers | |||

Latest news about housing in Dale, IN collected exclusively by city-data.com from local newspapers, TV, and radio stations

 | Comparing Indianapolis and Tampa (FL) (56 replies) |
| Salem, Indiana (13 replies) |
| Indianapolis more like Minneapolis or Louisville (362 replies) |
| Muncie Stereotypes (6 replies) |
| Dune Acres (9 replies) |
| Movies about Indiana.....name them (32 replies) |
Median year apartment built: 1985
Household type by relationship:
Households: 1,437- Male householders: 292 (74 living alone), Female householders: 210 (68 living alone)
281 spouses (281 opposite-sex spouses), 11 unmarried partners, (11 opposite-sex unmarried partners), 509 children (470 natural, 0 adopted, 39 stepchildren), 8 grandchildren, 18 brothers or sisters, 9 parents, 0 foster children, 31 other relatives, 0 non-relatives
- In group quarters: 66
Size of family households: 147 2-persons, 61 3-persons, 56 4-persons, 57 5-persons, 4 6-persons, 35 7-or-more-persons.
Size of nonfamily households: 146 1-person, 4 2-persons.
390 married couples with children.
68 single-parent households (10 men, 58 women).
80.3% of residents of Dale speak English at home.
19.5% of residents speak Spanish at home (53% speak English very well, 29% speak English well, 7% speak English not well, 10% don't speak English at all).
Foreign born population: 174 (12.1%)
(32.2% of them are naturalized citizens)
| Here: | 5.5 |
| State: | 6.6 |
| Here: | 3.9 |
| State: | 4.3 |
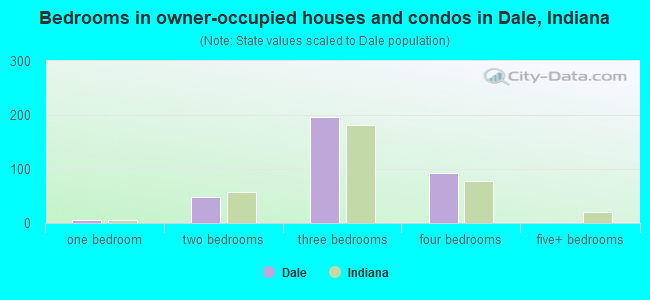
- Bedrooms in owner-occupied houses and condos in Dale, Indiana
- 0no bedroom
- 51 bedroom
- 492 bedrooms
- 1963 bedrooms
- 924 bedrooms
- 05+ bedrooms
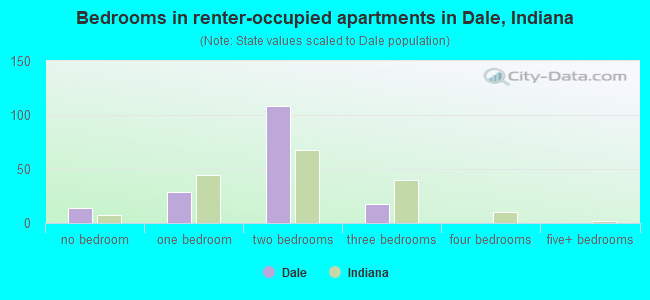
- Bedrooms in renter-occupied apartments in Dale, Indiana
- 14no bedroom
- 291 bedroom
- 1082 bedrooms
- 183 bedrooms
- 04 bedrooms
- 05+ bedrooms
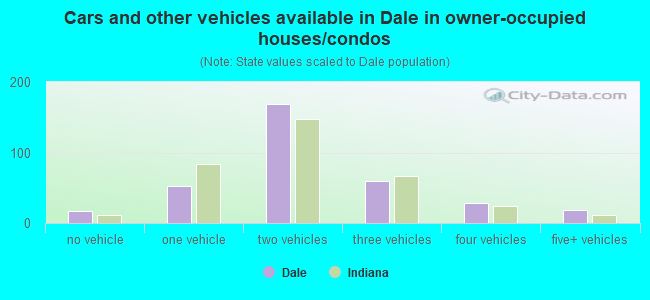
- Cars and other vehicles available in Dale in owner-occupied houses/condos
- 17no vehicle
- 521 vehicle
- 1692 vehicles
- 593 vehicles
- 284 vehicles
- 185+ vehicles
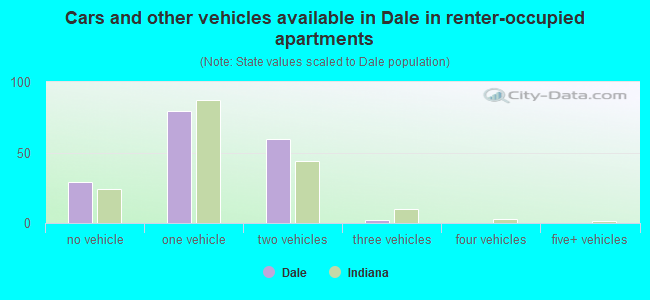
- Cars and other vehicles available in Dale in renter-occupied apartments
- 29no vehicle
- 791 vehicle
- 602 vehicles
- 23 vehicles
- 04 vehicles
- 05+ vehicles
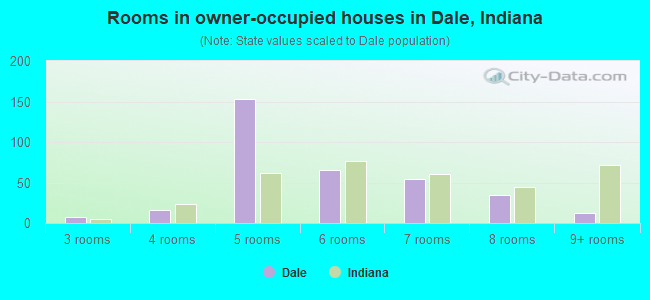
- Rooms in owner-occupied houses in Dale, Indiana
- 01 room
- 02 rooms
- 73 rooms
- 164 rooms
- 1535 rooms
- 656 rooms
- 547 rooms
- 358 rooms
- 129+ rooms
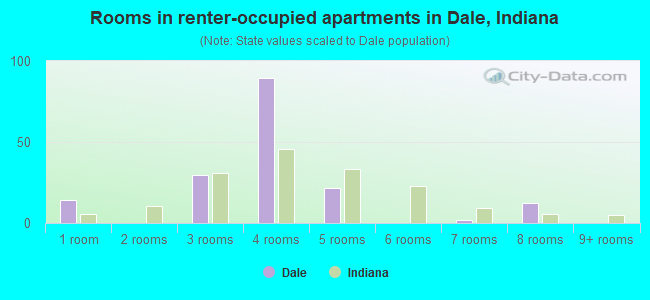
- Rooms in renter-occupied apartments in Dale, Indiana
- 141 room
- 02 rooms
- 303 rooms
- 894 rooms
- 225 rooms
- 06 rooms
- 27 rooms
- 128 rooms
- 09+ rooms
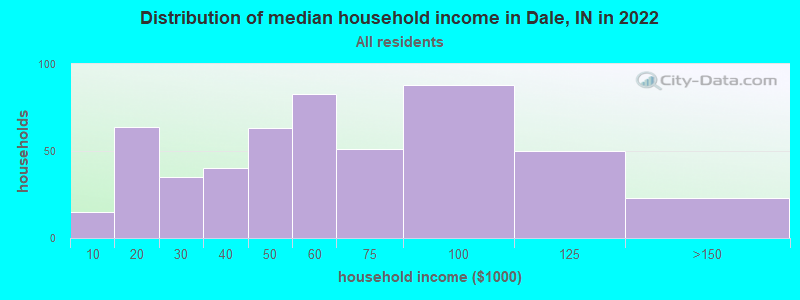
Dale, IN household income distribution

- 15Less than $10,000
- 64$10,000 to $19,999
- 35$20,000 to $29,999
- 40$30,000 to $39,999
- 63$40,000 to $49,999
- 83$50,000 to $59,999
- 51$60,000 to $74,999
- 88$75,000 to $99,999
- 50$100,000 to $124,999
- 22$125,000 to $149,999
- 1$150,000 to $199,999
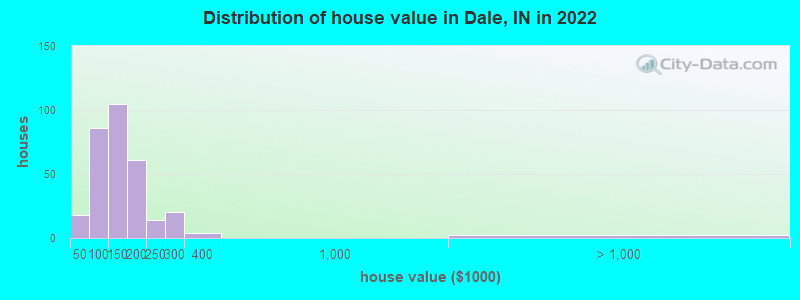
Home value of owner - occupied houses in 2022 in Dale, IN
-
- 5$10,000 to $14,999
- 8$20,000 to $24,999
- 2$35,000 to $39,999
- 2$40,000 to $49,999
- 1$50,000 to $59,999
- 8$60,000 to $69,999
- 21$70,000 to $79,999
- 40$80,000 to $89,999
- 12$90,000 to $99,999
- 83$100,000 to $124,999
- 21$125,000 to $149,999
- 46$150,000 to $174,999
- 14$175,000 to $199,999
- 13$200,000 to $249,999
- 20$250,000 to $299,999
- 4$300,000 to $399,999
- 2$1,000,000 to $1,499,999
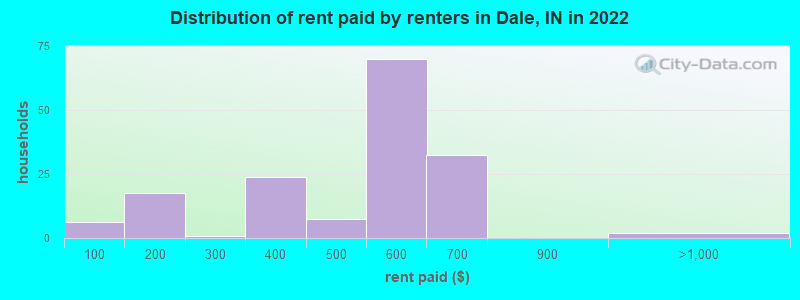
Rent paid by renters in 2022 in Dale, IN
-
- 6Less than $100
- 17$150 to $199
- 0$250 to $299
- 15$300 to $349
- 8$350 to $399
- 2$400 to $449
- 5$450 to $499
- 15$500 to $549
- 54$550 to $599
- 2$600 to $649
- 29$650 to $699
- 1$900 to $999
Percentage of workers working in this county: 35.0%
Number of people working at home: 1 (0.2% of all workers)
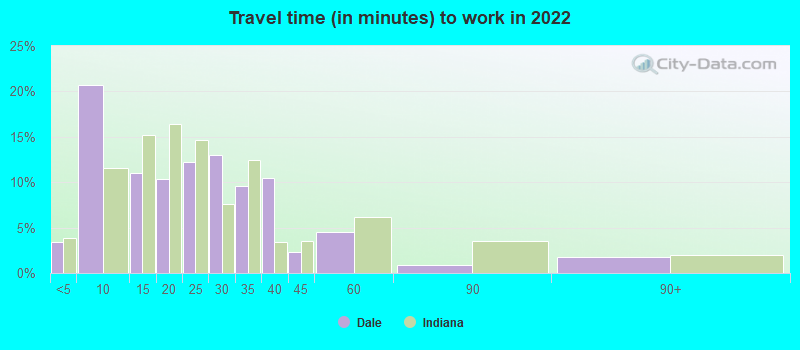
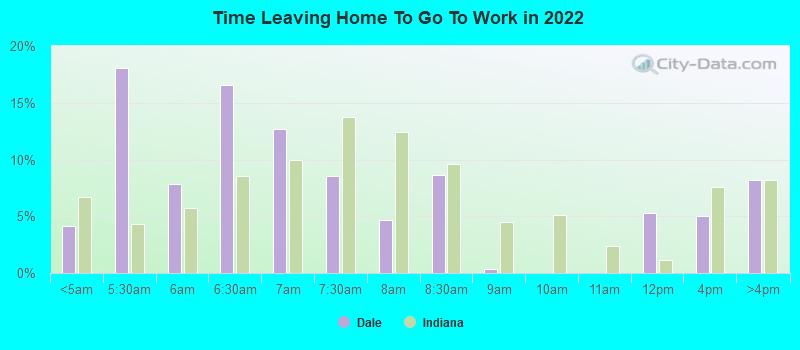
Travel time to work (commute)
- Less than 5 minutes: 22
- 5 to 9 minutes: 94
- 10 to 14 minutes: 42
- 15 to 19 minutes: 113
- 20 to 24 minutes: 16
- 25 to 29 minutes: 25
- 30 to 34 minutes: 70
- 35 to 39 minutes: 35
- 40 to 44 minutes: 19
- 45 to 59 minutes: 38
- 60 to 89 minutes: 54
- 90 or more minutes: 3
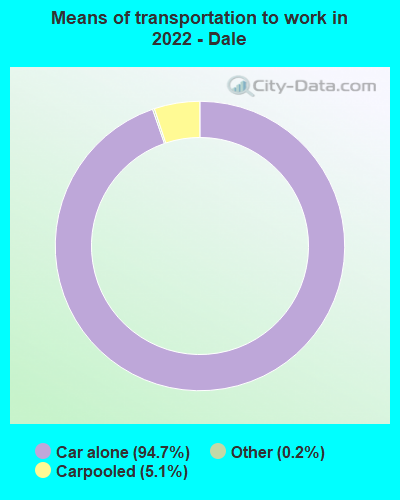
Means of transportation to work:
- Drove a car alone: 601 (91.1%)
- Carpooled: 35 (5.3%)
- Taxi: 1 (0.2%)
- Worked at home: 1 (0.2%)
- Unemployment by race in 2022
- Unemployment rate for White non-Hispanic residents
- 3.2%Males
- 2.3%Females
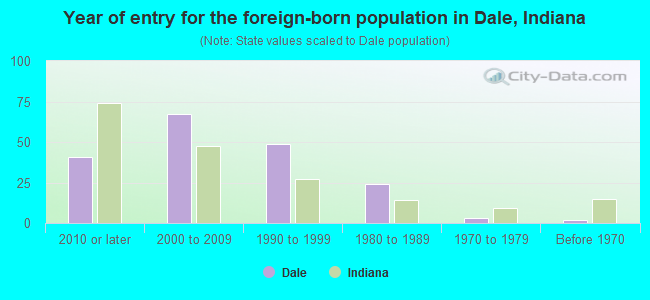
- Year of entry for the foreign-born population in Dale, Indiana
- 412010 or later
- 682000 to 2009
- 491990 to 1999
- 241980 to 1989
- 31970 to 1979
- 2Before 1970
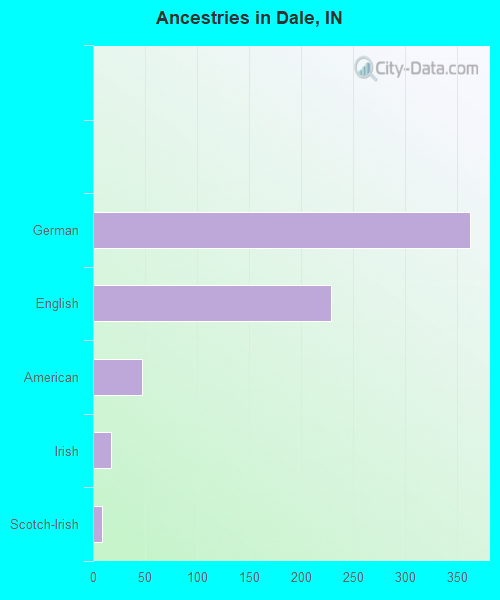
First ancestries reported:
- German: 363 (38.6%)
- English: 229 (24.4%)
- American: 47 (5.0%)
- Irish: 17 (1.8%)
- Scotch-Irish: 9 (1.0%)
- Scottish: 3 (0.3%)
- European: 2 (0.2%)
- Italian: 2 (0.2%)
Most common places of birth for foreign-born residents (%):
| Dale: | 73.6% (128) |
| Indiana: | 27.0% (101,996) |
| Dale: | 31.6% (55) |
| Indiana: | 0.3% (977) |
| Dale: | 5.7% (10) |
| Indiana: | 2.3% (8,656) |
Place of birth for U.S.-born residents:
- This state: 949
- Other state: 302
- Northeast: 10
- Midwest: 97
- South: 166
- West: 23
93.9% of Dale residents lived in the same house 1 years ago.
Out of people who lived in different houses, 35.0% lived in this county.
Out of people who lived in different counties, 85.7% lived in Indiana.
| Dale: | 93.9% |
| State average: | 87.1% |
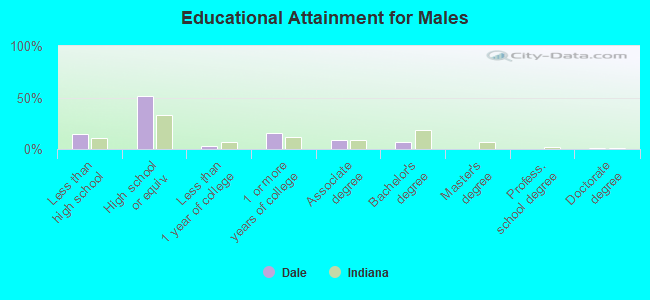
Education attainment for males 25 years and older:
- No schooling: 20
- Nursery to 4th grade: 0
- 5th and 6th grade: 9
- 7th and 8th grade: 6
- 9th grade: 1
- 10th grade: 12
- 11th grade: 13
- 12th grade, no diploma: 2
- High school graduate (or equivalency): 225
- Less than 1 year of college: 14
- Some college more than 1 year, no degree: 67
- Associate degree: 37
- Bachelor's degree: 28
- Master's degree: 0
- Professional school degree: 2
- Doctorate degree: 4
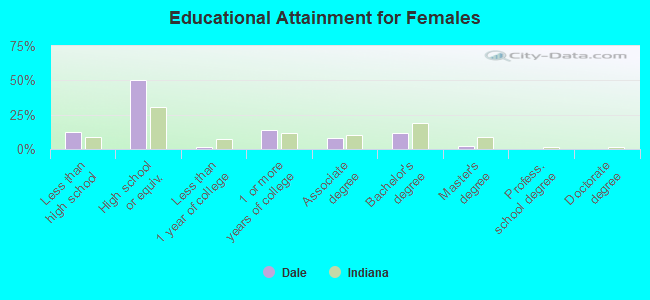
Education attainment for females 25 years and older:
- No schooling: 5
- Nursery to 4th grade: 9
- 5th and 6th grade: 2
- 7th and 8th grade: 20
- 9th grade: 2
- 10th grade: 12
- 11th grade: 3
- 12th grade, no diploma: 0
- High school graduate (or equivalency): 220
- Less than 1 year of college: 7
- Some college more than 1 year, no degree: 61
- Associate degree: 36
- Bachelor's degree: 52
- Master's degree: 10
- Professional school degree: 0
- Doctorate degree: 0
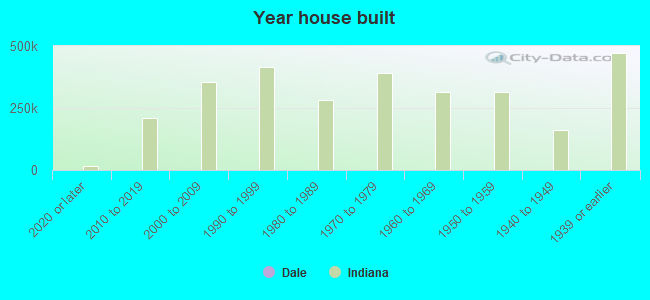
Housing units in structures:
- One, detached: 379
- One, attached: 1
- Two: 30
- 3 or 4: 67
- 5 to 9: 26
- 50 or more: 6
- Mobile homes: 57
Housing units lacking complete kitchen facilities in 2022: 3.4%
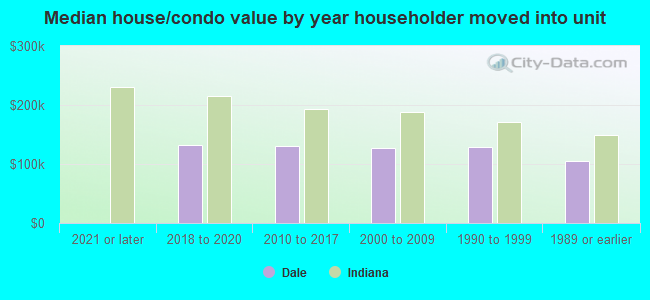
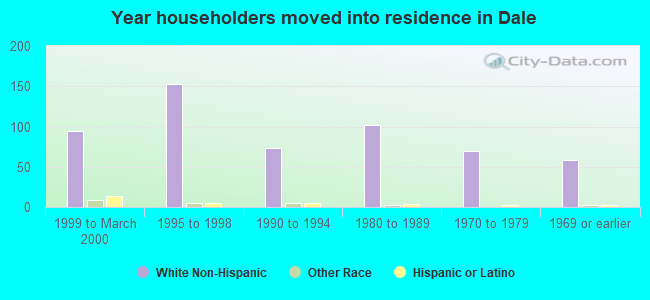
House/condo owner moved in on average 9 years ago
Renter moved in on average 6 years ago
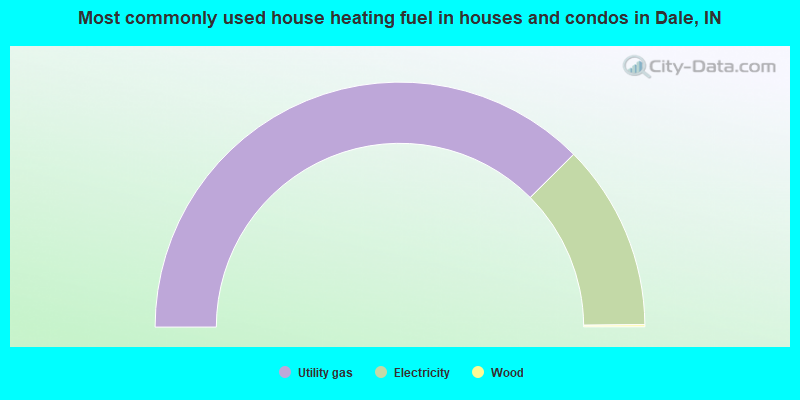
- 75.1%Utility gas
- 24.6%Electricity
- 0.3%Wood
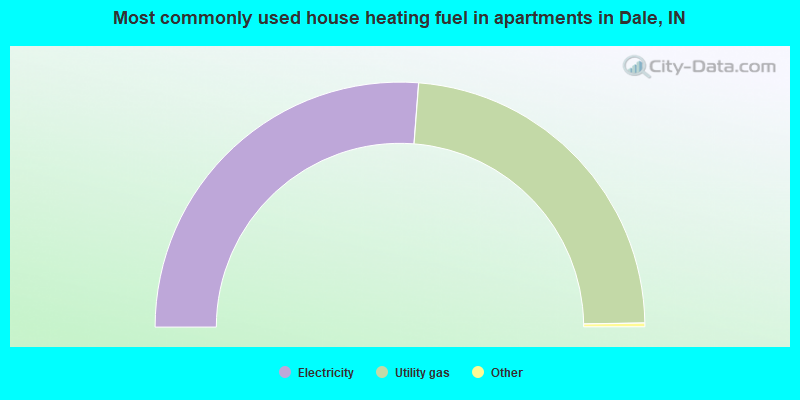
- 52.7%Electricity
- 47.3%Utility gas
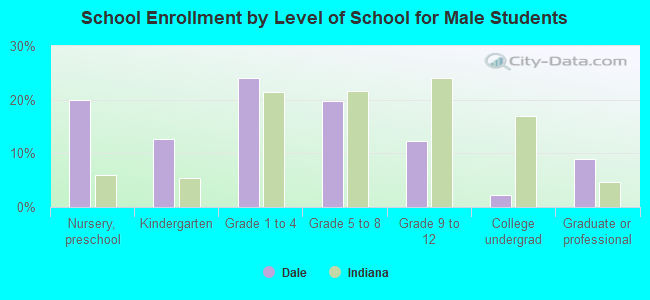
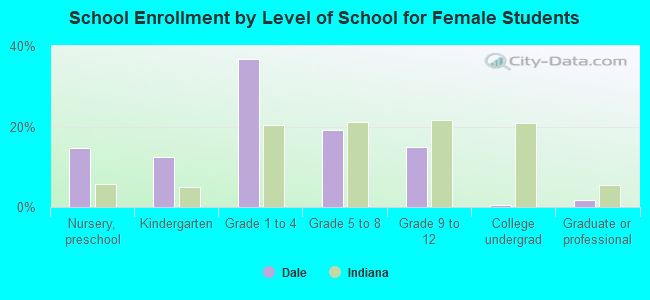
Private vs. public school enrollment:
| Here: | 13.4% |
| Indiana: | 14.9% |
| Here: | 0.0% |
| Indiana: | 11.4% |
| Here: | 0.0% |
| Indiana: | 22.3% |