Davilla, TX (Texas) Houses and Residents
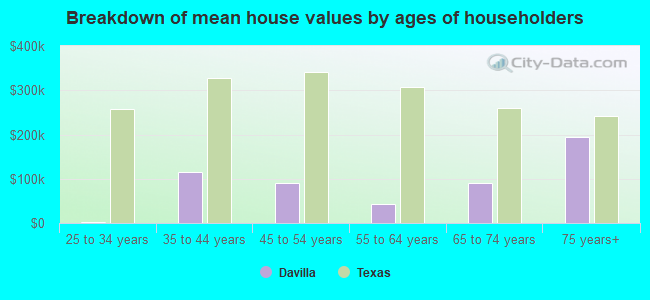
| Davilla: | $240,608 |
| Texas: | $275,400 |
Total population: 1,382 (Urban population: 0, Rural population: 1,375 (227 farm, 1,148 nonfarm))
Houses: 630 (509 occupied: 380 owner occupied, 129 renter occupied)
| % of renters here: | 25% |
| State: | 38% |
Housing density: 5 houses/condos per square mile
Median price asked for vacant for-sale houses and condos in 2022 in this county: $147,424.
Median contract rent in 2022: $657 (lower quartile is $494, upper quartile is $646)
Median rent asked for vacant for-rent units in 2022: $800
Median gross rent in Davilla, TX in 2022: $920
Housing units in Davilla with a mortgage: 49 (0 second mortgage, 0 home equity loan, 0 both second mortgage and home equity loan)
Houses without a mortgage: 85


Household type by relationship:
Households: 24,352- In family households: 21,115 (4,618 male householders, 1,959 female householders)
4,881 spouses, 7,254 children (6,612 natural, 189 adopted, 453 stepchildren), 855 grandchildren, 251 brothers or sisters, 222 parents, foster children, 323 other relatives, 581 non-relatives
- In nonfamily households: 3,237 (1,331 male householders (1,121 living alone)), 1,500 female householders (1,372 living alone)), 406 nonrelatives
- In group quarters: 405 (all institutionalized)
4,332 married couples with children.
1,429 single-parent households (321 men, 1,108 women).
84.1% of residents of Davilla speak English at home.
12.8% of residents speak Spanish at home (83% speak English very well, 7% speak English well, 4% speak English not well, 7% don't speak English at all).
3.1% of residents speak other Indo-European language at home (100% speak English very well).
Foreign born population: 208 (11.1%)
(41.8% of them are naturalized citizens)
| Here: | 6.0 |
| State: | 6.3 |
| Here: | 4.8 |
| State: | 4.0 |
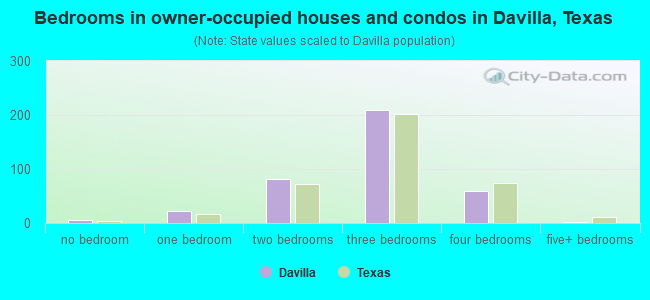
- Bedrooms in owner-occupied houses and condos in Davilla, Texas
- 5no bedroom
- 231 bedroom
- 812 bedrooms
- 2103 bedrooms
- 594 bedrooms
- 25+ bedrooms
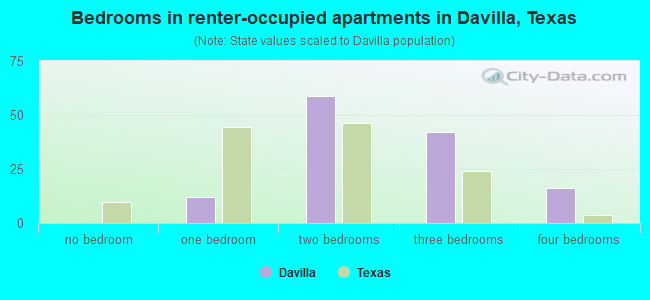
- Bedrooms in renter-occupied apartments in Davilla, Texas
- 0no bedroom
- 121 bedroom
- 592 bedrooms
- 423 bedrooms
- 164 bedrooms
- 05+ bedrooms
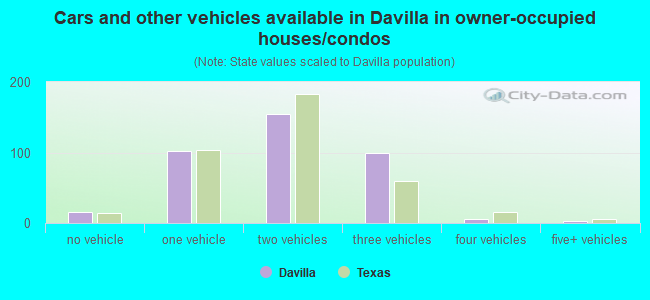
- Cars and other vehicles available in Davilla in owner-occupied houses/condos
- 15no vehicle
- 1021 vehicle
- 1542 vehicles
- 1003 vehicles
- 64 vehicles
- 35+ vehicles
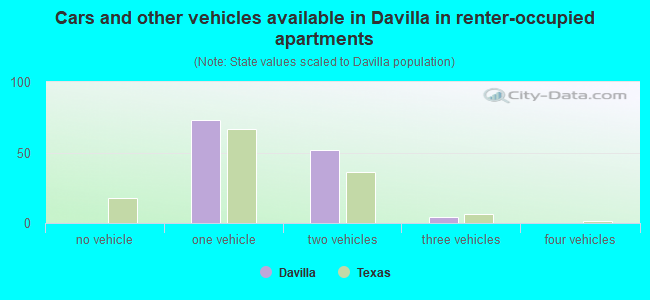
- Cars and other vehicles available in Davilla in renter-occupied apartments
- 0no vehicle
- 731 vehicle
- 522 vehicles
- 43 vehicles
- 04 vehicles
- 05+ vehicles
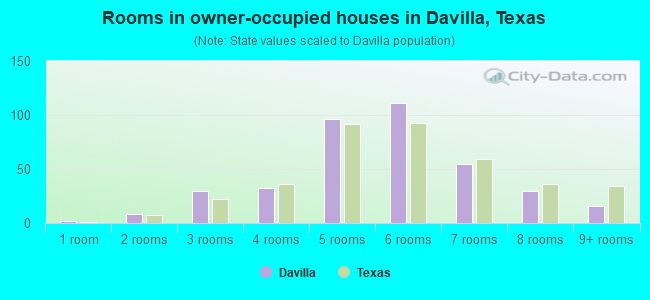
- Rooms in owner-occupied houses in Davilla, Texas
- 21 room
- 82 rooms
- 303 rooms
- 324 rooms
- 965 rooms
- 1116 rooms
- 557 rooms
- 308 rooms
- 169+ rooms
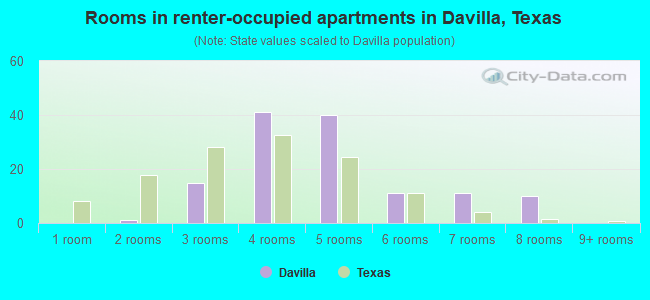
- Rooms in renter-occupied apartments in Davilla, Texas
- 01 room
- 12 rooms
- 153 rooms
- 414 rooms
- 405 rooms
- 116 rooms
- 117 rooms
- 108 rooms
- 09+ rooms
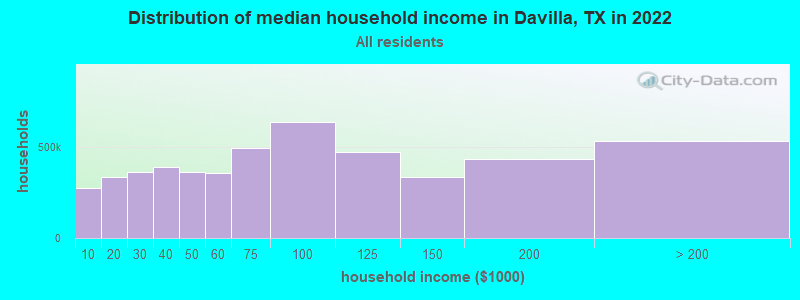
Davilla, TX household income distribution

- 80,609Less than $10,000
- 109,588$10,000 to $19,999
- 119,220$20,000 to $29,999
- 125,570$30,000 to $39,999
- 118,470$40,000 to $49,999
- 113,698$50,000 to $59,999
- 157,393$60,000 to $74,999
- 215,507$75,000 to $99,999
- 163,367$100,000 to $124,999
- 120,441$125,000 to $149,999
- 140,060$150,000 to $199,999
- 157,433$200,000 or more
Percentage of workers working in this county: 48.2%
Number of people working at home: 99 (11.1% of all workers)
Travel time to work (commute)
- Less than 5 minutes: 4
- 5 to 9 minutes: 33
- 10 to 14 minutes: 11
- 15 to 19 minutes: 69
- 20 to 24 minutes: 51
- 25 to 29 minutes: 67
- 30 to 34 minutes: 126
- 35 to 39 minutes: 12
- 40 to 44 minutes: 27
- 45 to 59 minutes: 130
- 60 to 89 minutes: 49
- 90 or more minutes: 39
Means of transportation to work:
- Drove a car alone: 517 (79.3%)
- Carpooled: 76 (11.7%)
- Walked: 20 (3.1%)
- Other means: 5 (0.8%)
- Worked at home: 34 (5.2%)
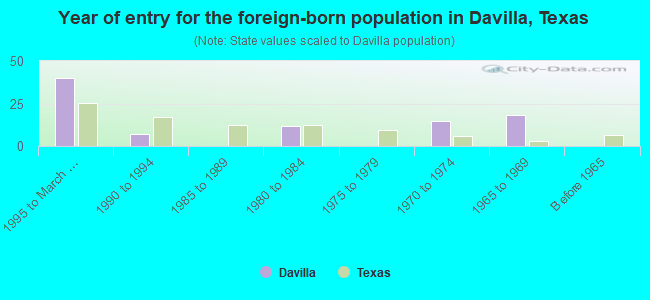
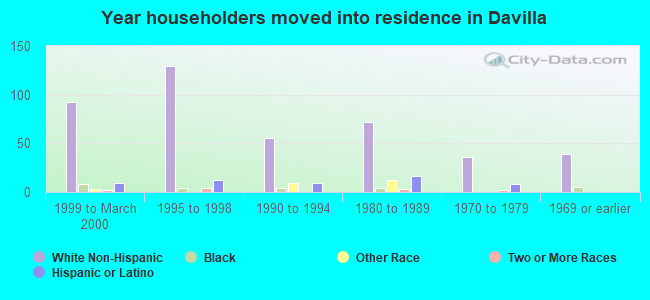
- Year of entry for the foreign-born population in Davilla, Texas
- 401995 to March 2000
- 71990 to 1994
- 01985 to 1989
- 121980 to 1984
- 01975 to 1979
- 151970 to 1974
- 181965 to 1969
- 0Before 1965
Most common places of birth for foreign-born residents (%):
| Davilla: | 56.5% (52) |
| Texas: | 64.8% (1,879,369) |
| Davilla: | 41.3% (38) |
| Texas: | 1.4% (39,249) |
| Davilla: | 2.2% (2) |
| Texas: | 0.5% (13,070) |
Place of birth for U.S.-born residents:
- This state: 1,064
- Other state: 215
- Northeast: 29
- Midwest: 73
- South: 72
- West: 41
68% of Davilla residents lived in the same house 5 years ago.
Out of people who lived in different houses, 36% lived in this county.
Out of people who lived in different counties, 80% lived in Texas.
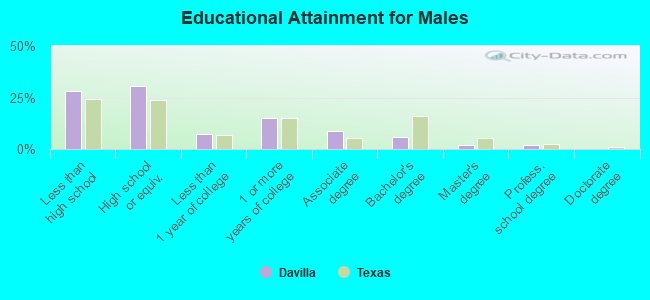
Education attainment for males 25 years and older:
- No schooling: 13
- Nursery to 4th grade: 4
- 5th and 6th grade: 15
- 7th and 8th grade: 16
- 9th grade: 25
- 10th grade: 7
- 11th grade: 25
- 12th grade, no diploma: 18
- High school graduate (or equivalency): 134
- Less than 1 year of college: 32
- Some college more than 1 year, no degree: 66
- Associate degree: 37
- Bachelor's degree: 26
- Master's degree: 8
- Professional school degree: 9
- Doctorate degree: 0
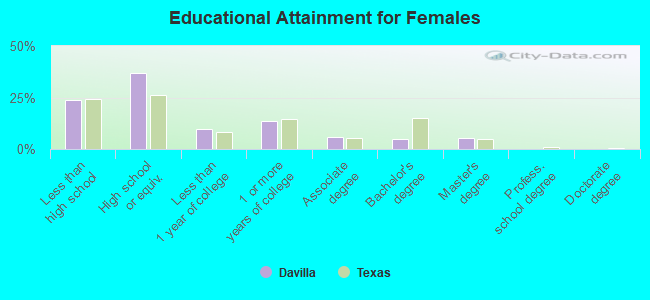
Education attainment for females 25 years and older:
- No schooling: 13
- Nursery to 4th grade: 0
- 5th and 6th grade: 8
- 7th and 8th grade: 15
- 9th grade: 15
- 10th grade: 28
- 11th grade: 6
- 12th grade, no diploma: 19
- High school graduate (or equivalency): 159
- Less than 1 year of college: 42
- Some college more than 1 year, no degree: 58
- Associate degree: 25
- Bachelor's degree: 22
- Master's degree: 23
- Professional school degree: 0
- Doctorate degree: 0
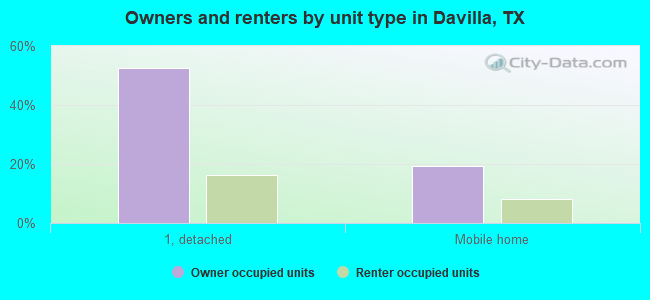
Housing units in structures:
- One, detached: 434
- One, attached: 11
- Two: 5
- Mobile homes: 176
- Boats, RVs, vans, etc.: 4
Median worth of mobile homes: $111,367
Housing units lacking complete kitchen facilities: 6.7%
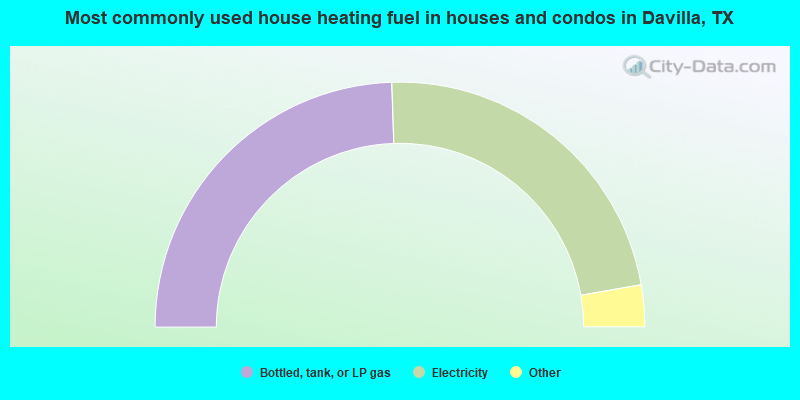
- 48.9%Bottled, tank, or LP gas
- 45.5%Electricity
- 3.2%Wood
- 1.8%Utility gas
- 0.5%No fuel used
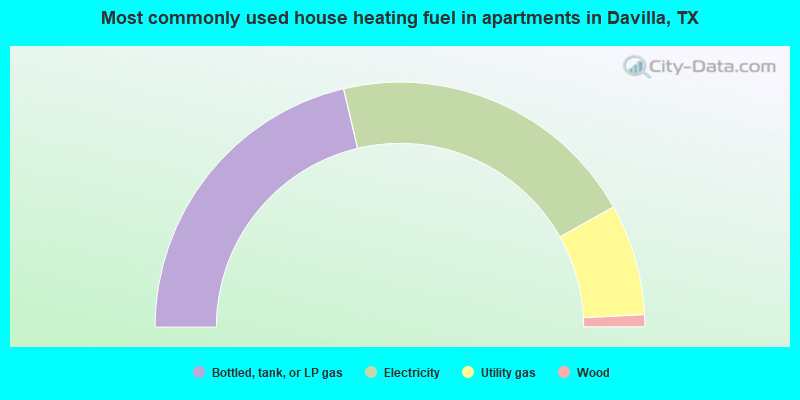
- 42.6%Bottled, tank, or LP gas
- 41.1%Electricity
- 14.7%Utility gas
- 1.6%Wood
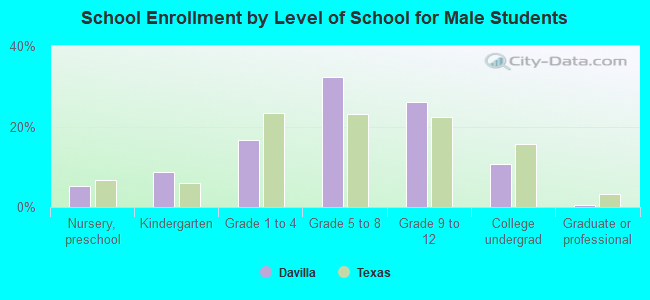
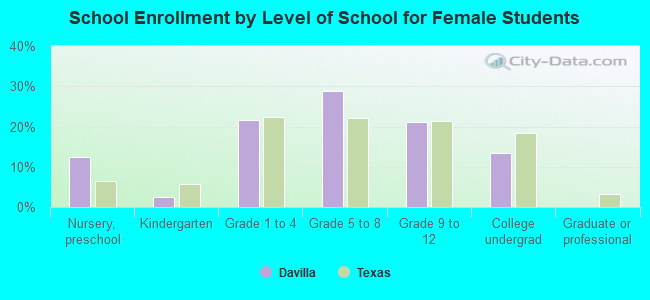
Private vs. public school enrollment:
| Here: | 2.8% |
| Texas: | 6.8% |
| Here: | 2.9% |
| Texas: | 6.2% |
| Here: | 9.8% |
| Texas: | 15.4% |