De Funiak Springs, FL (Florida) Houses and Residents
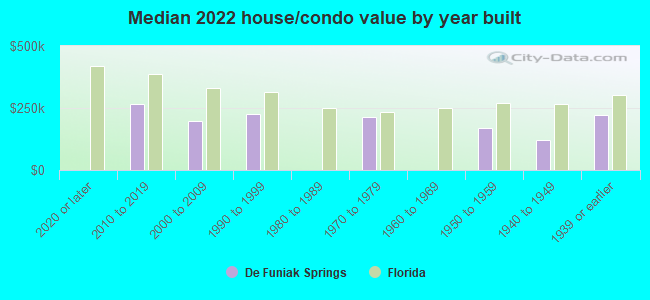
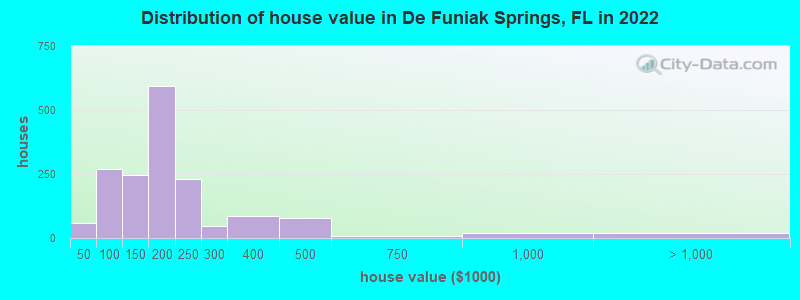
| De Funiak Springs: | $192,230 |
| Florida: | $354,100 |
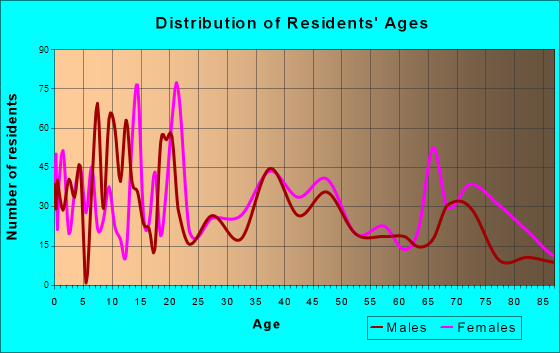
Total population: 5,601 (Urban population: 4,027 (all inside urban clusters), Rural population: 1,125 (all nonfarm))
Houses: 2,955 (2,576 occupied: 1,793 owner occupied, 1,001 renter occupied)
| % of renters here: | 36% |
| State: | 33% |
Housing density: 269 houses/condos per square mile
Median price asked for vacant for-sale houses and condos in 2022: $258,049.
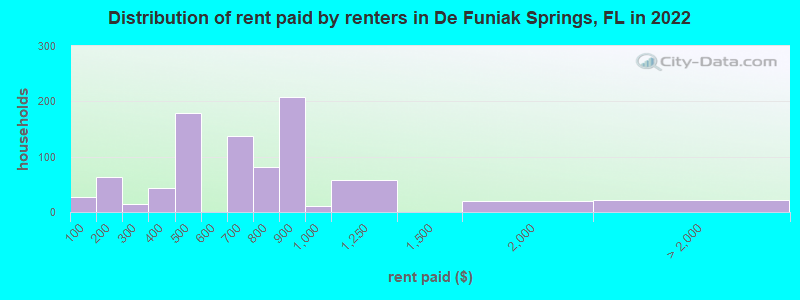
Median contract rent in 2022: $697 (lower quartile is $473, upper quartile is $842)
Median rent asked for vacant for-rent units in 2022: $707
Median gross rent in De Funiak Springs, FL in 2022: $843
Housing units in De Funiak Springs with a mortgage: 1,014 (130 second mortgage, 0 home equity loan, 141 both second mortgage and home equity loan)
Houses without a mortgage: 28
Median household income for houses/condos with a mortgage: $83,964
Median household income for apartments without a mortgage: $53,972
Median monthly housing costs: $1,004
Compare current foreclosures near De Funiak Springs, FL:
| Photo | Address | Area | Beds / Baths | Price | Details |
|---|---|---|---|---|---|

|
#1
Cook Ave
Defuniak Springs, FL 32433
|
854 sq. feet
|
1 baths 3 beds |
$44,900
|
show details |

|
#2
Senterfitt Rd
Defuniak Springs, FL 32435
|
1,510 sq. feet
|
2 baths 4 beds |
show details | |

|
#3
Coyote Rd
Defuniak Springs, FL 32433
|
2,280 sq. feet
|
2 baths 4 beds |
show details | |

|
#4
Hunters Ridge Rd
Defuniak Springs, FL 32433
|
1,654 sq. feet
|
2 baths 3 beds |
show details | |

|
#5
S Norwood Rd
Defuniak Springs, FL 32435
|
2,429 sq. feet
|
2 baths 4 beds |
show details | |

|
#6
Davidson Rd
Defuniak Springs, FL 32433
|
2,018 sq. feet
|
2 baths 3 beds |
show details | |

|
#7
Bailie Rd
Crestview, FL 32539
|
1,766 sq. feet
|
2 baths 3 beds |
show details | |

|
#8
Smith Rd
Defuniak Springs, FL 32433
|
1,404 sq. feet
|
2 baths 3 beds |
show details | |

|
#9
Adams Ranch Rd
Defuniak Springs, FL 32433
|
1,712 sq. feet
|
2 baths 3 beds |
show details | |

|
#10
Michigan Ln
Defuniak Springs, FL 32433
|
1,540 sq. feet
|
2 baths 3 beds |
show details |
| Photo | Address | Area | Beds / Baths | Price | Details |
|---|---|---|---|---|---|

|
#11
Little Deer Hl
Defuniak Springs, FL 32435
|
1,188 sq. feet
|
1 baths 2 beds |
show details | |

|
#12
Us Highway 90 W
Defuniak Springs, FL 32433
|
1,542 sq. feet
|
2 baths 3 beds |
show details | |

|
#13
State Highway 83, Ste C
Defuniak Springs, FL 32433
|
1,400 sq. feet
|
1 baths - beds |
show details | |

|
#14
Alaqua Terrace Rd
Freeport, FL 32439
|
- sq. feet
|
- baths - beds |
show details | |

|
#15
Lafayette Crk
Freeport, FL 32439
|
- sq. feet
|
- baths - beds |
show details | |

|
#16
Madiera Dr
Freeport, FL 32439
|
- sq. feet
|
- baths - beds |
show details | |

|
#17
Gillman Rd
Westville, FL 32464
|
- sq. feet
|
- baths - beds |
show details | |

|
#18
Symphony Way
Freeport, FL 32439
|
- sq. feet
|
- baths - beds |
show details | |

|
#19
Highway 179a
Westville, FL 32464
|
1,240 sq. feet
|
- baths - beds |
show details | |

|
#20
331 Business, Unit 2e
Freeport, FL 32439
|
- sq. feet
|
- baths - beds |
show details |
| Photo | Address | Area | Beds / Baths | Price | Details |
|---|---|---|---|---|---|

|
#21
Alma Rd
Defuniak Springs, FL 32433
|
- sq. feet
|
- baths - beds |
show details | |

|
#22
Whispering Creek Ave
Freeport, FL 32439
|
- sq. feet
|
- baths - beds |
show details | |

|
#23
Highway 10a
Ponce De Leon, FL 32455
|
- sq. feet
|
- baths - beds |
show details | |

|
#24
Roberts Rd E
Defuniak Springs, FL 32433
|
- sq. feet
|
- baths - beds |
show details | |

|
#25
Jewel Dr
Defuniak Springs, FL 32433
|
- sq. feet
|
- baths - beds |
show details | |

|
#26
E Tulip Ave
Defuniak Springs, FL 32433
|
- sq. feet
|
- baths - beds |
show details | |

|
#27
W Juniper Ave
Defuniak Springs, FL 32433
|
- sq. feet
|
- baths - beds |
show details | |

|
#28
Bryan Ln
Defuniak Springs, FL 32435
|
- sq. feet
|
- baths - beds |
show details | |

|
#29
Lancaster Ln
Defuniak Springs, FL 32433
|
- sq. feet
|
- baths - beds |
show details | |

|
#30
Roberts Dr
Defuniak Springs, FL 32433
|
- sq. feet
|
- baths - beds |
show details |
| Photo | Address | Area | Beds / Baths | Price | Details |
|---|---|---|---|---|---|

|
#31
Lake Rosemary Cir
Defuniak Springs, FL 32433
|
- sq. feet
|
- baths - beds |
show details | |

|
#32
Palmetto Ave
Crestview, FL 32539
|
- sq. feet
|
- baths - beds |
show details | |

|
Check over 1 million property listings on Foreclosure.com!
|
browse all offers | |||

 | Where Is The Best Place To Live In Florida For Work And Affordable Housing? (347 replies) |
| Florida Animal Shelters (1 reply) |
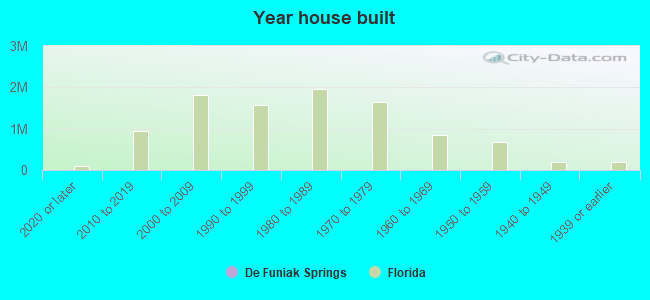
Median year apartment built: 1986
Household type by relationship:
Households: 6,601- Male householders: 1,120 (300 living alone), Female householders: 1,481 (353 living alone)
919 spouses (910 opposite-sex spouses), 275 unmarried partners, (207 opposite-sex unmarried partners), 1,904 children (1,715 natural, 36 adopted, 152 stepchildren), 262 grandchildren, 18 brothers or sisters, 75 parents, 0 foster children, 64 other relatives, 246 non-relatives
- In group quarters: 232
Size of family households: 522 2-persons, 684 3-persons, 252 4-persons, 117 5-persons, 74 6-persons, 5 7-or-more-persons.
Size of nonfamily households: 648 1-person, 327 2-persons, 139 3-persons, 18 5-persons.
703 married couples with children.
640 single-parent households (0 men, 640 women).
95.9% of residents of De Funiak Springs speak English at home.
3.1% of residents speak Spanish at home (24% speak English very well, 51% speak English not well, 25% don't speak English at all).
0.4% of residents speak other Indo-European language at home (100% speak English very well).
Foreign born population: 261 (4.0%)
(14.2% of them are naturalized citizens)
| Here: | 5.8 |
| State: | 5.9 |
| Here: | 4.7 |
| State: | 4.2 |
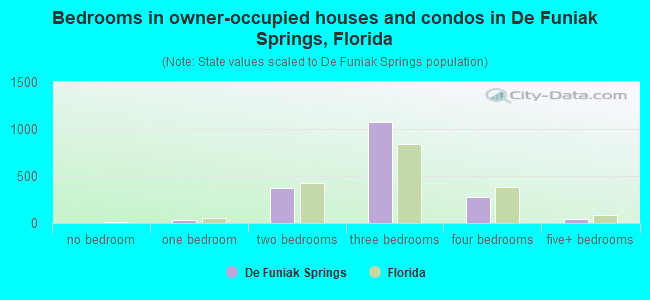
- Bedrooms in owner-occupied houses and condos in De Funiak Springs, Florida
- 0no bedroom
- 331 bedroom
- 3722 bedrooms
- 1,0743 bedrooms
- 2744 bedrooms
- 405+ bedrooms
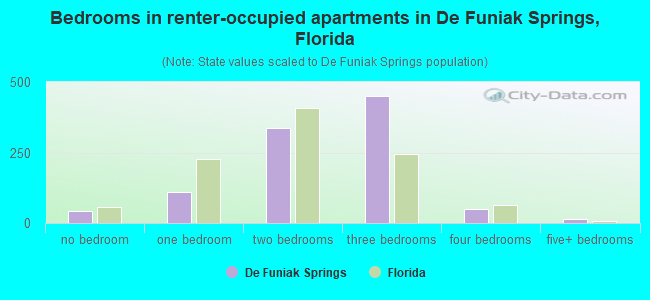
- Bedrooms in renter-occupied apartments in De Funiak Springs, Florida
- 42no bedroom
- 1101 bedroom
- 3362 bedrooms
- 4503 bedrooms
- 504 bedrooms
- 145+ bedrooms
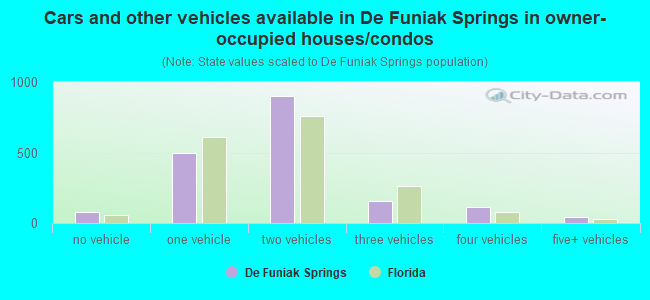
- Cars and other vehicles available in De Funiak Springs in owner-occupied houses/condos
- 81no vehicle
- 5001 vehicle
- 9032 vehicles
- 1583 vehicles
- 1134 vehicles
- 405+ vehicles
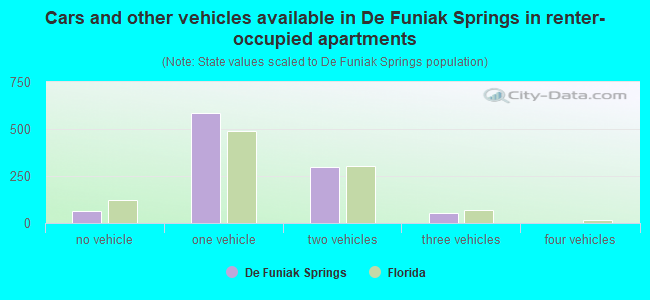
- Cars and other vehicles available in De Funiak Springs in renter-occupied apartments
- 62no vehicle
- 5851 vehicle
- 3002 vehicles
- 553 vehicles
- 04 vehicles
- 05+ vehicles
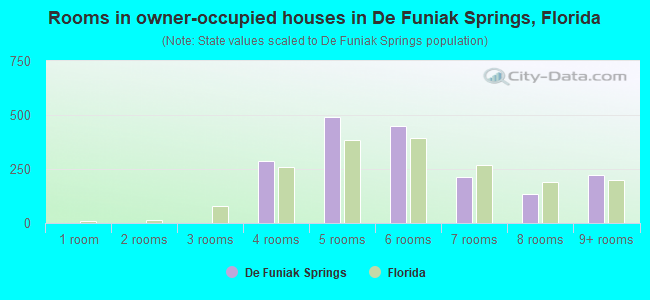
- Rooms in owner-occupied houses in De Funiak Springs, Florida
- 01 room
- 02 rooms
- 03 rooms
- 2854 rooms
- 4925 rooms
- 4486 rooms
- 2147 rooms
- 1328 rooms
- 2239+ rooms
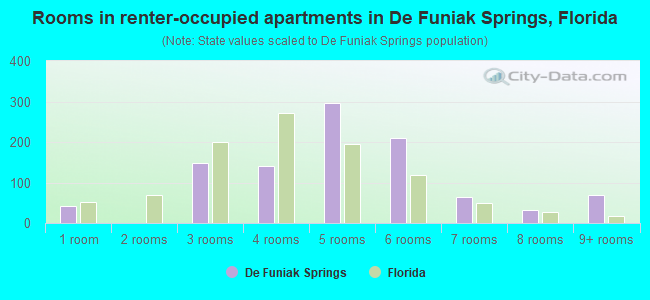
- Rooms in renter-occupied apartments in De Funiak Springs, Florida
- 421 room
- 02 rooms
- 1473 rooms
- 1414 rooms
- 2975 rooms
- 2106 rooms
- 647 rooms
- 328 rooms
- 699+ rooms
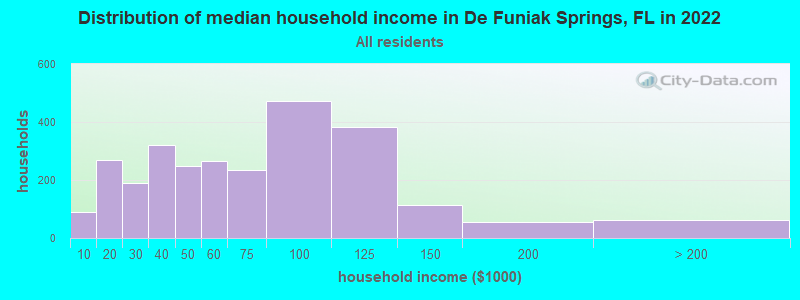
De Funiak Springs, FL household income distribution

- 90Less than $10,000
- 269$10,000 to $19,999
- 188$20,000 to $29,999
- 322$30,000 to $39,999
- 248$40,000 to $49,999
- 264$50,000 to $59,999
- 236$60,000 to $74,999
- 471$75,000 to $99,999
- 384$100,000 to $124,999
- 113$125,000 to $149,999
- 54$150,000 to $199,999
- 63$200,000 or more
Home value of owner - occupied houses in 2022 in De Funiak Springs, FL
-
- 57$10,000 to $14,999
- 3$30,000 to $34,999
- 20$50,000 to $59,999
- 176$60,000 to $69,999
- 25$70,000 to $79,999
- 13$80,000 to $89,999
- 32$90,000 to $99,999
- 75$100,000 to $124,999
- 172$125,000 to $149,999
- 554$150,000 to $174,999
- 37$175,000 to $199,999
- 230$200,000 to $249,999
- 46$250,000 to $299,999
- 86$300,000 to $399,999
- 77$400,000 to $499,999
- 8$500,000 to $749,999
- 19$750,000 to $999,999
- 17$1,500,000 to $1,999,999
Rent paid by renters in 2022 in De Funiak Springs, FL
-
- 28Less than $100
- 63$150 to $199
- 14$250 to $299
- 27$300 to $349
- 15$350 to $399
- 171$400 to $449
- 8$450 to $499
- 72$600 to $649
- 65$650 to $699
- 65$700 to $749
- 15$750 to $799
- 207$800 to $899
- 10$900 to $999
- 57$1,000 to $1,249
- 18$1,500 to $1,999
- 21No cash rent
Percentage of workers working in this county: 84.1%
Number of people working at home: 359 (13.6% of all workers)
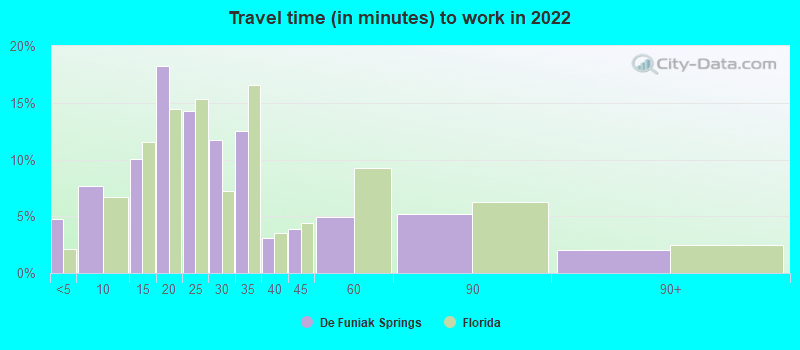
Travel time to work (commute)
- Less than 5 minutes: 109
- 5 to 9 minutes: 320
- 10 to 14 minutes: 259
- 15 to 19 minutes: 228
- 20 to 24 minutes: 62
- 25 to 29 minutes: 455
- 30 to 34 minutes: 302
- 35 to 39 minutes: 20
- 40 to 44 minutes: 19
- 45 to 59 minutes: 354
- 60 to 89 minutes: 292
- 90 or more minutes: 0
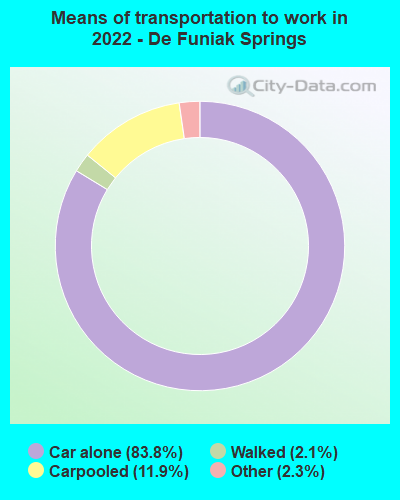
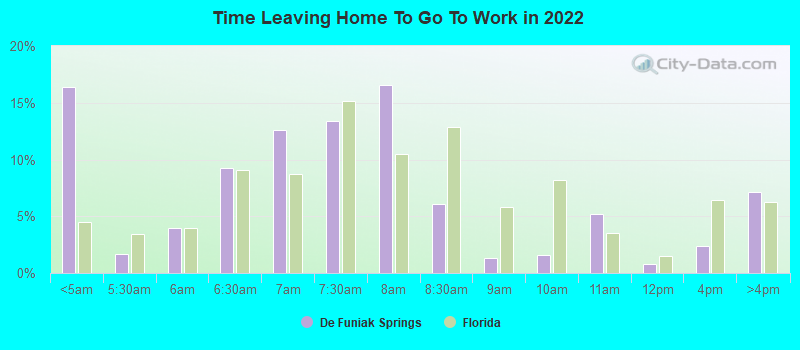
Means of transportation to work:
- Drove a car alone: 3,871 (74.7%)
- Carpooled: 583 (11.3%)
- Taxi: 118 (2.3%)
- Walked: 103 (2.0%)
- Worked at home: 359 (6.9%)
- Unemployment by race in 2022
- Unemployment rate for White non-Hispanic residents
- 3.3%Males
- Unemployment rate for Black residents
- 70.8%Males
- 6.3%Females
- Unemployment rate for American Indian and Alaska Native residents
- 24.8%Males
- Unemployment rate for two or more race residents
- 15.4%Males
- Unemployment rate for Hispanic or Latino residents
- 21.4%Males
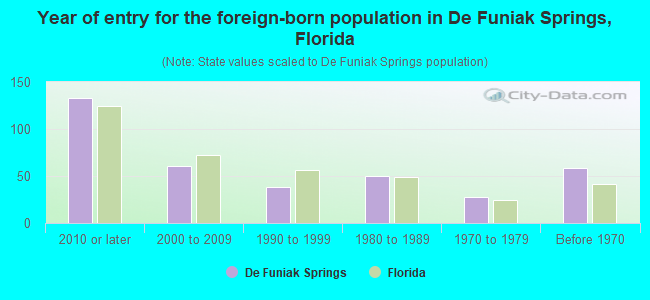
- Year of entry for the foreign-born population in De Funiak Springs, Florida
- 1332010 or later
- 612000 to 2009
- 381990 to 1999
- 501980 to 1989
- 281970 to 1979
- 59Before 1970
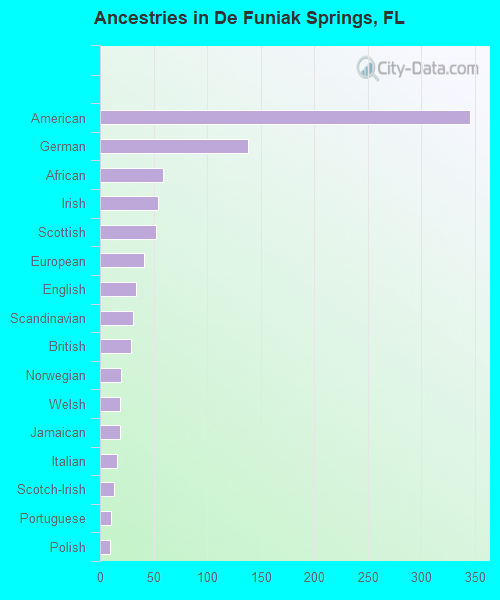
First ancestries reported:
- American: 346 (14.9%)
- German: 138 (5.9%)
- African: 59 (2.5%)
- Irish: 54 (2.3%)
- Scottish: 52 (2.2%)
- European: 41 (1.8%)
- English: 34 (1.5%)
- Scandinavian: 31 (1.3%)
- British: 29 (1.2%)
- Norwegian: 20 (0.9%)
- Welsh: 19 (0.8%)
- Jamaican: 19 (0.8%)
- Italian: 16 (0.7%)
- Scotch-Irish: 13 (0.6%)
- Portuguese: 10 (0.4%)
- Polish: 9 (0.4%)
Most common places of birth for foreign-born residents (%):
| De Funiak Springs: | 64.0% (160) |
| Florida: | 5.6% (257,152) |
| De Funiak Springs: | 10.4% (26) |
| Florida: | 2.4% (109,132) |
| De Funiak Springs: | 6.0% (15) |
| Florida: | 2.1% (97,632) |
| De Funiak Springs: | 6.0% (15) |
| Florida: | 0.3% (15,079) |
| De Funiak Springs: | 2.8% (7) |
| Florida: | 0.6% (25,219) |
| De Funiak Springs: | 2.0% (5) |
| Florida: | 22.0% (1,006,576) |
Place of birth for U.S.-born residents:
- This state: 4,519
- Other state: 2,100
- Northeast: 89
- Midwest: 276
- South: 1,495
- West: 279
85.1% of De Funiak Springs residents lived in the same house 1 years ago.
Out of people who lived in different houses, 26.0% lived in this county.
Out of people who lived in different counties, 41.8% lived in Florida.
| De Funiak Springs: | 85.1% |
| State average: | 86.3% |
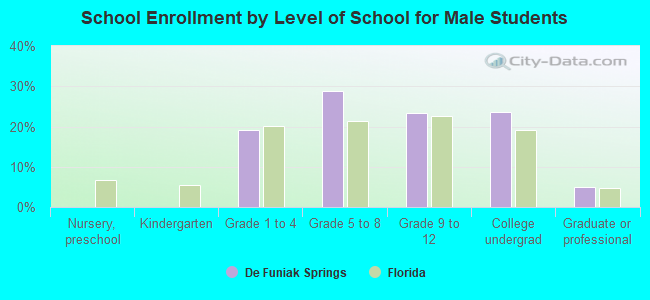
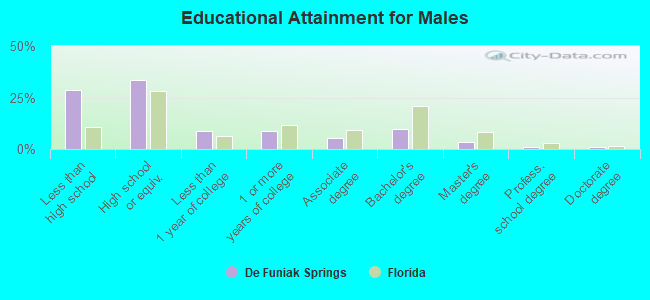
Education attainment for males 25 years and older:
- No schooling: 25
- Nursery to 4th grade: 0
- 5th and 6th grade: 60
- 7th and 8th grade: 23
- 9th grade: 70
- 10th grade: 14
- 11th grade: 418
- 12th grade, no diploma: 0
- High school graduate (or equivalency): 711
- Less than 1 year of college: 181
- Some college more than 1 year, no degree: 181
- Associate degree: 118
- Bachelor's degree: 201
- Master's degree: 72
- Professional school degree: 19
- Doctorate degree: 25
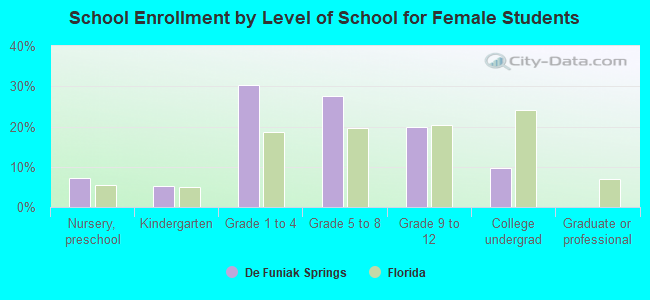
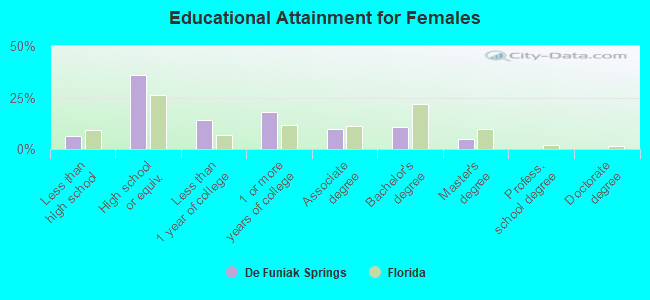
Education attainment for females 25 years and older:
- No schooling: 33
- Nursery to 4th grade: 0
- 5th and 6th grade: 0
- 7th and 8th grade: 5
- 9th grade: 12
- 10th grade: 23
- 11th grade: 64
- 12th grade, no diploma: 23
- High school graduate (or equivalency): 876
- Less than 1 year of college: 349
- Some college more than 1 year, no degree: 442
- Associate degree: 232
- Bachelor's degree: 264
- Master's degree: 121
- Professional school degree: 1
- Doctorate degree: 0
Housing units in structures:
- One, detached: 2,369
- One, attached: 9
- Two: 78
- 3 or 4: 213
- 5 to 9: 74
- 10 to 19: 120
- 20 to 49: 51
- 50 or more: 7
- Mobile homes: 30
Housing units lacking complete kitchen facilities in 2022: 6.8%
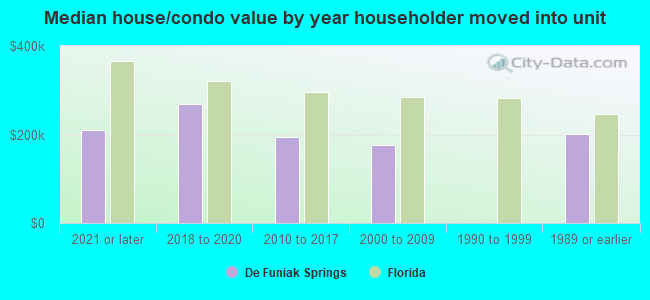
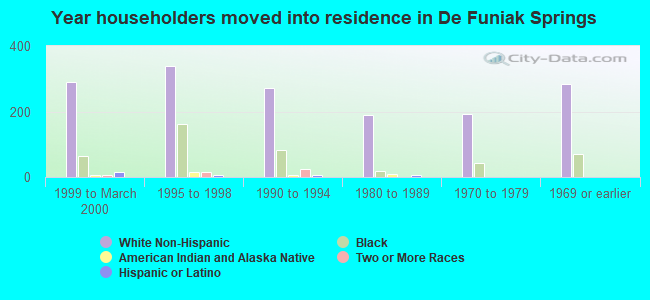
House/condo owner moved in on average 10 years ago
Renter moved in on average 5 years ago
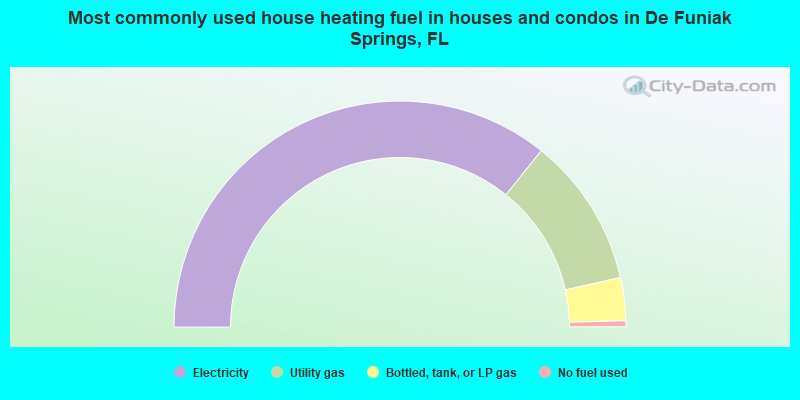
- 71.5%Electricity
- 21.5%Utility gas
- 6.1%Bottled, tank, or LP gas
- 0.9%No fuel used
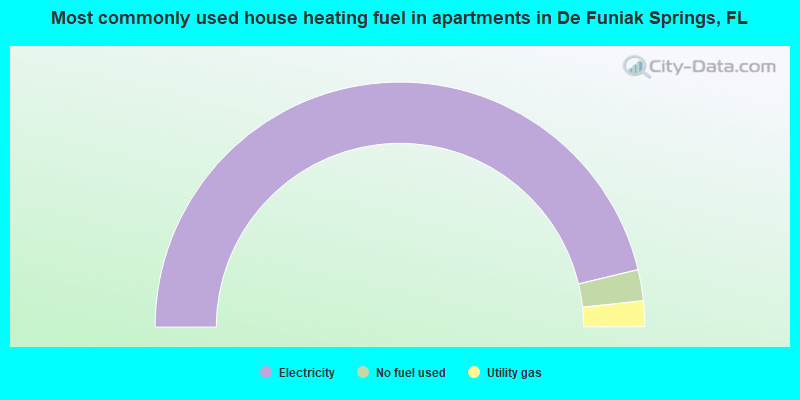
- 92.5%Electricity
- 4.1%No fuel used
- 3.4%Utility gas
Private vs. public school enrollment:
| Here: | 4.1% |
| Florida: | 15.8% |
| Here: | 12.2% |
| Florida: | 12.9% |
| Here: | 7.2% |
| Florida: | 23.6% |