Deep River, CT (Connecticut) Houses and Residents
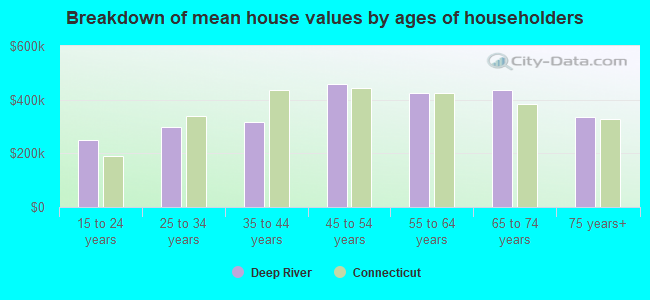
| Deep River: | $352,172 |
| Connecticut: | $347,200 |
Total population: 4,629 (Urban population: 2,249, Rural population: 2,361 (all nonfarm))
Houses: 1,910 (1,824 occupied: 1,363 owner occupied, 461 renter occupied)
| % of renters here: | 25% |
| State: | 34% |
Housing density: 141 houses/condos per square mile
Median price asked for vacant for-sale houses and condos in 2022 in this county: $431,754.
Median contract rent in 2022: $1,297 (lower quartile is $986, upper quartile is $1,647)
Median rent asked for vacant for-rent units in 2022: $1,323
Median gross rent in Deep River, CT in 2022: $1,535
Housing units in Deep River with a mortgage: 784 (110 second mortgage, 53 home equity loan, 7 both second mortgage and home equity loan)
Houses without a mortgage: 404
Compare current foreclosures near Deep River, CT:
| Photo | Address | Area | Beds / Baths | Price | Details |
|---|---|---|---|---|---|

|
#1
Kelsey Hill Rd
Deep River, CT 06417
|
2,848 sq. feet
|
3 baths 3 beds |
show details | |

|
#2
Railroad Ave
Chester, CT 06412
|
2,092 sq. feet
|
2 baths 4 beds |
$499,900
|
show details |

|
#3
Lake Dr E
Oakdale, CT 06370
|
1,346 sq. feet
|
1 baths 3 beds |
$365,000
|
show details |

|
#4
Westchester Rd
Colchester, CT 06415
|
900 sq. feet
|
1 baths 2 beds |
$309,900
|
show details |

|
#5
Rope Ferry Rd Unit N161
Waterford, CT 06385
|
576 sq. feet
|
1 baths 1 beds |
show details | |

|
#6
Route 79
Killingworth, CT 06419
|
2,199 sq. feet
|
1 baths 3 beds |
show details | |

|
#7
W Main St
Clinton, CT 06413
|
1,080 sq. feet
|
1 baths 3 beds |
show details | |

|
#8
Feather Ln
North Branford, CT 06471
|
4,408 sq. feet
|
2 baths 4 beds |
show details | |

|
#9
Old Nod Rd
Clinton, CT 06413
|
2,249 sq. feet
|
1 baths 3 beds |
show details | |

|
#10
E Main St
Middletown, CT 06457
|
1,736 sq. feet
|
2 baths 3 beds |
show details |
| Photo | Address | Area | Beds / Baths | Price | Details |
|---|---|---|---|---|---|

|
#11
Abbey Rd
East Hampton, CT 06424
|
2,541 sq. feet
|
2 baths 3 beds |
show details | |

|
#12
Vale St
Middletown, CT 06457
|
960 sq. feet
|
1 baths 3 beds |
show details | |

|
#13
N Main St Unit 32
East Hampton, CT 06424
|
1,040 sq. feet
|
1 baths 2 beds |
show details | |

|
#14
Ridge Rd # 2
Middletown, CT 06457
|
2,862 sq. feet
|
3 baths 5 beds |
show details | |

|
#15
E Main St
Middletown, CT 06457
|
998 sq. feet
|
1 baths 1 beds |
show details | |

|
#16
Saybrook Rd
Middletown, CT 06457
|
1,587 sq. feet
|
2 baths 4 beds |
show details | |

|
#17
Great Hill Rd
Guilford, CT 06437
|
2,592 sq. feet
|
2 baths 2 beds |
show details | |

|
#18
Gowin Rd
Middletown, CT 06457
|
912 sq. feet
|
1 baths 3 beds |
show details | |

|
#19
Blue Acre Rd
Middletown, CT 06457
|
1,346 sq. feet
|
2 baths 3 beds |
show details | |

|
#20
W High St
East Hampton, CT 06424
|
1,568 sq. feet
|
2 baths 2 beds |
show details |
| Photo | Address | Area | Beds / Baths | Price | Details |
|---|---|---|---|---|---|

|
#21
Curry Ln
East Hampton, CT 06424
|
2,066 sq. feet
|
2 baths 3 beds |
show details | |

|
#22
Woodland Rd
Guilford, CT 06437
|
1,113 sq. feet
|
1 baths 3 beds |
show details | |

|
#23
Lake Dr E
Oakdale, CT 06370
|
1,371 sq. feet
|
2 baths 3 beds |
show details | |

|
#24
1st Ave
Waterford, CT 06385
|
1,547 sq. feet
|
1 baths 4 beds |
show details | |

|
#25
Carolina Dr Apt 21
Oakdale, CT 06370
|
960 sq. feet
|
1 baths 2 beds |
show details | |

|
#26
Kennedy Dr
Colchester, CT 06415
|
1,132 sq. feet
|
2 baths 3 beds |
show details | |

|
#27
Saw Mill Hill Rd
Guilford, CT 06437
|
3,432 sq. feet
|
4 baths 4 beds |
show details | |

|
#28
Durham Rd
Guilford, CT 06437
|
2,139 sq. feet
|
1 baths 4 beds |
show details | |

|
#29
Route 80
Guilford, CT 06437
|
2,164 sq. feet
|
2 baths 4 beds |
show details | |

|
#30
Park Ave
Colchester, CT 06415
|
1,224 sq. feet
|
1 baths 3 beds |
show details |
| Photo | Address | Area | Beds / Baths | Price | Details |
|---|---|---|---|---|---|

|
#31
Way Rd
Salem, CT 06420
|
1,040 sq. feet
|
1 baths 3 beds |
show details | |

|
#32
Long Hill Rd
Middletown, CT 06457
|
1,360 sq. feet
|
1 baths 3 beds |
show details | |

|
#33
Riverside St
Portland, CT 06480
|
1,274 sq. feet
|
1 baths 2 beds |
show details | |

|
#34
Pearl St
Middletown, CT 06457
|
2,832 sq. feet
|
2 baths 4 beds |
show details | |

|
#35
Middlefield St
Middletown, CT 06457
|
1,318 sq. feet
|
1 baths 3 beds |
show details | |

|
#36
Vauxhall St
New London, CT 06320
|
915 sq. feet
|
1 baths 2 beds |
show details | |

|
#37
Moxley Rd
Uncasville, CT 06382
|
1,118 sq. feet
|
2 baths 3 beds |
show details | |

|
#38
Butternut St
Middletown, CT 06457
|
1,498 sq. feet
|
1 baths 4 beds |
show details | |

|
#39
Longworth Ave
Middletown, CT 06457
|
1,456 sq. feet
|
2 baths 3 beds |
show details | |

|
#40
Main St
Middlefield, CT 06455
|
1,526 sq. feet
|
2 baths 3 beds |
show details |
| Photo | Address | Area | Beds / Baths | Price | Details |
|---|---|---|---|---|---|

|
#41
Middletown Ave
Northford, CT 06472
|
1,615 sq. feet
|
3 baths 3 beds |
show details | |

|
#42
Fairview St
Portland, CT 06480
|
1,460 sq. feet
|
1 baths 4 beds |
show details | |

|
#43
Barry Ct
Middletown, CT 06457
|
912 sq. feet
|
1 baths 2 beds |
show details | |

|
#44
Saner Rd
Marlborough, CT 06447
|
2,386 sq. feet
|
2 baths 4 beds |
show details | |

|
#45
Tuccitto Rd
Portland, CT 06480
|
816 sq. feet
|
1 baths 2 beds |
show details | |

|
#46
Frisbie St
Middletown, CT 06457
|
1,296 sq. feet
|
2 baths 3 beds |
show details | |

|
#47
Lincoln Rd
Waterford, CT 06385
|
1,132 sq. feet
|
1 baths 3 beds |
show details | |

|
#48
Beech St
North Branford, CT 06471
|
1,288 sq. feet
|
2 baths 3 beds |
show details | |

|
#49
Hoadley Creek Cir
Guilford, CT 06437
|
1,598 sq. feet
|
2 baths 3 beds |
show details | |

|
Check over 1 million property listings on Foreclosure.com!
|
browse all offers | |||


Household type by relationship:
Households: 160,591- In family households: 131,621 (30,370 male householders, 13,373 female householders)
34,891 spouses, 44,052 children (41,443 natural, 1,059 adopted, 1,550 stepchildren), 1,876 grandchildren, 1,018 brothers or sisters, 1,359 parents, foster children, 1,032 other relatives, 2,795 non-relatives
- In nonfamily households: 28,970 (10,508 male householders (8,006 living alone)), 12,951 female householders (10,912 living alone)), 5,511 nonrelatives
- In group quarters: 5,085 (1,881 institutionalized population)
26,910 married couples with children.
6,210 single-parent households (1,312 men, 4,898 women).
93.5% of residents of Deep River speak English at home.
2.2% of residents speak Spanish at home (79% speak English very well, 13% speak English well, 7% speak English not well).
4.2% of residents speak other Indo-European language at home (67% speak English very well, 25% speak English well, 8% speak English not well).
0.1% of residents speak other language at home (100% speak English very well).
Foreign born population: 113 (2.2%)
(80.5% of them are naturalized citizens)
| Here: | 6.8 |
| State: | 6.5 |
| Here: | 3.2 |
| State: | 4.0 |
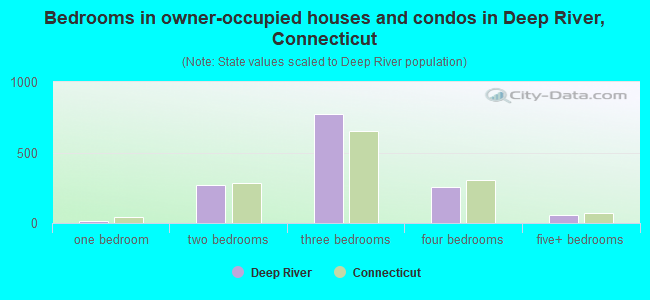
- Bedrooms in owner-occupied houses and condos in Deep River, Connecticut
- 0no bedroom
- 131 bedroom
- 2692 bedrooms
- 7713 bedrooms
- 2524 bedrooms
- 585+ bedrooms
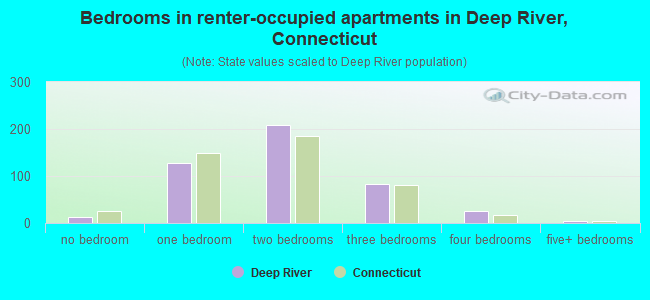
- Bedrooms in renter-occupied apartments in Deep River, Connecticut
- 12no bedroom
- 1271 bedroom
- 2092 bedrooms
- 823 bedrooms
- 264 bedrooms
- 55+ bedrooms
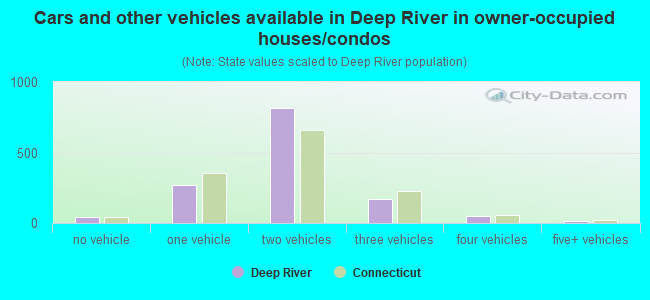
- Cars and other vehicles available in Deep River in owner-occupied houses/condos
- 41no vehicle
- 2711 vehicle
- 8172 vehicles
- 1703 vehicles
- 474 vehicles
- 175+ vehicles
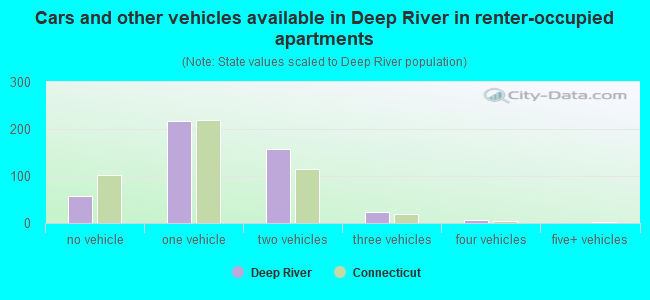
- Cars and other vehicles available in Deep River in renter-occupied apartments
- 58no vehicle
- 2161 vehicle
- 1572 vehicles
- 243 vehicles
- 64 vehicles
- 05+ vehicles
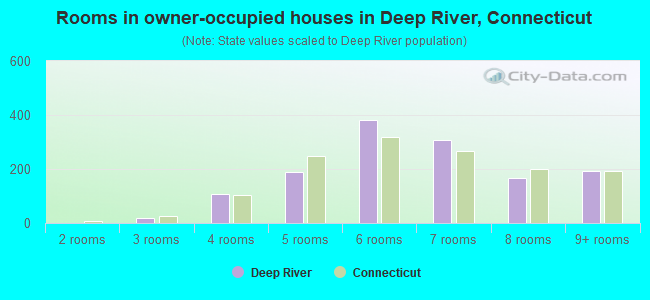
- Rooms in owner-occupied houses in Deep River, Connecticut
- 01 room
- 02 rooms
- 203 rooms
- 1084 rooms
- 1885 rooms
- 3826 rooms
- 3097 rooms
- 1658 rooms
- 1919+ rooms
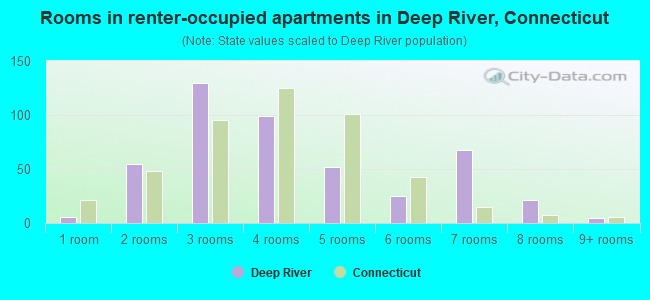
- Rooms in renter-occupied apartments in Deep River, Connecticut
- 61 room
- 552 rooms
- 1303 rooms
- 994 rooms
- 525 rooms
- 256 rooms
- 687 rooms
- 218 rooms
- 59+ rooms
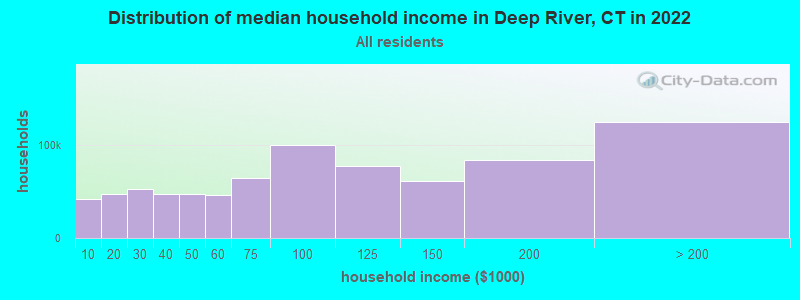
Deep River, CT household income distribution

- 37,278Less than $10,000
- 42,102$10,000 to $19,999
- 47,583$20,000 to $29,999
- 42,600$30,000 to $39,999
- 42,389$40,000 to $49,999
- 41,502$50,000 to $59,999
- 57,975$60,000 to $74,999
- 90,618$75,000 to $99,999
- 70,384$100,000 to $124,999
- 56,202$125,000 to $149,999
- 76,829$150,000 to $199,999
- 114,427$200,000 or more
Percentage of workers working in this county: 66.7%
Number of people working at home: 450 (17.0% of all workers)
Travel time to work (commute)
- Less than 5 minutes: 44
- 5 to 9 minutes: 279
- 10 to 14 minutes: 508
- 15 to 19 minutes: 318
- 20 to 24 minutes: 223
- 25 to 29 minutes: 118
- 30 to 34 minutes: 197
- 35 to 39 minutes: 80
- 40 to 44 minutes: 102
- 45 to 59 minutes: 221
- 60 to 89 minutes: 104
- 90 or more minutes: 32
Means of transportation to work:
- Drove a car alone: 1,982 (85.3%)
- Carpooled: 168 (7.2%)
- Railroad: 12 (0.5%)
- Taxi: 22 (0.9%)
- Motorcycle: 12 (0.5%)
- Walked: 23 (1.0%)
- Other means: 7 (0.3%)
- Worked at home: 97 (4.2%)
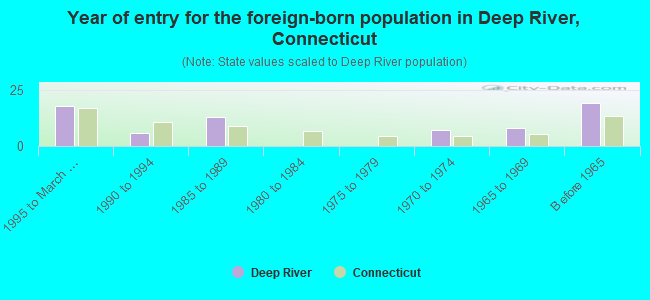
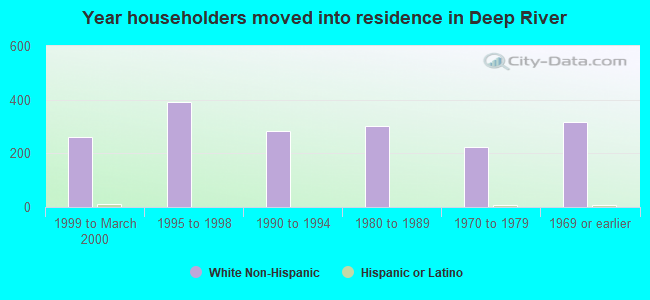
- Year of entry for the foreign-born population in Deep River, Connecticut
- 181995 to March 2000
- 61990 to 1994
- 131985 to 1989
- 01980 to 1984
- 01975 to 1979
- 71970 to 1974
- 81965 to 1969
- 19Before 1965
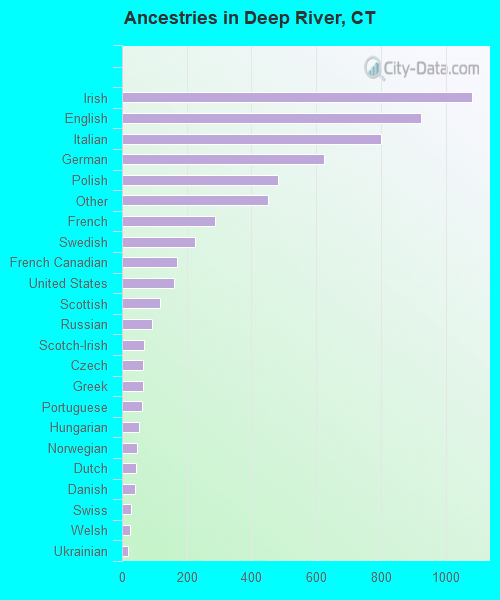
First ancestries reported:
- Irish: 1,080 (18.2%)
- English: 923 (15.5%)
- Italian: 800 (13.5%)
- German: 623 (10.5%)
- Polish: 482 (8.1%)
- Other: 452 (7.6%)
- French: 286 (4.8%)
- Swedish: 225 (3.8%)
- French Canadian: 169 (2.8%)
- United States: 160 (2.7%)
- Scottish: 117 (2.0%)
- Russian: 92 (1.5%)
- Scotch-Irish: 68 (1.1%)
- Czech: 66 (1.1%)
- Greek: 65 (1.1%)
- Portuguese: 63 (1.1%)
- Hungarian: 53 (0.9%)
- Norwegian: 46 (0.8%)
- Dutch: 43 (0.7%)
- Danish: 41 (0.7%)
- Swiss: 29 (0.5%)
- Welsh: 24 (0.4%)
- Ukrainian: 20 (0.3%)
- Lithuanian: 7 (0.1%)
- Slovak: 7 (0.1%)
Most common places of birth for foreign-born residents (%):
| Deep River: | 25.4% (18) |
| Connecticut: | 0.6% (2,313) |
| Deep River: | 11.3% (8) |
| Connecticut: | 3.1% (11,432) |
| Deep River: | 9.9% (7) |
| Connecticut: | 0.4% (1,303) |
| Deep River: | 9.9% (7) |
| Connecticut: | 7.0% (26,023) |
| Deep River: | 9.9% (7) |
| Connecticut: | 0.7% (2,646) |
| Deep River: | 9.9% (7) |
| Connecticut: | 2.8% (10,379) |
| Deep River: | 8.5% (6) |
| Connecticut: | 0.1% (291) |
| Deep River: | 8.5% (6) |
| Connecticut: | 3.6% (13,282) |
| Deep River: | 7.0% (5) |
| Connecticut: | 1.1% (3,919) |
Place of birth for U.S.-born residents:
- This state: 3,178
- Other state: 1,328
- Northeast: 831
- Midwest: 205
- South: 234
- West: 58
60% of Deep River residents lived in the same house 5 years ago.
Out of people who lived in different houses, 60% lived in this county.
Out of people who lived in different counties, 64% lived in Connecticut.
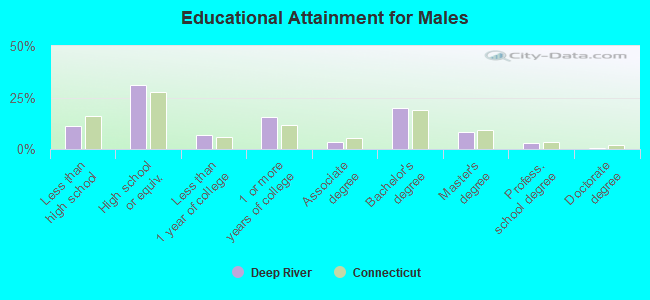
Education attainment for males 25 years and older:
- No schooling: 0
- Nursery to 4th grade: 0
- 5th and 6th grade: 0
- 7th and 8th grade: 10
- 9th grade: 25
- 10th grade: 64
- 11th grade: 33
- 12th grade, no diploma: 45
- High school graduate (or equivalency): 498
- Less than 1 year of college: 108
- Some college more than 1 year, no degree: 249
- Associate degree: 58
- Bachelor's degree: 320
- Master's degree: 133
- Professional school degree: 48
- Doctorate degree: 7
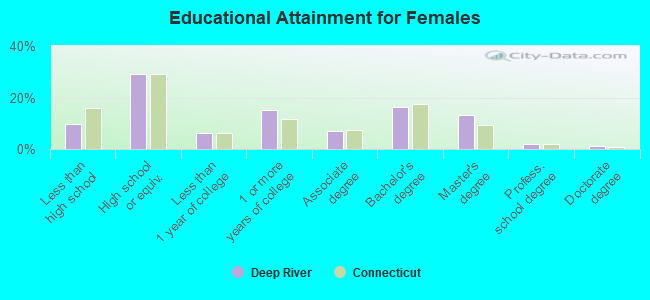
Education attainment for females 25 years and older:
- No schooling: 0
- Nursery to 4th grade: 0
- 5th and 6th grade: 7
- 7th and 8th grade: 36
- 9th grade: 20
- 10th grade: 33
- 11th grade: 27
- 12th grade, no diploma: 38
- High school graduate (or equivalency): 479
- Less than 1 year of college: 101
- Some college more than 1 year, no degree: 250
- Associate degree: 114
- Bachelor's degree: 271
- Master's degree: 217
- Professional school degree: 33
- Doctorate degree: 20
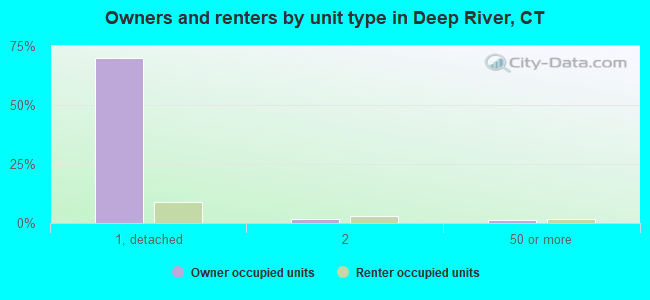
Housing units in structures:
- One, detached: 1,497
- One, attached: 35
- Two: 83
- 3 or 4: 104
- 5 to 9: 49
- 10 to 19: 56
- 20 to 49: 24
- 50 or more: 50
- Mobile homes: 12
Median worth of mobile homes: $51,899
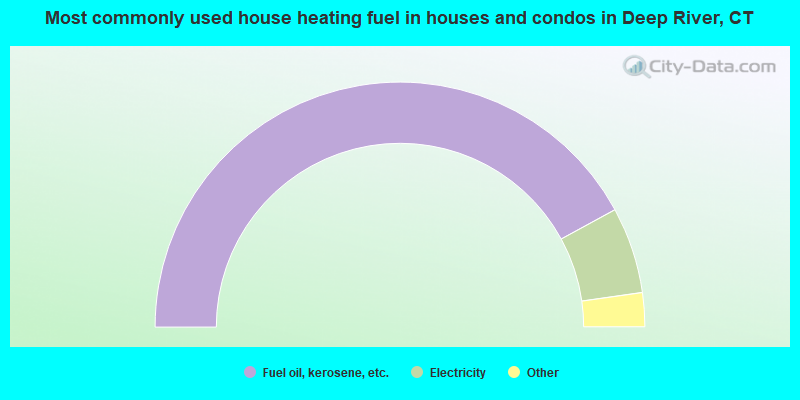
- 84.2%Fuel oil, kerosene, etc.
- 11.4%Electricity
- 2.9%Wood
- 1.5%Bottled, tank, or LP gas
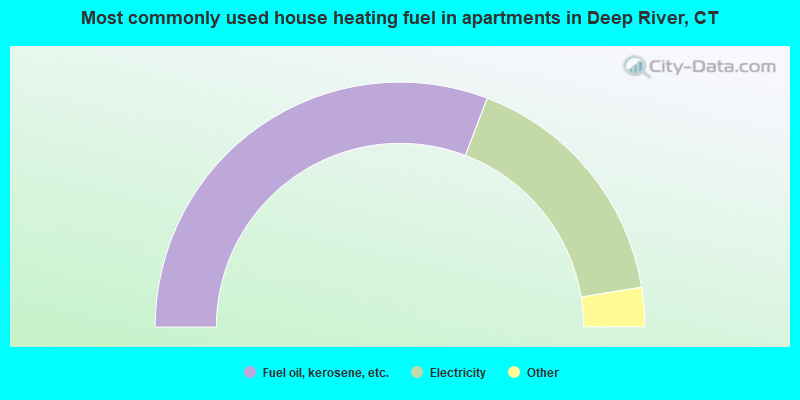
- 61.6%Fuel oil, kerosene, etc.
- 33.2%Electricity
- 3.9%Bottled, tank, or LP gas
- 1.3%Utility gas
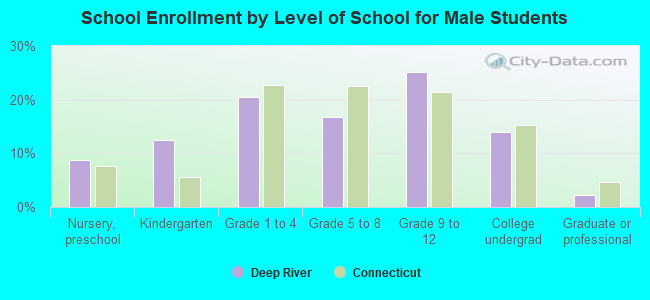
Private vs. public school enrollment:
| Here: | 10.8% |
| Connecticut: | 9.9% |
| Here: | 3.6% |
| Connecticut: | 11.0% |
| Here: | 41.8% |
| Connecticut: | 33.4% |