Diboll, TX (Texas) Houses and Residents
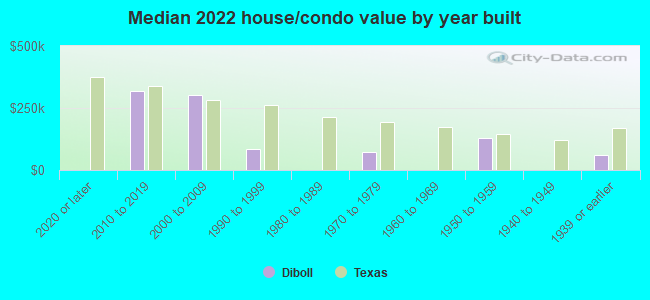
| Diboll: | $109,471 |
| Texas: | $275,400 |
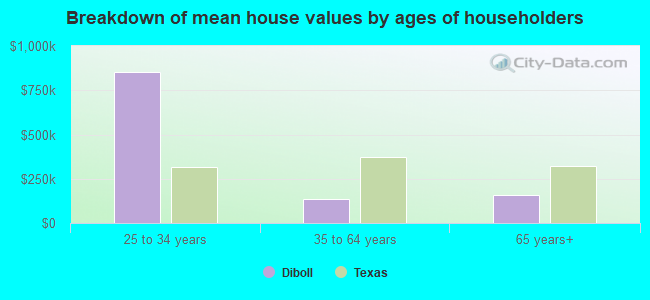
Mean price in 2022:
Detached houses: $137,895
Here: $137,895 State: $369,058 Mobile homes: $46,825
Here: $46,825 State: $124,413
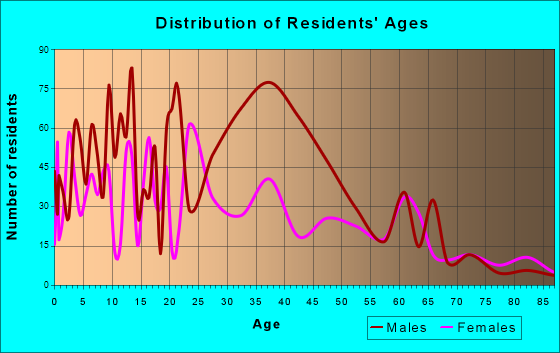
Total population: 5,378 (All urban)
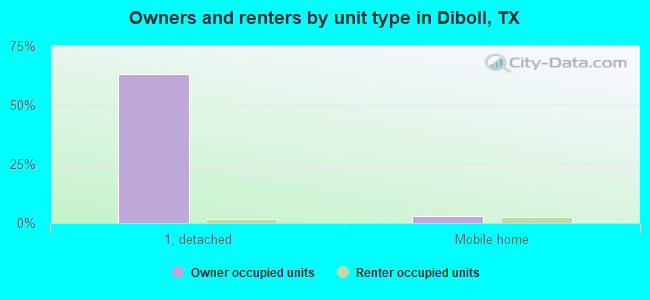
Houses: 1,645 (1,474 occupied: 1,086 owner occupied, 494 renter occupied)
| % of renters here: | 31% |
| State: | 38% |
Housing density: 343 houses/condos per square mile
Median price asked for vacant for-sale houses and condos in 2022 in this county: $326,081.
Median gross rent in Diboll, TX in 2022: $537
Housing units in Diboll with a mortgage: 350 (14 second mortgage, 0 home equity loan, 15 both second mortgage and home equity loan)
Houses without a mortgage: 0
Median household income for houses/condos with a mortgage: $60,664
Median household income for apartments without a mortgage: $63,939
Median monthly housing costs: $567
Compare current foreclosures near Diboll, TX:
| Photo | Address | Area | Beds / Baths | Price | Details |
|---|---|---|---|---|---|

|
#1
Tidwell Rd
Diboll, TX 75941
|
1,660 sq. feet
|
- baths - beds |
show details | |

|
#2
Fm 2497
Diboll, TX 75941
|
- sq. feet
|
- baths - beds |
show details | |

|
#3
Fm 2108
Diboll, TX 75941
|
- sq. feet
|
- baths - beds |
show details | |

|
#4
S Temple Dr
Diboll, TX 75941
|
1,434 sq. feet
|
- baths - beds |
show details | |

|
#5
Nelson Dr
Diboll, TX 75941
|
888 sq. feet
|
- baths - beds |
show details | |

|
#6
Holubec St
Diboll, TX 75941
|
- sq. feet
|
- baths - beds |
show details | |

|
#7
Rutland St
Diboll, TX 75941
|
- sq. feet
|
- baths - beds |
show details | |

|
#8
N Hines St
Diboll, TX 75941
|
1,961 sq. feet
|
- baths - beds |
show details | |

|
#9
Weeks St
Lufkin, TX 75904
|
1,344 sq. feet
|
2 baths 4 beds |
show details | |

|
#10
Garner Ave
Lufkin, TX 75904
|
920 sq. feet
|
- baths - beds |
show details |
| Photo | Address | Area | Beds / Baths | Price | Details |
|---|---|---|---|---|---|

|
#11
Kay Currie Rd
Huntington, TX 75949
|
1,178 sq. feet
|
- baths - beds |
show details | |

|
#12
State Highway 103 W
Lufkin, TX 75904
|
1,311 sq. feet
|
- baths - beds |
show details | |

|
#13
Blackburn Switch Rd
Lufkin, TX 75904
|
1,216 sq. feet
|
- baths - beds |
show details | |

|
#14
Bluebonnet Cir Apt 52
Corrigan, TX 75939
|
- sq. feet
|
- baths - beds |
show details | |

|
#15
Us Highway 69 N
Lufkin, TX 75904
|
- sq. feet
|
- baths - beds |
show details | |

|
#16
Atkinson Dr
Lufkin, TX 75901
|
- sq. feet
|
- baths - beds |
show details | |

|
#17
Pahal Rd
Huntington, TX 75949
|
1,616 sq. feet
|
- baths - beds |
show details | |

|
#18
Mccarty Rd
Lufkin, TX 75904
|
1,657 sq. feet
|
- baths - beds |
show details | |

|
#19
Corrigan Heights
Corrigan, TX 75939
|
- sq. feet
|
- baths - beds |
show details | |

|
#20
Chambliss Rd
Lufkin, TX 75901
|
1,568 sq. feet
|
- baths - beds |
show details |
| Photo | Address | Area | Beds / Baths | Price | Details |
|---|---|---|---|---|---|

|
#21
N Princess Dr
Corrigan, TX 75939
|
- sq. feet
|
- baths - beds |
show details | |

|
#22
Freeman St
Lufkin, TX 75901
|
676 sq. feet
|
- baths - beds |
show details | |

|
#23
Cathy Lou Ln
Corrigan, TX 75939
|
- sq. feet
|
- baths - beds |
show details | |

|
#24
Kay Currie Rd
Huntington, TX 75949
|
- sq. feet
|
- baths - beds |
show details | |

|
#25
Thigpen Rd
Pollok, TX 75969
|
- sq. feet
|
- baths - beds |
show details | |

|
#26
Lancewood Cir
Lufkin, TX 75904
|
1,752 sq. feet
|
- baths - beds |
show details | |

|
#27
Ridgewood St
Lufkin, TX 75904
|
1,428 sq. feet
|
- baths - beds |
show details | |

|
#28
Dogwood Cir
Corrigan, TX 75939
|
- sq. feet
|
- baths - beds |
show details | |

|
#29
Rainwood Dr
Lufkin, TX 75901
|
1,242 sq. feet
|
- baths - beds |
show details | |

|
#30
Us Highway 69 N
Lufkin, TX 75904
|
2,092 sq. feet
|
- baths - beds |
show details |
| Photo | Address | Area | Beds / Baths | Price | Details |
|---|---|---|---|---|---|

|
#31
Coach Redd Rd
Lufkin, TX 75901
|
2,077 sq. feet
|
- baths - beds |
show details | |

|
#32
Greg Rudd Rd
Lufkin, TX 75901
|
912 sq. feet
|
- baths - beds |
show details | |

|
#33
Fm 2021
Lufkin, TX 75904
|
1,120 sq. feet
|
- baths - beds |
show details | |

|
#34
Rhodes St
Huntington, TX 75949
|
- sq. feet
|
- baths - beds |
show details | |

|
#35
Fm 2021
Lufkin, TX 75904
|
860 sq. feet
|
- baths - beds |
show details | |

|
#36
Cumming St
Lufkin, TX 75904
|
1,064 sq. feet
|
- baths - beds |
show details | |

|
#37
Hudnall Rd
Huntington, TX 75949
|
1,440 sq. feet
|
- baths - beds |
show details | |

|
#38
Ethel Lewis Rd
Lufkin, TX 75904
|
- sq. feet
|
- baths - beds |
show details | |

|
#39
Smallwood Rd
Lufkin, TX 75904
|
- sq. feet
|
- baths - beds |
show details | |

|
#40
Cross Timbers St
Lufkin, TX 75904
|
1,705 sq. feet
|
- baths - beds |
show details |
| Photo | Address | Area | Beds / Baths | Price | Details |
|---|---|---|---|---|---|

|
#41
Charlie Porter Rd
Huntington, TX 75949
|
- sq. feet
|
- baths - beds |
show details | |

|
#42
Phil Jackson Road
Lufkin, TX 75904
|
- sq. feet
|
- baths - beds |
show details | |

|
#43
W Walnut St
Huntington, TX 75949
|
1,381 sq. feet
|
- baths - beds |
show details | |

|
#44
Oak Cir
Corrigan, TX 75939
|
1,748 sq. feet
|
- baths - beds |
show details | |

|
#45
Cross Timbers St
Lufkin, TX 75904
|
- sq. feet
|
- baths - beds |
show details | |

|
#46
Sawmill Ln
Lufkin, TX 75904
|
- sq. feet
|
- baths - beds |
show details | |

|
#47
Washington St
Lufkin, TX 75904
|
944 sq. feet
|
- baths - beds |
show details | |

|
#48
Hickory Hill Dr
Lufkin, TX 75901
|
1,296 sq. feet
|
- baths - beds |
show details | |

|
#49
Crosswood St
Lufkin, TX 75904
|
1,514 sq. feet
|
- baths - beds |
show details | |

|
Check over 1 million property listings on Foreclosure.com!
|
browse all offers | |||

Latest news about housing in Diboll, TX collected exclusively by city-data.com from local newspapers, TV, and radio stations


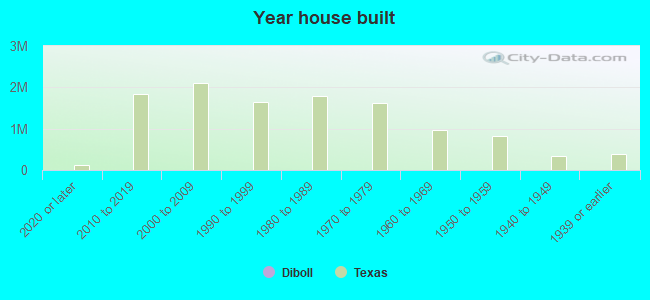
Median year apartment built: 1979
Household type by relationship:
Households: 4,571- Male householders: 518 (60 living alone), Female householders: 946 (73 living alone)
568 spouses (568 opposite-sex spouses), 0 unmarried partners, (0 opposite-sex unmarried partners), 1,593 children (1,593 natural, 0 adopted, 0 stepchildren), 350 grandchildren, 0 brothers or sisters, 54 parents, 0 foster children, 13 other relatives, 70 non-relatives
- In group quarters: 456
Size of family households: 713 2-persons, 313 3-persons, 166 4-persons, 77 5-persons, 63 6-persons, 20 7-or-more-persons.
Size of nonfamily households: 151 1-person, 31 2-persons.
388 married couples with children.
644 single-parent households (0 men, 644 women).
65.4% of residents of Diboll speak English at home.
33.7% of residents speak Spanish at home (66% speak English very well, 24% speak English well, 8% speak English not well, 2% don't speak English at all).
0.3% of residents speak other Indo-European language at home (100% speak English very well).
0.2% of residents speak Asian or Pacific Island language at home (100% speak English well).
Foreign born population: 467 (10.2%)
(76.2% of them are naturalized citizens)
| Here: | 6.0 |
| State: | 6.3 |
| Here: | 4.0 |
| State: | 4.0 |
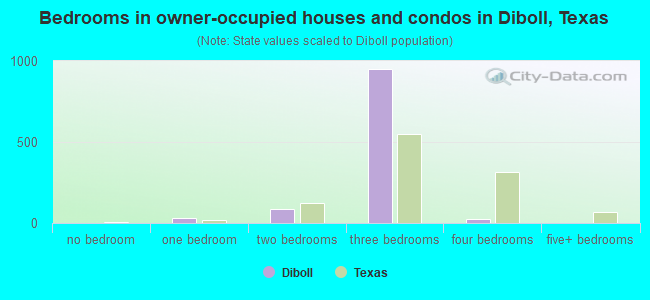
- Bedrooms in owner-occupied houses and condos in Diboll, Texas
- 0no bedroom
- 291 bedroom
- 872 bedrooms
- 9493 bedrooms
- 224 bedrooms
- 05+ bedrooms
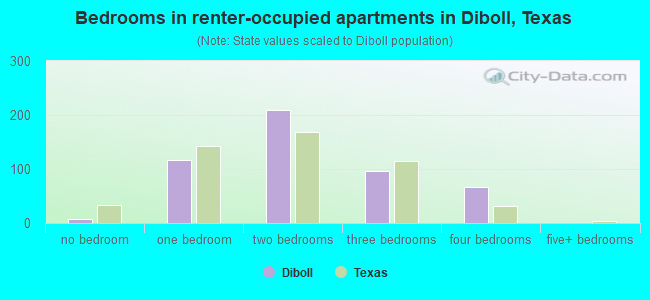
- Bedrooms in renter-occupied apartments in Diboll, Texas
- 7no bedroom
- 1161 bedroom
- 2092 bedrooms
- 973 bedrooms
- 664 bedrooms
- 05+ bedrooms
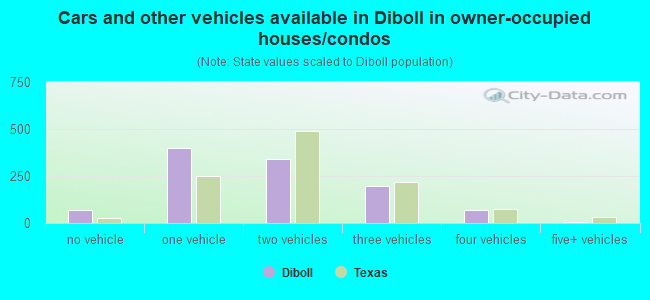
- Cars and other vehicles available in Diboll in owner-occupied houses/condos
- 69no vehicle
- 4001 vehicle
- 3432 vehicles
- 1993 vehicles
- 714 vehicles
- 45+ vehicles
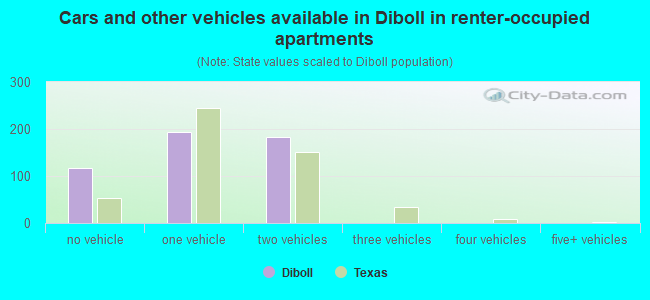
- Cars and other vehicles available in Diboll in renter-occupied apartments
- 118no vehicle
- 1931 vehicle
- 1832 vehicles
- 03 vehicles
- 04 vehicles
- 05+ vehicles
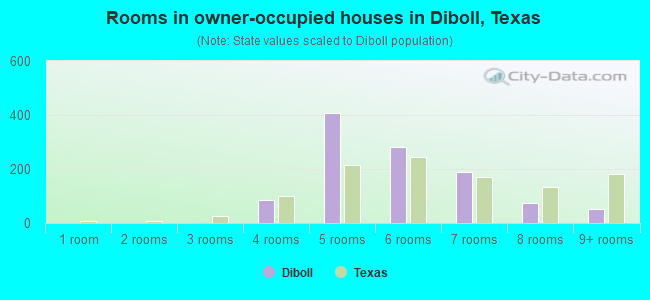
- Rooms in owner-occupied houses in Diboll, Texas
- 01 room
- 02 rooms
- 03 rooms
- 844 rooms
- 4075 rooms
- 2816 rooms
- 1897 rooms
- 738 rooms
- 539+ rooms
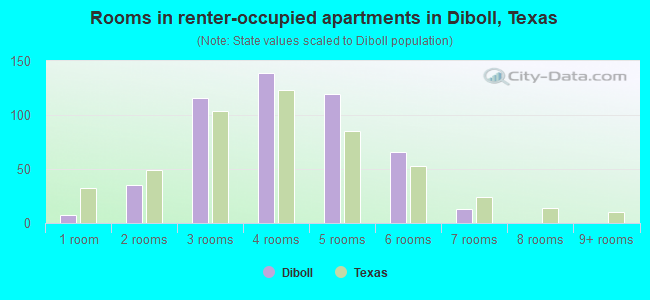
- Rooms in renter-occupied apartments in Diboll, Texas
- 71 room
- 352 rooms
- 1163 rooms
- 1394 rooms
- 1195 rooms
- 666 rooms
- 137 rooms
- 08 rooms
- 09+ rooms
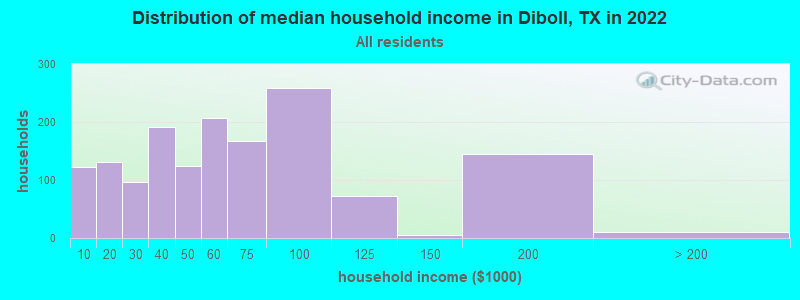
Diboll, TX household income distribution

- 122Less than $10,000
- 131$10,000 to $19,999
- 97$20,000 to $29,999
- 191$30,000 to $39,999
- 125$40,000 to $49,999
- 207$50,000 to $59,999
- 167$60,000 to $74,999
- 258$75,000 to $99,999
- 72$100,000 to $124,999
- 6$125,000 to $149,999
- 144$150,000 to $199,999
- 11$200,000 or more
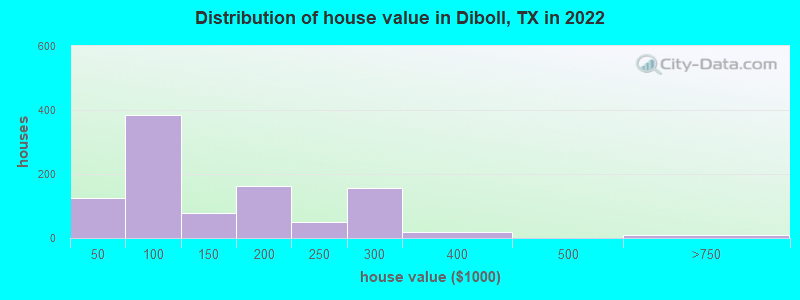
Home value of owner - occupied houses in 2022 in Diboll, TX
-
- 19Less than $10,000
- 5$10,000 to $14,999
- 11$25,000 to $29,999
- 46$30,000 to $34,999
- 41$40,000 to $49,999
- 92$50,000 to $59,999
- 85$60,000 to $69,999
- 39$70,000 to $79,999
- 85$80,000 to $89,999
- 39$90,000 to $99,999
- 30$100,000 to $124,999
- 48$125,000 to $149,999
- 70$150,000 to $174,999
- 91$175,000 to $199,999
- 50$200,000 to $249,999
- 154$250,000 to $299,999
- 17$300,000 to $399,999
- 8$500,000 to $749,999
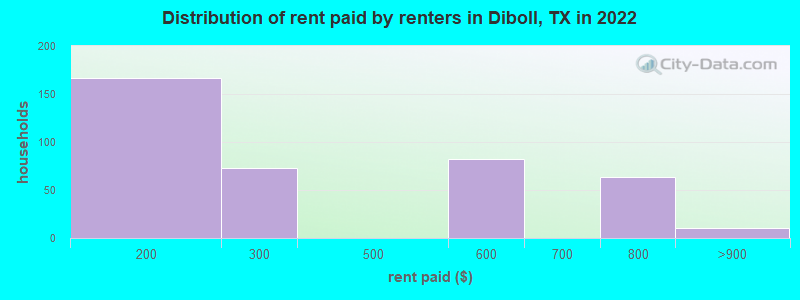
Rent paid by renters in 2022 in Diboll, TX
-
- 80$100 to $149
- 86$150 to $199
- 39$200 to $249
- 34$250 to $299
- 82$500 to $549
- 49$700 to $749
- 14$750 to $799
- 9$800 to $899
Percentage of workers working in this county: 79.7%
Number of people working at home: 70 (4.1% of all workers)
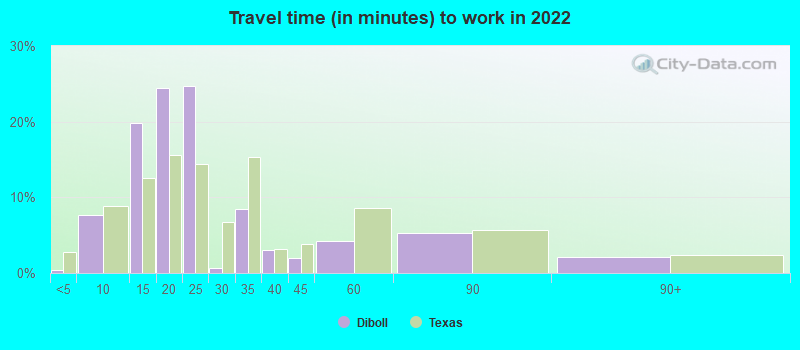
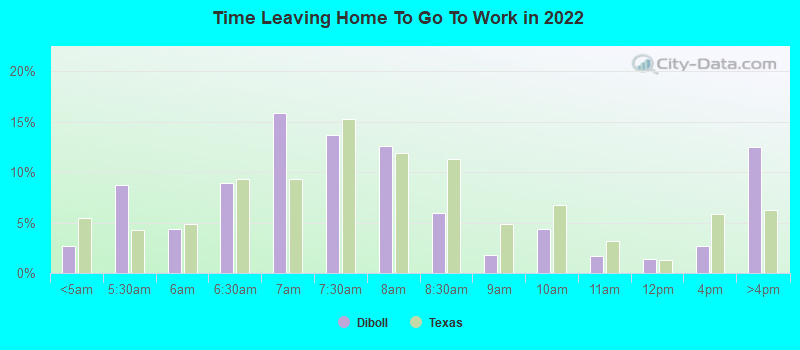
Travel time to work (commute)
- Less than 5 minutes: 6
- 5 to 9 minutes: 115
- 10 to 14 minutes: 539
- 15 to 19 minutes: 192
- 20 to 24 minutes: 368
- 25 to 29 minutes: 113
- 30 to 34 minutes: 160
- 35 to 39 minutes: 204
- 40 to 44 minutes: 0
- 45 to 59 minutes: 19
- 60 to 89 minutes: 0
- 90 or more minutes: 0
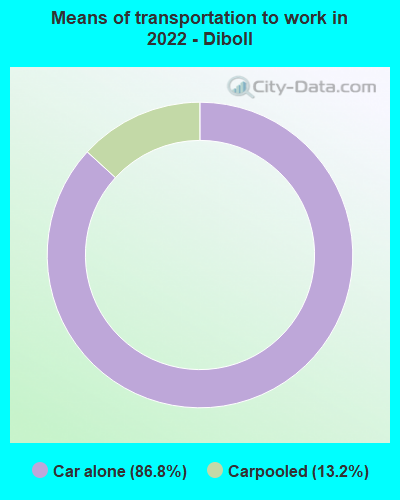
Means of transportation to work:
- Drove a car alone: 1,647 (80.1%)
- Carpooled: 272 (13.2%)
- Worked at home: 70 (3.4%)
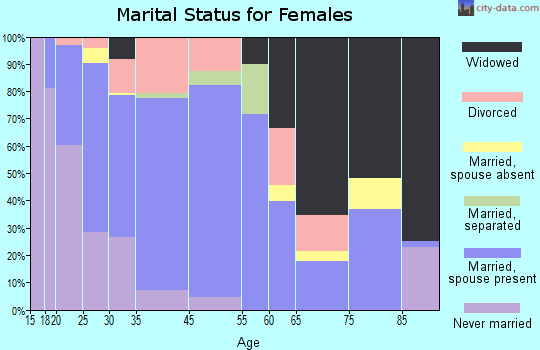
- Unemployment by race in 2022
- Unemployment rate for White non-Hispanic residents
- 28.7%Females
- Unemployment rate for Black residents
- 6.1%Females
- Unemployment rate for other race residents
- 40.5%Males
- Unemployment rate for Hispanic or Latino residents
- 5.3%Males
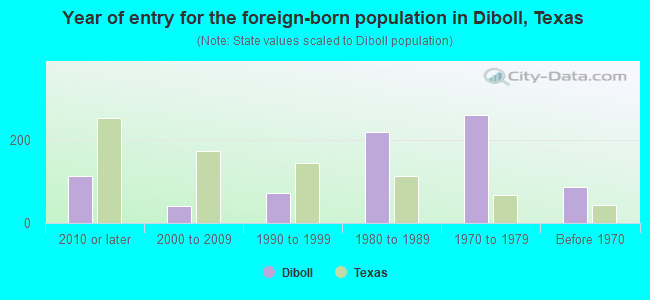
- Year of entry for the foreign-born population in Diboll, Texas
- 1132010 or later
- 422000 to 2009
- 731990 to 1999
- 2211980 to 1989
- 2611970 to 1979
- 87Before 1970
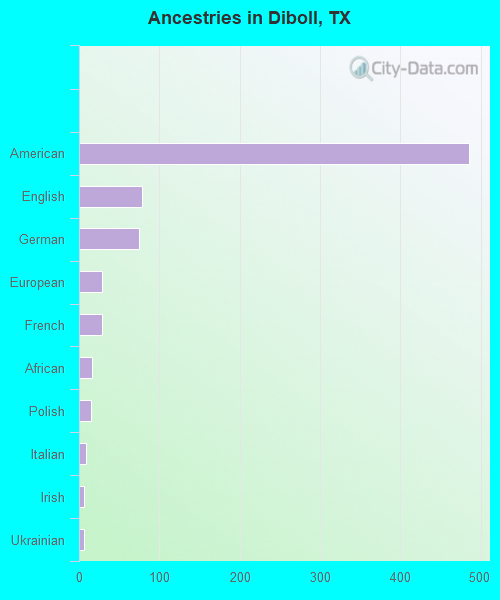
First ancestries reported:
- American: 486 (16.0%)
- English: 78 (2.6%)
- German: 75 (2.5%)
- European: 29 (1.0%)
- French: 29 (1.0%)
- African: 16 (0.5%)
- Polish: 15 (0.5%)
- Italian: 9 (0.3%)
- Irish: 6 (0.2%)
- Ukrainian: 6 (0.2%)
- Scotch-Irish: 3 (0.10%)
- British: 1 (0.03%)
Most common places of birth for foreign-born residents (%):
| Diboll: | 86.5% (415) |
| Texas: | 48.4% (2,411,723) |
| Diboll: | 5.0% (24) |
| Texas: | 6.1% (306,347) |
| Diboll: | 2.5% (12) |
| Texas: | 3.0% (147,182) |
Place of birth for U.S.-born residents:
- This state: 3,785
- Other state: 317
- Northeast: 0
- Midwest: 45
- South: 233
- West: 45
84.7% of Diboll residents lived in the same house 1 years ago.
Out of people who lived in different houses, 22.8% lived in this county.
Out of people who lived in different counties, 100.0% lived in Texas.
| Diboll: | 84.7% |
| State average: | 85.7% |
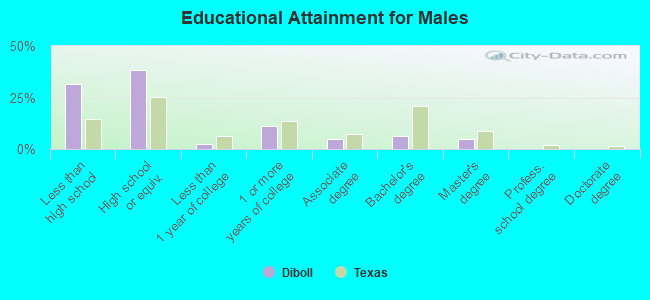
Education attainment for males 25 years and older:
- No schooling: 63
- Nursery to 4th grade: 40
- 5th and 6th grade: 115
- 7th and 8th grade: 31
- 9th grade: 11
- 10th grade: 124
- 11th grade: 87
- 12th grade, no diploma: 0
- High school graduate (or equivalency): 571
- Less than 1 year of college: 35
- Some college more than 1 year, no degree: 168
- Associate degree: 70
- Bachelor's degree: 93
- Master's degree: 73
- Professional school degree: 3
- Doctorate degree: 0
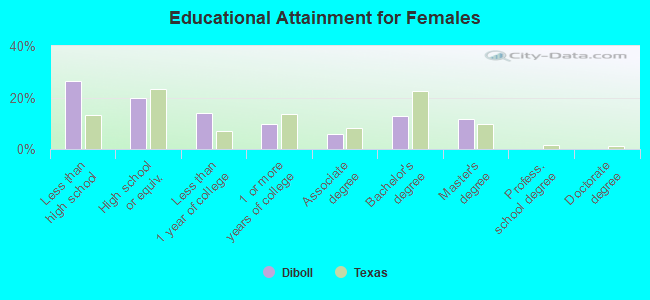
Education attainment for females 25 years and older:
- No schooling: 84
- Nursery to 4th grade: 15
- 5th and 6th grade: 26
- 7th and 8th grade: 28
- 9th grade: 90
- 10th grade: 9
- 11th grade: 12
- 12th grade, no diploma: 122
- High school graduate (or equivalency): 292
- Less than 1 year of college: 206
- Some college more than 1 year, no degree: 142
- Associate degree: 85
- Bachelor's degree: 189
- Master's degree: 170
- Professional school degree: 0
- Doctorate degree: 0
Housing units in structures:
- One, detached: 1,162
- One, attached: 58
- Two: 310
- 5 to 9: 24
- 10 to 19: 6
- 20 to 49: 6
- Mobile homes: 76
Housing units lacking complete kitchen facilities in 2022: 2.5%
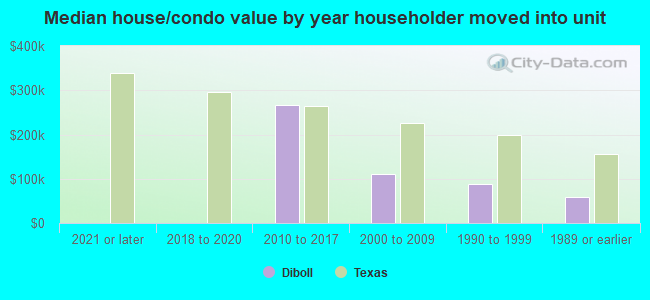
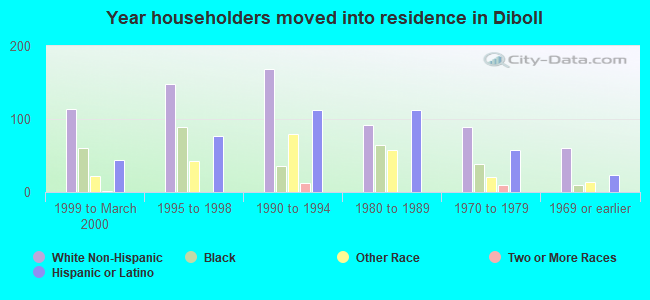
House/condo owner moved in on average 18 years ago
Renter moved in on average 5 years ago
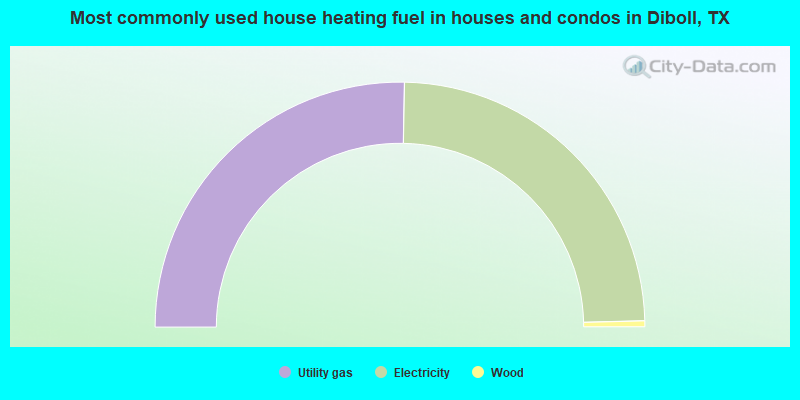
- 50.6%Utility gas
- 48.6%Electricity
- 0.8%Wood
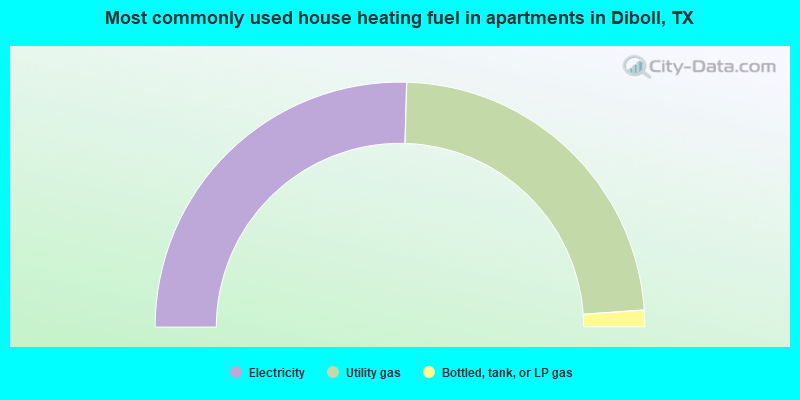
- 50.9%Electricity
- 46.9%Utility gas
- 2.2%Bottled, tank, or LP gas
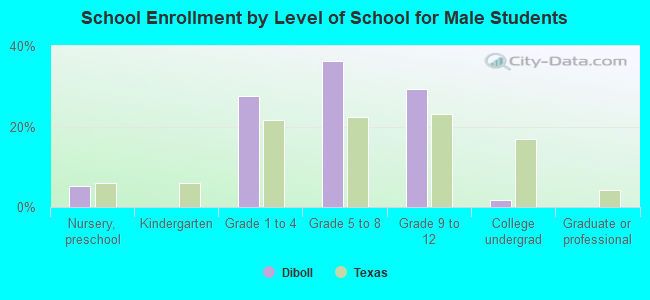
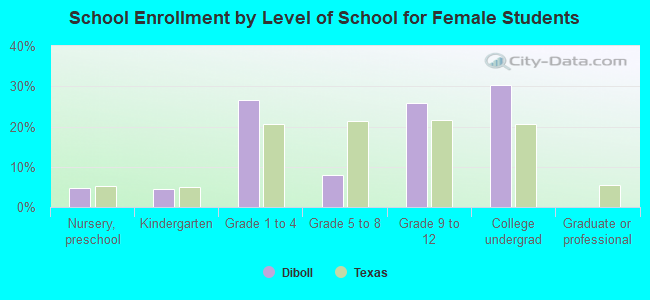
Private vs. public school enrollment:
| Here: | 0.0% |
| Texas: | 8.8% |
| Here: | 1.4% |
| Texas: | 8.0% |
| Here: | 11.4% |
| Texas: | 16.2% |