Housing density: 1,304 houses/condos per square mile
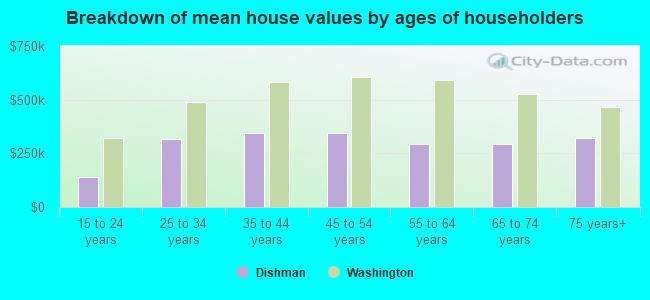
Median price asked for vacant for-sale houses and condos in 2022 in this county: $398,010.
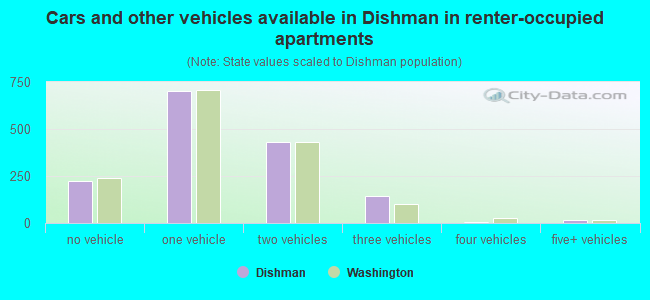
Median contract rent in 2022: $1,089 (lower quartile is $872, upper quartile is $1,399)
Median rent asked for vacant for-rent units in 2022: $1,148
Median gross rent in Dishman, WA in 2022: $1,244
Housing units in Dishman with a mortgage: 1,498 (218 second mortgage, 164 home equity loan, 23 both second mortgage and home equity loan) Houses without a mortgage: 697
In family households: 366,690 (83,287 male householders, 34,925 female householders)
88,280 spouses, 127,815 children (116,710 natural, 4,033 adopted, 7,072 stepchildren), 7,024 grandchildren, 3,522 brothers or sisters, 2,875 parents, foster children, 3,766 other relatives, 12,897 non-relatives
In nonfamily households: 89,839 (32,533 male householders (24,107 living alone)), 36,422 female householders (29,515 living alone)), 20,884 nonrelatives
In group quarters: 14,692 (5,666 institutionalized population)
72,314 married couples with children.
26,546 single-parent households (6,454 men, 20,092 women).
95.4% of residents of Dishman speak English at home.
1.3% of residents speak Spanish at home (50% speak English very well, 37% speak English well, 13% speak English not well).
1.8% of residents speak other Indo-European language at home (52% speak English very well, 15% speak English well, 34% speak English not well).
1.5% of residents speak Asian or Pacific Island language at home (65% speak English very well, 18% speak English well, 17% speak English not well).
Foreign born population: 364 (2.8%)
(84.6% of them are naturalized citizens)
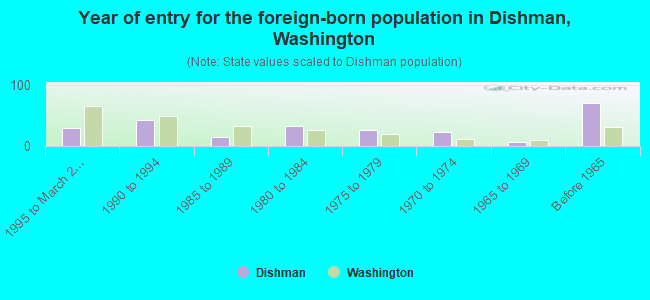
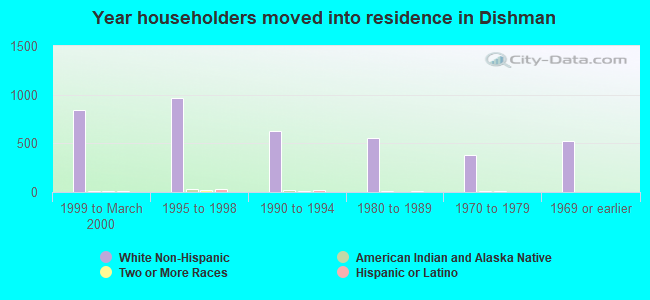
Year of entry for the foreign-born population in Dishman, Washington
291995 to March 2000
431990 to 1994
141985 to 1989
331980 to 1984
271975 to 1979
231970 to 1974
71965 to 1969
70Before 1965
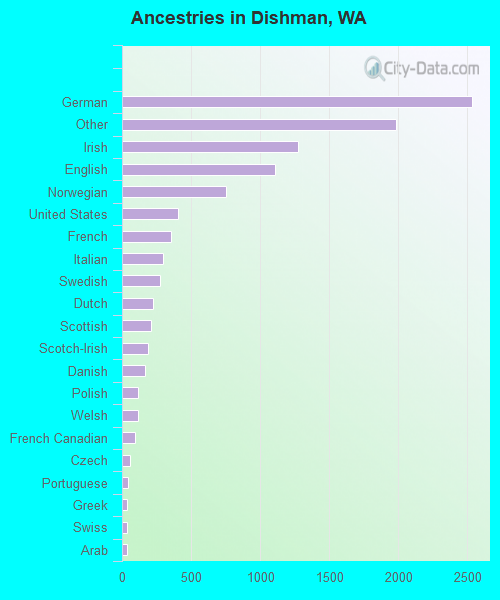
First ancestries reported:
German: 2,532 (24.4%)
Other: 1,985 (19.2%)
Irish: 1,273 (12.3%)
English: 1,105 (10.7%)
Norwegian: 753 (7.3%)
United States: 406 (3.9%)
French: 358 (3.5%)
Italian: 297 (2.9%)
Swedish: 275 (2.7%)
Dutch: 225 (2.2%)
Scottish: 207 (2.0%)
Scotch-Irish: 185 (1.8%)
Danish: 168 (1.6%)
Polish: 119 (1.1%)
Welsh: 115 (1.1%)
French Canadian: 92 (0.9%)
Czech: 59 (0.6%)
Portuguese: 45 (0.4%)
Greek: 39 (0.4%)
Swiss: 38 (0.4%)
Arab: 36 (0.3%)
Russian: 20 (0.2%)
Hungarian: 7 (0.07%)
Ukrainian: 7 (0.07%)
Lithuanian: 6 (0.06%)
Slovak: 5 (0.05%)
Most common places of birth for foreign-born residents (%):
Canada
Dishman:
13.0% (32)
Washington:
7.7% (47,568)
Laos
Dishman:
12.2% (30)
Washington:
1.1% (6,542)
Other Eastern Europe
Dishman:
9.8% (24)
Washington:
1.2% (7,645)
United Kingdom
Dishman:
8.5% (21)
Washington:
3.3% (20,321)
Panama
Dishman:
8.5% (21)
Washington:
0.3% (1,548)
Romania
Dishman:
8.1% (20)
Washington:
0.7% (4,345)
Mexico
Dishman:
8.1% (20)
Washington:
24.1% (148,115)
Philippines
Dishman:
6.5% (16)
Washington:
7.6% (46,733)
Taiwan
Dishman:
5.3% (13)
Washington:
1.4% (8,353)
Other South Central Asia
Dishman:
4.1% (10)
Washington:
0.5% (2,889)
Thailand
Dishman:
4.1% (10)
Washington:
1.0% (6,294)
Argentina
Dishman:
3.7% (9)
Washington:
0.2% (1,049)
Other Western Europe
Dishman:
2.4% (6)
Washington:
0.3% (1,692)
Germany
Dishman:
2.0% (5)
Washington:
3.4% (21,167)
Korea
Dishman:
1.6% (4)
Washington:
6.2% (38,172)
Place of birth for U.S.-born residents:
This state: 5,209
Other state: 4,464
Northeast: 183
Midwest: 1,092
South: 422
West: 2,767
51% of Dishman residents lived in the same house 5 years ago. Out of people who lived in different houses, 72% lived in this county. Out of people who lived in different counties, 47% lived in Washington.
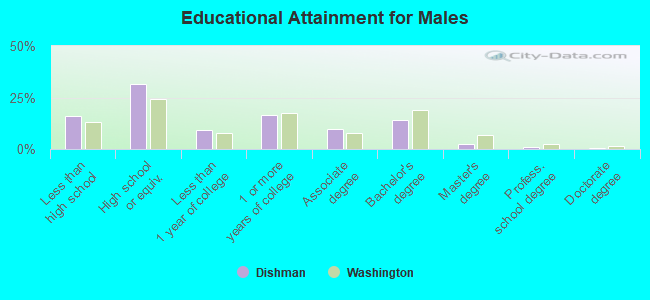
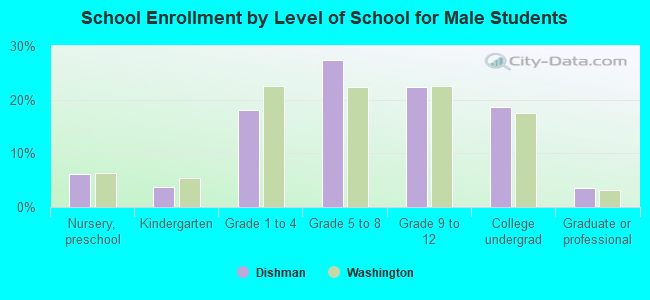
Education attainment for males 25 years and older:
No schooling: 17
Nursery to 4th grade: 10
5th and 6th grade: 17
7th and 8th grade: 85
9th grade: 44
10th grade: 61
11th grade: 94
12th grade, no diploma: 170
High school graduate (or equivalency): 998
Less than 1 year of college: 285
Some college more than 1 year, no degree: 513
Associate degree: 302
Bachelor's degree: 438
Master's degree: 72
Professional school degree: 29
Doctorate degree: 8
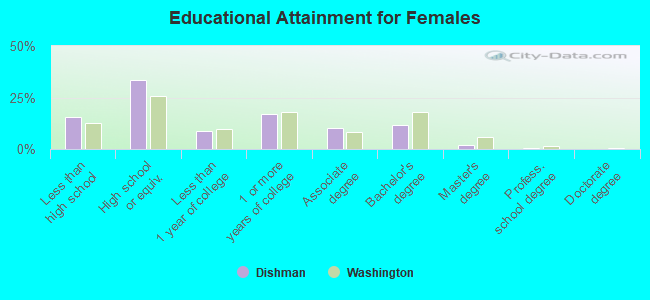
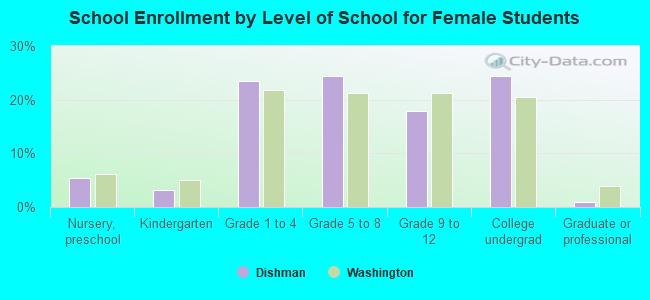
Education attainment for females 25 years and older:
No schooling: 13
Nursery to 4th grade: 0
5th and 6th grade: 5
7th and 8th grade: 156
9th grade: 47
10th grade: 91
11th grade: 112
12th grade, no diploma: 114
High school graduate (or equivalency): 1,157
Less than 1 year of college: 308
Some college more than 1 year, no degree: 591
Associate degree: 342
Bachelor's degree: 404
Master's degree: 70
Professional school degree: 22
Doctorate degree: 0
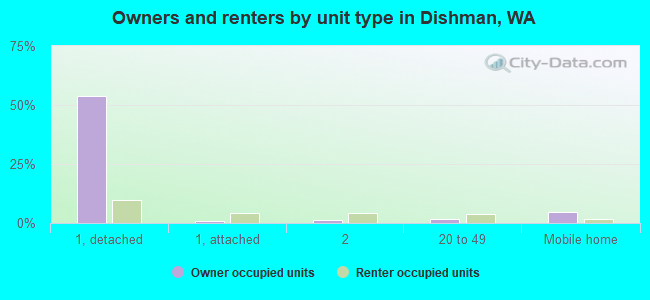
Housing units in structures:
One, detached: 2,769
One, attached: 218
Two: 258
3 or 4: 95
5 to 9: 103
10 to 19: 258
20 to 49: 255
50 or more: 160
Mobile homes: 288
Median worth of mobile homes: $50,852
Housing units lacking complete plumbing facilities: 0.4%