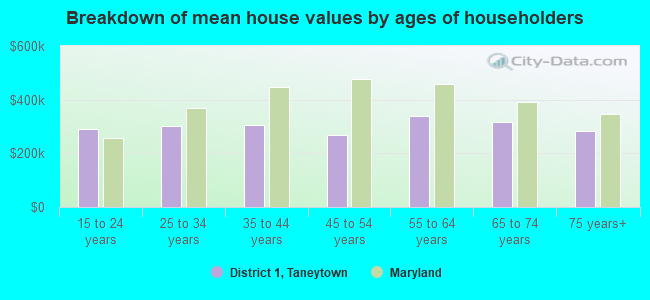
Median price asked for vacant for-sale houses and condos in 2022 in this county: $499,267.
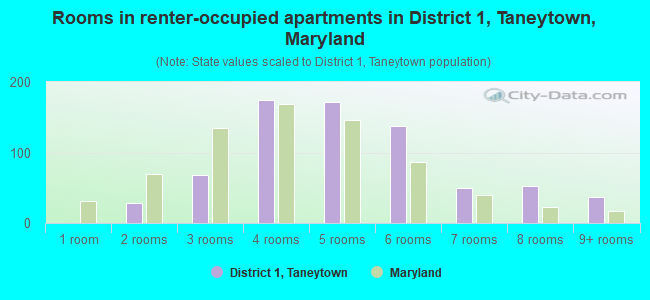
Median contract rent in 2022: $1,015 (lower quartile is $751, upper quartile is $1,369)
Median rent asked for vacant for-rent units in 2022: $816
Median gross rent in District 1, Taneytown, MD in 2022: $1,200
Housing units in District 1, Taneytown with a mortgage: 1,368 (257 second mortgage, 148 home equity loan, 6 both second mortgage and home equity loan) Houses without a mortgage: 386
Compare current foreclosures near District 1, Taneytown, MD:
In family households: 145,690 (34,972 male householders, 10,191 female householders)
37,552 spouses, 51,840 children (48,289 natural, 1,271 adopted, 2,280 stepchildren), 3,047 grandchildren, 896 brothers or sisters, 1,301 parents, foster children, 1,265 other relatives, 3,257 non-relatives
In nonfamily households: 18,125 (6,421 male householders (4,939 living alone)), 8,202 female householders (7,004 living alone)), 3,502 nonrelatives
In group quarters: 3,319 (1,966 institutionalized population)
33,203 married couples with children.
5,903 single-parent households (1,654 men, 4,249 women).
97.0% of residents of District 1, Taneytown speak English at home.
1.2% of residents speak Spanish at home (75% speak English very well, 18% speak English well, 7% speak English not well).
1.8% of residents speak other Indo-European language at home (89% speak English very well, 6% speak English well, 5% speak English not well).
0.1% of residents speak Asian or Pacific Island language at home (100% speak English well).
Foreign born population: 324 (3.5%)
(55.6% of them are naturalized citizens)
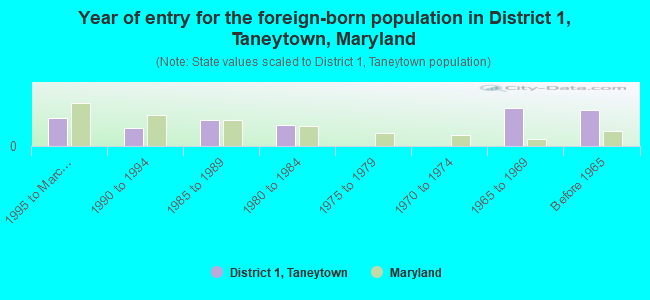
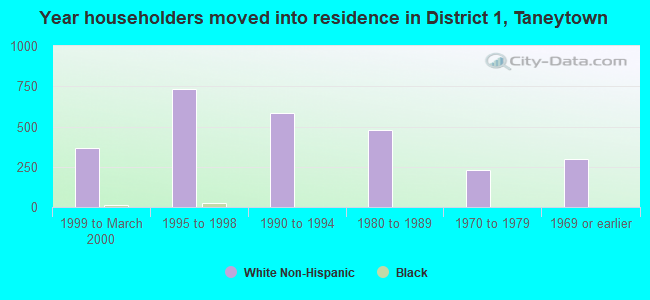
Year of entry for the foreign-born population in District 1, Taneytown, Maryland
171995 to March 2000
111990 to 1994
161985 to 1989
131980 to 1984
01975 to 1979
01970 to 1974
231965 to 1969
22Before 1965
Most common places of birth for foreign-born residents (%):
United Kingdom
District 1, Taneytown:
30.4% (31)
Maryland:
2.7% (14,206)
Other Western Europe
District 1, Taneytown:
16.7% (17)
Maryland:
0.3% (1,448)
Germany
District 1, Taneytown:
13.7% (14)
Maryland:
2.8% (14,555)
Other Northern Europe
District 1, Taneytown:
5.9% (6)
Maryland:
0.3% (1,679)
Italy
District 1, Taneytown:
4.9% (5)
Maryland:
1.2% (6,266)
Portugal
District 1, Taneytown:
3.9% (4)
Maryland:
0.3% (1,439)
Korea
District 1, Taneytown:
3.9% (4)
Maryland:
6.0% (31,249)
Australia
District 1, Taneytown:
3.9% (4)
Maryland:
0.2% (1,249)
Argentina
District 1, Taneytown:
3.9% (4)
Maryland:
0.6% (2,999)
Other South America
District 1, Taneytown:
3.9% (4)
Maryland:
0.3% (1,715)
Ireland
District 1, Taneytown:
2.9% (3)
Maryland:
0.4% (2,102)
Other Eastern Europe
District 1, Taneytown:
2.9% (3)
Maryland:
1.0% (5,093)
Other Northern Africa
District 1, Taneytown:
2.9% (3)
Maryland:
0.5% (2,526)
Place of birth for U.S.-born residents:
This state: 5,453
Other state: 2,294
Northeast: 1,517
Midwest: 188
South: 531
West: 58
61% of District 1, Taneytown residents lived in the same house 5 years ago. Out of people who lived in different houses, 67% lived in this county. Out of people who lived in different counties, 67% lived in Maryland.
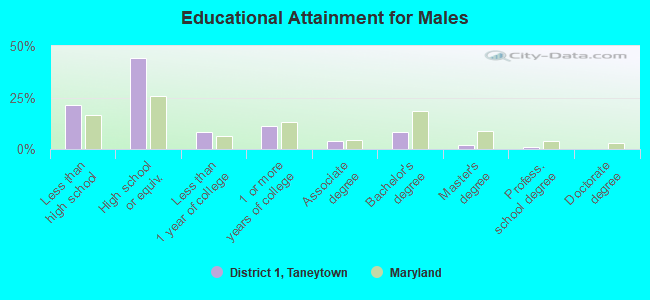
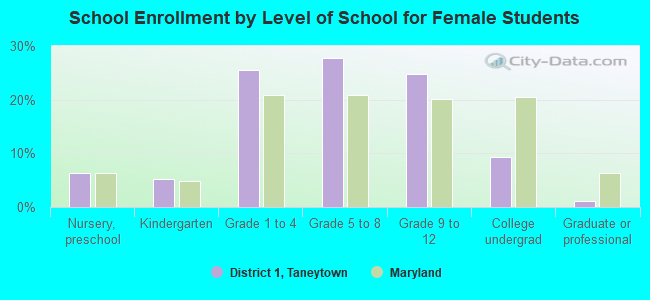
Education attainment for males 25 years and older:
No schooling: 36
Nursery to 4th grade: 0
5th and 6th grade: 28
7th and 8th grade: 100
9th grade: 85
10th grade: 98
11th grade: 79
12th grade, no diploma: 69
High school graduate (or equivalency): 1,023
Less than 1 year of college: 189
Some college more than 1 year, no degree: 256
Associate degree: 91
Bachelor's degree: 192
Master's degree: 42
Professional school degree: 19
Doctorate degree: 4
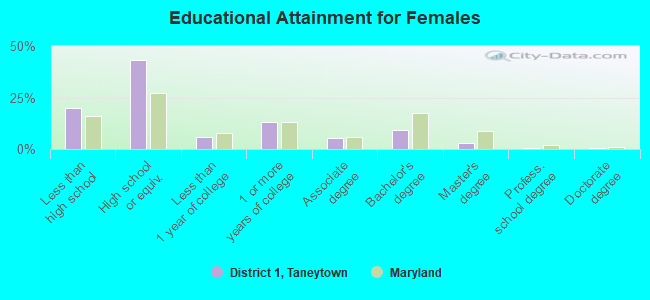
Education attainment for females 25 years and older:
No schooling: 15
Nursery to 4th grade: 0
5th and 6th grade: 3
7th and 8th grade: 103
9th grade: 82
10th grade: 149
11th grade: 103
12th grade, no diploma: 49
High school graduate (or equivalency): 1,102
Less than 1 year of college: 154
Some college more than 1 year, no degree: 332
Associate degree: 135
Bachelor's degree: 234
Master's degree: 79
Professional school degree: 11
Doctorate degree: 7
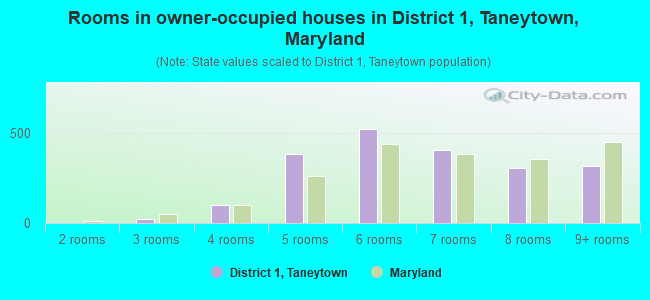
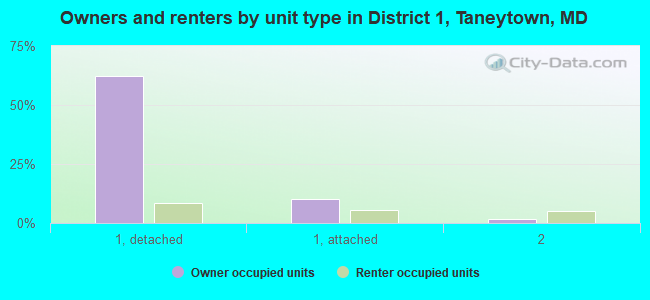
Housing units in structures:
One, detached: 2,018
One, attached: 451
Two: 202
3 or 4: 94
5 to 9: 65
10 to 19: 42
20 to 49: 4
Mobile homes: 12
Median worth of mobile homes: $499,488
Housing units lacking complete plumbing facilities: 0.8%
Housing units lacking complete kitchen facilities: 0.5%