Median price asked for vacant for-sale houses and condos in 2022 in this county: $340,254.
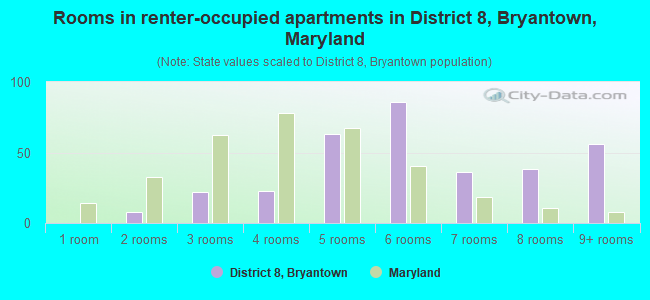
Median contract rent in 2022: $1,816 (lower quartile is $1,050, upper quartile is over $2,000)
Median rent asked for vacant for-rent units in 2022: $1,139
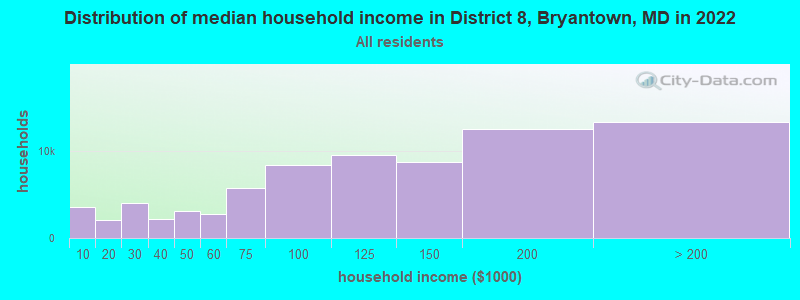
Median gross rent in District 8, Bryantown, MD in 2022: over $2,000
Housing units in District 8, Bryantown with a mortgage: 2,894 (414 second mortgage, 423 home equity loan, 28 both second mortgage and home equity loan) Houses without a mortgage: 520
Compare current foreclosures near District 8, Bryantown, MD:
In family households: 129,218 (25,516 male householders, 13,098 female householders)
27,772 spouses, 47,719 children (43,895 natural, 1,076 adopted, 2,748 stepchildren), 4,334 grandchildren, 1,551 brothers or sisters, 1,562 parents, foster children, 2,408 other relatives, 3,977 non-relatives
In nonfamily households: 15,928 (5,834 male householders (4,425 living alone)), 6,766 female householders (5,693 living alone)), 3,328 nonrelatives
In group quarters: 1,405 (987 institutionalized population)
22,792 married couples with children.
8,153 single-parent households (1,804 men, 6,349 women).
95.4% of residents of District 8, Bryantown speak English at home.
1.6% of residents speak Spanish at home (80% speak English very well, 16% speak English well, 4% speak English not well).
1.4% of residents speak other Indo-European language at home (77% speak English very well, 13% speak English well, 10% speak English not well).
1.0% of residents speak Asian or Pacific Island language at home (71% speak English very well, 29% speak English well).
0.6% of residents speak other language at home (77% speak English very well, 23% speak English well).
Foreign born population: 1,477 (8.4%)
(58.7% of them are naturalized citizens)
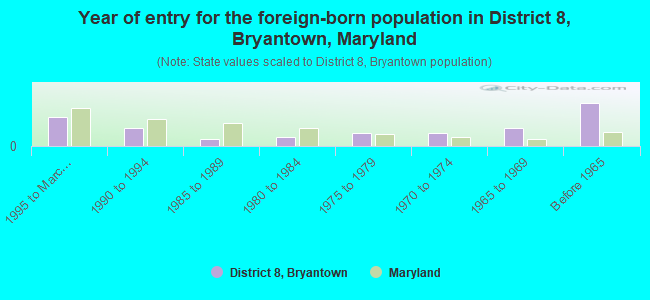
Year of entry for the foreign-born population in District 8, Bryantown, Maryland
701995 to March 2000
441990 to 1994
181985 to 1989
221980 to 1984
311975 to 1979
311970 to 1974
431965 to 1969
104Before 1965
Most common places of birth for foreign-born residents (%):
Germany
District 8, Bryantown:
16.3% (59)
Maryland:
2.8% (14,555)
Philippines
District 8, Bryantown:
12.7% (46)
Maryland:
4.1% (21,007)
Vietnam
District 8, Bryantown:
8.0% (29)
Maryland:
2.9% (14,807)
Iraq
District 8, Bryantown:
7.7% (28)
Maryland:
0.1% (529)
Portugal
District 8, Bryantown:
5.2% (19)
Maryland:
0.3% (1,439)
Other Northern America
District 8, Bryantown:
5.0% (18)
Maryland:
0.1% (281)
Italy
District 8, Bryantown:
4.7% (17)
Maryland:
1.2% (6,266)
Korea
District 8, Bryantown:
4.7% (17)
Maryland:
6.0% (31,249)
Canada
District 8, Bryantown:
4.7% (17)
Maryland:
1.7% (9,019)
India
District 8, Bryantown:
4.4% (16)
Maryland:
6.2% (32,276)
Japan
District 8, Bryantown:
3.6% (13)
Maryland:
1.0% (5,354)
United Kingdom
District 8, Bryantown:
2.8% (10)
Maryland:
2.7% (14,206)
Netherlands
District 8, Bryantown:
2.8% (10)
Maryland:
0.3% (1,415)
Pakistan
District 8, Bryantown:
2.8% (10)
Maryland:
1.4% (7,183)
France
District 8, Bryantown:
2.2% (8)
Maryland:
0.8% (4,318)
Other Eastern Europe
District 8, Bryantown:
2.2% (8)
Maryland:
1.0% (5,093)
Europe, n.e.c.
District 8, Bryantown:
2.2% (8)
Maryland:
0.0% (79)
Mexico
District 8, Bryantown:
1.9% (7)
Maryland:
3.7% (19,287)
Panama
District 8, Bryantown:
1.9% (7)
Maryland:
0.5% (2,850)
El Salvador
District 8, Bryantown:
1.7% (6)
Maryland:
8.1% (41,818)
Place of birth for U.S.-born residents:
This state: 5,027
Other state: 6,946
Northeast: 1,389
Midwest: 627
South: 4,617
West: 313
68% of District 8, Bryantown residents lived in the same house 5 years ago. Out of people who lived in different houses, 48% lived in this county. Out of people who lived in different counties, 65% lived in Maryland.
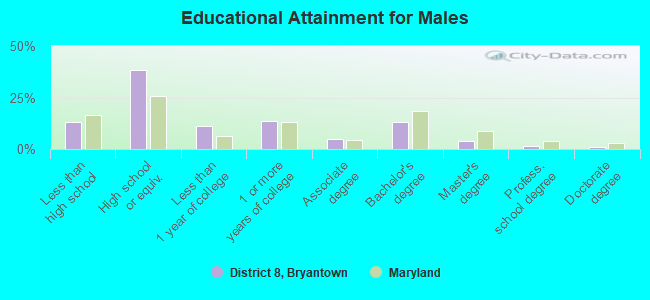
Education attainment for males 25 years and older:
No schooling: 17
Nursery to 4th grade: 8
5th and 6th grade: 6
7th and 8th grade: 146
9th grade: 41
10th grade: 172
11th grade: 77
12th grade, no diploma: 97
High school graduate (or equivalency): 1,673
Less than 1 year of college: 480
Some college more than 1 year, no degree: 595
Associate degree: 211
Bachelor's degree: 563
Master's degree: 169
Professional school degree: 58
Doctorate degree: 50
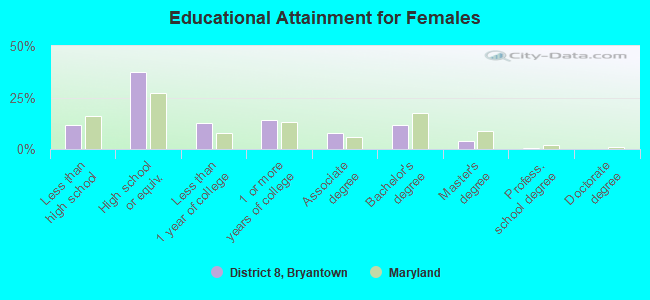
Education attainment for females 25 years and older:
No schooling: 21
Nursery to 4th grade: 4
5th and 6th grade: 19
7th and 8th grade: 126
9th grade: 41
10th grade: 80
11th grade: 95
12th grade, no diploma: 134
High school graduate (or equivalency): 1,638
Less than 1 year of college: 554
Some college more than 1 year, no degree: 620
Associate degree: 342
Bachelor's degree: 503
Master's degree: 180
Professional school degree: 31
Doctorate degree: 0
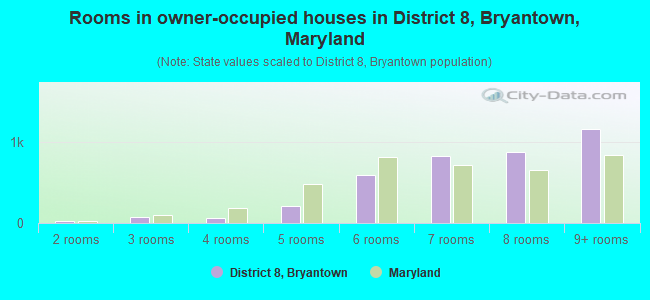
Housing units in structures:
One, detached: 4,106
One, attached: 17
Two: 6
3 or 4: 15
5 to 9: 15
20 to 49: 5
Mobile homes: 97
Median worth of mobile homes: $82,874
Housing units lacking complete plumbing facilities: 1.2%
Housing units lacking complete kitchen facilities: 0.9%