Dixon, CA (California) Houses and Residents
| Dixon: | $576,418 |
| California: | $715,900 |
Total population: 19,164 (Urban population: 16,033 (all inside urban clusters), Rural population: 56 (19 farm, 37 nonfarm))
Houses: 6,815 (6,576 occupied: 3,953 owner occupied, 2,717 renter occupied)
| % of renters here: | 41% |
| State: | 44% |
Housing density: 1,030 houses/condos per square mile
Median price asked for vacant for-sale houses and condos in 2022 in this county: $511,355.
Median contract rent in 2022: $1,462 (lower quartile is $1,013, upper quartile is $1,929)
Median rent asked for vacant for-rent units in 2022: $1,884
Median gross rent in Dixon, CA in 2022: $1,750
Housing units in Dixon with a mortgage: 2,871 (281 second mortgage, 9 home equity loan, 212 both second mortgage and home equity loan)
Houses without a mortgage: 0
Median household income for houses/condos with a mortgage: $112,907
Median household income for apartments without a mortgage: $90,687
Median monthly housing costs: $1,873
Compare current foreclosures near Dixon, CA:
| Photo | Address | Area | Beds / Baths | Price | Details |
|---|---|---|---|---|---|

|
#1
Charity Ln
Dixon, CA 95620
|
1,688 sq. feet
|
2 baths 3 beds |
show details | |

|
#2
Davidson Court
Dixon, CA 95620
|
2,338 sq. feet
|
3 baths 4 beds |
show details | |

|
#3
Wiegand Ct
Dixon, CA 95620
|
2,044 sq. feet
|
2 baths 4 beds |
show details | |

|
#4
Walnut Park Ave
Dixon, CA 95620
|
1,946 sq. feet
|
2 baths 4 beds |
show details | |

|
#5
W F St
Dixon, CA 95620
|
949 sq. feet
|
1 baths 3 beds |
show details | |

|
#6
W H St
Dixon, CA 95620
|
1,510 sq. feet
|
1 baths 3 beds |
show details | |

|
#7
Priddy Dr
Dixon, CA 95620
|
1,566 sq. feet
|
2 baths 4 beds |
show details | |

|
#8
Hopkins Dr
Dixon, CA 95620
|
1,619 sq. feet
|
2 baths 4 beds |
show details | |

|
#9
Mckenzie Ct
Dixon, CA 95620
|
1,494 sq. feet
|
2 baths 3 beds |
show details | |

|
#10
Wiegand Ct # B
Dixon, CA 95620
|
2,044 sq. feet
|
2 baths 4 beds |
show details |
| Photo | Address | Area | Beds / Baths | Price | Details |
|---|---|---|---|---|---|

|
#11
Mariposa Dr
Dixon, CA 95620
|
3,413 sq. feet
|
2 baths 4 beds |
show details | |

|
#12
Green Dr
Dixon, CA 95620
|
1,617 sq. feet
|
2 baths 4 beds |
show details | |

|
#13
Fuller Ln
Dixon, CA 95620
|
1,633 sq. feet
|
2 baths 4 beds |
show details | |

|
#14
Amesbury Dr
Dixon, CA 95620
|
1,222 sq. feet
|
2 baths 3 beds |
show details | |

|
#15
Columbia Dr
Dixon, CA 95620
|
- sq. feet
|
- baths - beds |
show details | |

|
#16
Dartmouth Cir
Dixon, CA 95620
|
- sq. feet
|
- baths - beds |
show details | |

|
#17
Gateway Plz # A
Dixon, CA 95620
|
- sq. feet
|
- baths - beds |
show details | |

|
#18
Hyde Rd
Dixon, CA 95620
|
- sq. feet
|
- baths - beds |
show details | |

|
#19
W Chestnut St Apt 55
Dixon, CA 95620
|
- sq. feet
|
- baths - beds |
show details | |

|
#20
Dawson Dr
Dixon, CA 95620
|
- sq. feet
|
- baths - beds |
show details |
| Photo | Address | Area | Beds / Baths | Price | Details |
|---|---|---|---|---|---|

|
#21
Herst Ln
Dixon, CA 95620
|
- sq. feet
|
- baths - beds |
show details | |

|
#22
Stratford Ave
Dixon, CA 95620
|
- sq. feet
|
- baths - beds |
show details | |

|
#23
Stonecrop Ln
Dixon, CA 95620
|
- sq. feet
|
- baths - beds |
show details | |

|
#24
Heritage Ln
Dixon, CA 95620
|
- sq. feet
|
- baths - beds |
show details | |

|
#25
Pedrick Rd
Dixon, CA 95620
|
- sq. feet
|
- baths - beds |
show details | |

|
#26
Hyde Rd
Dixon, CA 95620
|
- sq. feet
|
- baths - beds |
show details | |

|
#27
Arcadia Dr
Vacaville, CA 95687
|
998 sq. feet
|
1 baths 2 beds |
show details | |

|
#28
Claudia Ct
West Sacramento, CA 95691
|
- sq. feet
|
2 baths 3 beds |
$40,177
|
show details |

|
#29
La Fleur Way
Sacramento, CA 95831
|
3,287 sq. feet
|
5 baths 5 beds |
show details | |

|
#30
Andrews Cir
Suisun City, CA 94585
|
2,216 sq. feet
|
3 baths 3 beds |
show details |
| Photo | Address | Area | Beds / Baths | Price | Details |
|---|---|---|---|---|---|

|
#31
Stirling Dr
Vacaville, CA 95687
|
1,803 sq. feet
|
3 baths 4 beds |
show details | |

|
#32
Cypress Cir
Fairfield, CA 94533
|
- sq. feet
|
2 baths 3 beds |
show details | |

|
#33
Dahlia St
Fairfield, CA 94533
|
1,403 sq. feet
|
2 baths 3 beds |
show details | |

|
#34
Owl Dr
Vacaville, CA 95687
|
1,614 sq. feet
|
2 baths 3 beds |
show details | |

|
#35
Duncan Cir
Woodland, CA 95776
|
1,073 sq. feet
|
2 baths 3 beds |
show details | |

|
#36
Pocket Rd
Sacramento, CA 95831
|
924 sq. feet
|
2 baths 2 beds |
show details | |

|
#37
Purple Sage Dr
Vacaville, CA 95687
|
3,104 sq. feet
|
3 baths 5 beds |
show details | |

|
#38
Sheldon Dr
Fairfield, CA 94533
|
1,845 sq. feet
|
2 baths 3 beds |
show details | |

|
#39
Cox Ln
Fairfield, CA 94533
|
2,657 sq. feet
|
2 baths 4 beds |
show details | |

|
#40
Shasta Dr
Fairfield, CA 94533
|
1,651 sq. feet
|
2 baths 3 beds |
show details |
| Photo | Address | Area | Beds / Baths | Price | Details |
|---|---|---|---|---|---|

|
#41
Bailey Dr
Fairfield, CA 94533
|
2,291 sq. feet
|
2 baths 4 beds |
show details | |

|
#42
Midway Dr
Woodland, CA 95695
|
- sq. feet
|
- baths - beds |
$114,206
|
show details |

|
#43
Shoreline Cir
Fairfield, CA 94533
|
2,466 sq. feet
|
3 baths 4 beds |
show details | |

|
#44
Rebecca Dr
Fairfield, CA 94533
|
2,685 sq. feet
|
3 baths 5 beds |
show details | |

|
#45
Freitas Way
Fairfield, CA 94533
|
1,920 sq. feet
|
2 baths 4 beds |
show details | |

|
#46
Persimmon Pl
Fairfield, CA 94533
|
1,877 sq. feet
|
2 baths 4 beds |
show details | |

|
#47
Bello Rio Way
Sacramento, CA 95831
|
1,571 sq. feet
|
2 baths 2 beds |
show details | |

|
#48
Seal Rock Way
Sacramento, CA 95831
|
1,588 sq. feet
|
2 baths 4 beds |
show details | |

|
#49
California Dr
Vacaville, CA 95687
|
1,604 sq. feet
|
2 baths 3 beds |
show details | |

|
Check over 1 million property listings on Foreclosure.com!
|
browse all offers | |||

Latest news about housing in Dixon, CA collected exclusively by city-data.com from local newspapers, TV, and radio stations


Median year apartment built: 1982
Household type by relationship:
Households: 18,975- Male householders: 3,474 (768 living alone), Female householders: 2,984 (527 living alone)
3,358 spouses (3,327 opposite-sex spouses), 391 unmarried partners, (391 opposite-sex unmarried partners), 6,834 children (6,366 natural, 114 adopted, 354 stepchildren), 354 grandchildren, 170 brothers or sisters, 444 parents, 0 foster children, 271 other relatives, 673 non-relatives
- In group quarters: 18
Size of family households: 1,745 2-persons, 1,019 3-persons, 1,381 4-persons, 711 5-persons, 165 6-persons, 35 7-or-more-persons.
Size of nonfamily households: 1,438 1-person, 96 2-persons, 42 3-persons, 14 4-persons.
3,191 married couples with children.
1,243 single-parent households (198 men, 1,045 women).
65.0% of residents of Dixon speak English at home.
29.7% of residents speak Spanish at home (49% speak English very well, 26% speak English well, 14% speak English not well, 11% don't speak English at all).
3.0% of residents speak other Indo-European language at home (67% speak English very well, 20% speak English well, 9% speak English not well, 4% don't speak English at all).
1.9% of residents speak Asian or Pacific Island language at home (71% speak English very well, 21% speak English well, 8% speak English not well).
0.1% of residents speak other language at home (100% speak English very well).
Foreign born population: 3,266 (17.2%)
(46.1% of them are naturalized citizens)
| Here: | 6.2 |
| State: | 6.0 |
| Here: | 4.2 |
| State: | 3.9 |
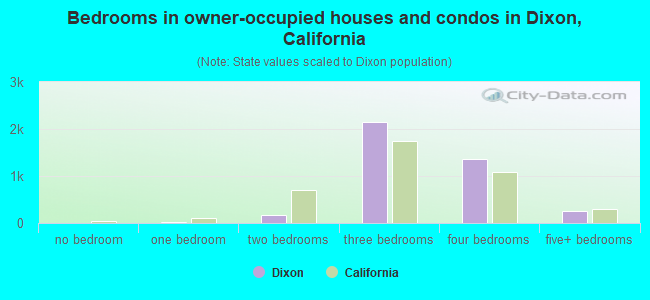
- Bedrooms in owner-occupied houses and condos in Dixon, California
- 0no bedroom
- 121 bedroom
- 1762 bedrooms
- 2,1483 bedrooms
- 1,3544 bedrooms
- 2645+ bedrooms
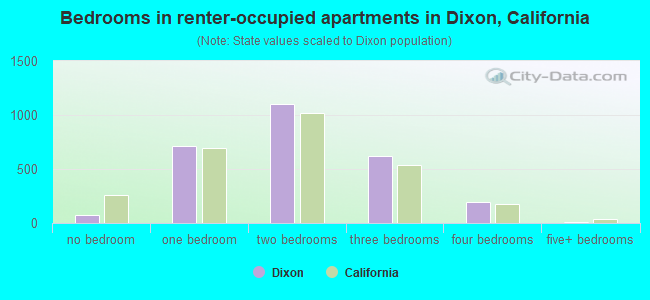
- Bedrooms in renter-occupied apartments in Dixon, California
- 72no bedroom
- 7141 bedroom
- 1,1062 bedrooms
- 6213 bedrooms
- 1954 bedrooms
- 95+ bedrooms
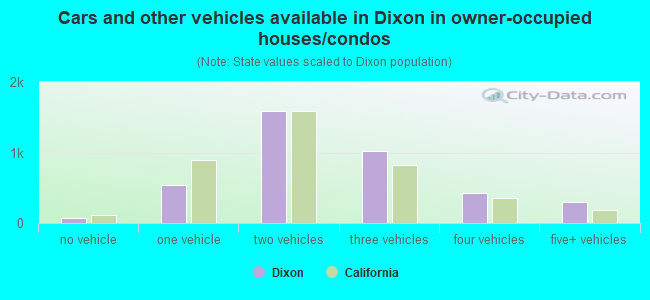
- Cars and other vehicles available in Dixon in owner-occupied houses/condos
- 78no vehicle
- 5431 vehicle
- 1,5872 vehicles
- 1,0253 vehicles
- 4274 vehicles
- 2955+ vehicles
- Cars and other vehicles available in Dixon in renter-occupied apartments
- 158no vehicle
- 1,1141 vehicle
- 8352 vehicles
- 2543 vehicles
- 3134 vehicles
- 435+ vehicles
- Rooms in owner-occupied houses in Dixon, California
- 01 room
- 02 rooms
- 173 rooms
- 1894 rooms
- 9635 rooms
- 1,1406 rooms
- 8427 rooms
- 4248 rooms
- 3789+ rooms
- Rooms in renter-occupied apartments in Dixon, California
- 721 room
- 3962 rooms
- 4053 rooms
- 8164 rooms
- 5985 rooms
- 3036 rooms
- 1077 rooms
- 218 rooms
- 09+ rooms
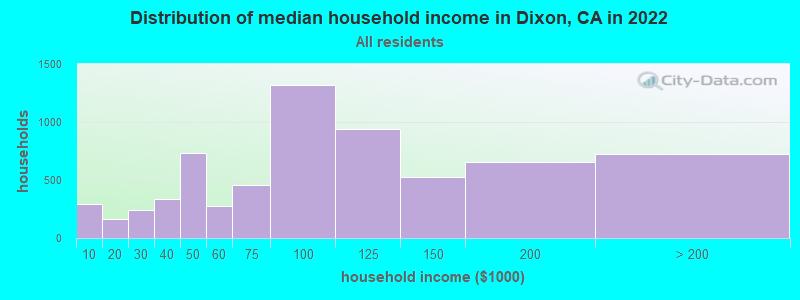
Dixon, CA household income distribution

- 296Less than $10,000
- 163$10,000 to $19,999
- 239$20,000 to $29,999
- 332$30,000 to $39,999
- 737$40,000 to $49,999
- 275$50,000 to $59,999
- 455$60,000 to $74,999
- 1,318$75,000 to $99,999
- 943$100,000 to $124,999
- 528$125,000 to $149,999
- 656$150,000 to $199,999
- 724$200,000 or more
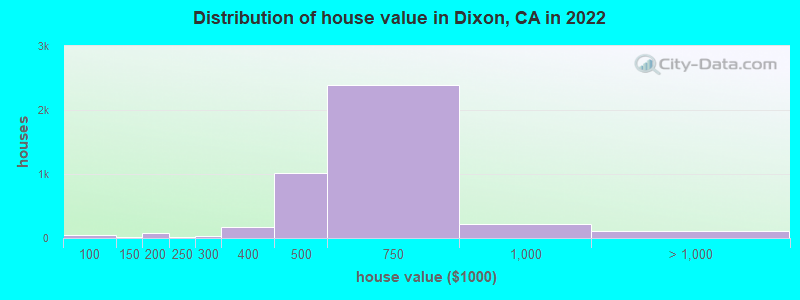
Home value of owner - occupied houses in 2022 in Dixon, CA
-
- 10$40,000 to $49,999
- 31$60,000 to $69,999
- 12$100,000 to $124,999
- 63$150,000 to $174,999
- 8$175,000 to $199,999
- 16$200,000 to $249,999
- 31$250,000 to $299,999
- 166$300,000 to $399,999
- 1,015$400,000 to $499,999
- 2,393$500,000 to $749,999
- 224$750,000 to $999,999
- 34$1,000,000 to $1,499,999
- 60$1,500,000 to $1,999,999
- 11$2,000,000 or more
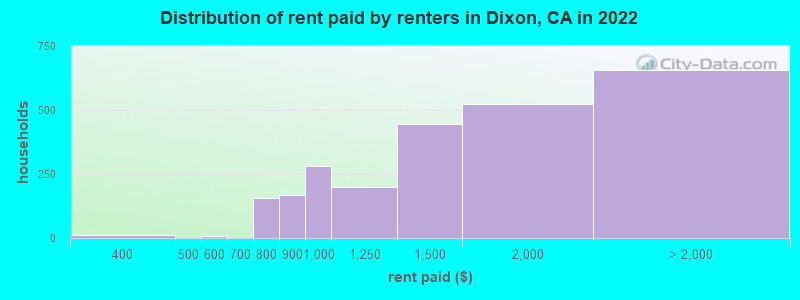
Rent paid by renters in 2022 in Dixon, CA
-
- 10$300 to $349
- 7$500 to $549
- 35$700 to $749
- 121$750 to $799
- 168$800 to $899
- 282$900 to $999
- 199$1,000 to $1,249
- 447$1,250 to $1,499
- 522$1,500 to $1,999
- 327$2,000 to $2,499
- 181$2,500 to $2,999
- 24$3,000 to $3,499
- 125No cash rent
Percentage of workers working in this county: 66.6%
Number of people working at home: 815 (8.4% of all workers)
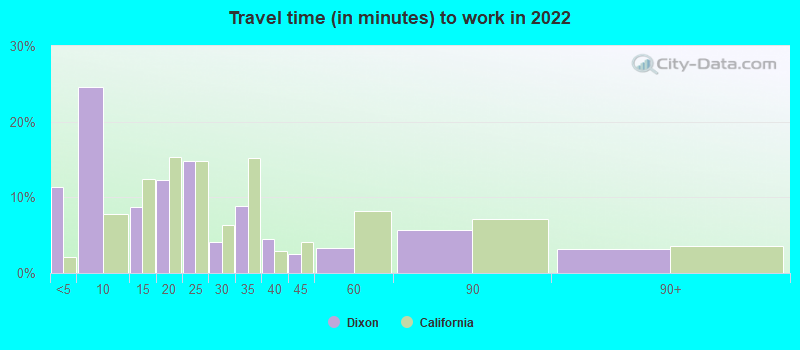
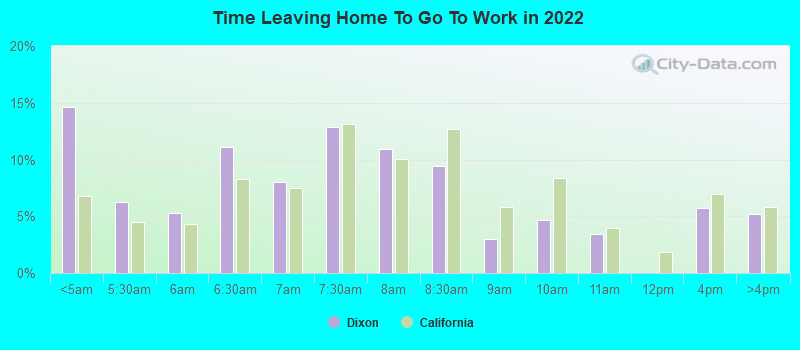
Travel time to work (commute)
- Less than 5 minutes: 691
- 5 to 9 minutes: 1,570
- 10 to 14 minutes: 712
- 15 to 19 minutes: 1,437
- 20 to 24 minutes: 1,149
- 25 to 29 minutes: 451
- 30 to 34 minutes: 707
- 35 to 39 minutes: 252
- 40 to 44 minutes: 226
- 45 to 59 minutes: 976
- 60 to 89 minutes: 422
- 90 or more minutes: 360
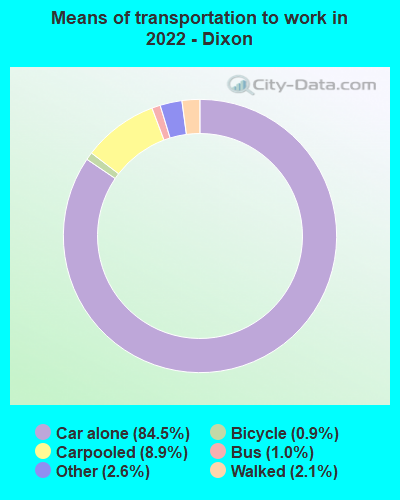
Means of transportation to work:
- Drove a car alone: 4,654 (71.8%)
- Carpooled: 585 (9.0%)
- Bus: 48 (0.7%)
- Taxi: 134 (2.1%)
- Bicycle: 54 (0.8%)
- Walked: 101 (1.6%)
- Worked at home: 815 (12.6%)
- Unemployment by race in 2022
- Unemployment rate for White non-Hispanic residents
- 3.1%Males
- 1.3%Females
- Unemployment rate for other race residents
- 3.0%Males
- 15.0%Females
- Unemployment rate for two or more race residents
- 6.3%Males
- Unemployment rate for Hispanic or Latino residents
- 2.4%Males
- 6.7%Females
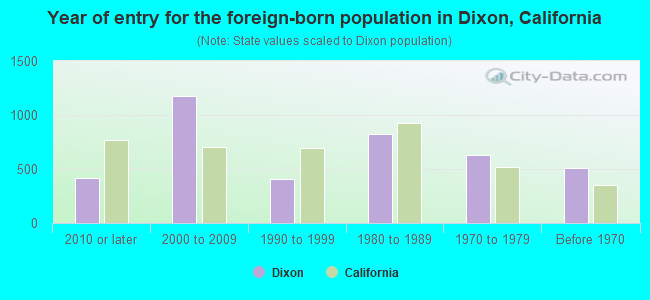
- Year of entry for the foreign-born population in Dixon, California
- 4212010 or later
- 1,1782000 to 2009
- 4061990 to 1999
- 8251980 to 1989
- 6311970 to 1979
- 505Before 1970
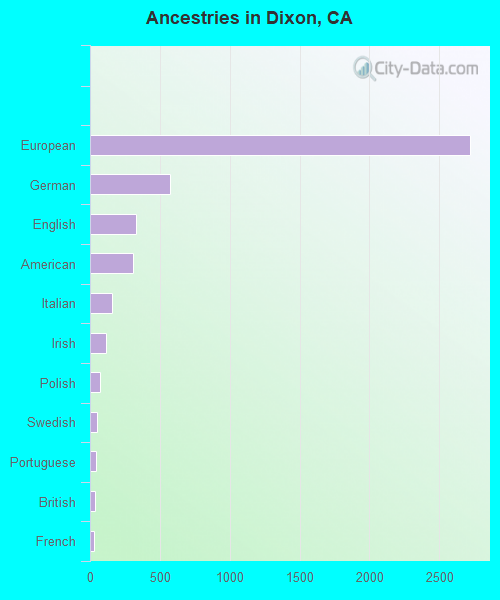
First ancestries reported:
- European: 2,720 (23.4%)
- German: 570 (4.9%)
- English: 331 (2.9%)
- American: 311 (2.7%)
- Italian: 158 (1.4%)
- Irish: 115 (1.0%)
- Polish: 74 (0.6%)
- Swedish: 47 (0.4%)
- Portuguese: 41 (0.4%)
- British: 39 (0.3%)
- French: 27 (0.2%)
- Russian: 23 (0.2%)
- Swiss: 21 (0.2%)
- Lithuanian: 20 (0.2%)
- Maltese: 20 (0.2%)
- Scottish: 20 (0.2%)
- Basque: 18 (0.2%)
- Scandinavian: 18 (0.2%)
- Pennsylvania German: 16 (0.1%)
- Afghan: 14 (0.1%)
- French Canadian: 14 (0.1%)
- Dutch: 12 (0.1%)
- Ukrainian: 12 (0.1%)
- Hungarian: 11 (0.09%)
- Northern European: 11 (0.09%)
- Eastern European: 10 (0.09%)
- Iranian: 9 (0.08%)
- Syrian: 7 (0.06%)
- Danish: 3 (0.03%)
- Scotch-Irish: 2 (0.02%)
Most common places of birth for foreign-born residents (%):
| Dixon: | 74.8% (2,322) |
| California: | 37.2% (3,881,193) |
| Dixon: | 7.0% (218) |
| California: | 7.8% (818,297) |
| Dixon: | 5.3% (163) |
| California: | 5.2% (539,184) |
| Dixon: | 2.7% (83) |
| California: | 4.9% (512,335) |
| Dixon: | 1.9% (60) |
| California: | 0.4% (40,224) |
Place of birth for U.S.-born residents:
- This state: 12,244
- Other state: 3,219
- Northeast: 617
- Midwest: 602
- South: 883
- West: 1,066
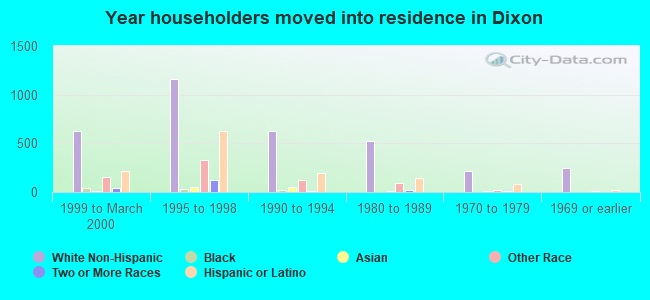
92.3% of Dixon residents lived in the same house 1 years ago.
Out of people who lived in different houses, 28.3% lived in this county.
Out of people who lived in different counties, 93.4% lived in California.
| Dixon: | 92.3% |
| State average: | 88.9% |
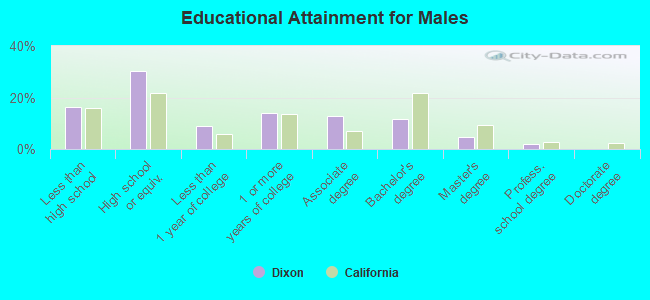
Education attainment for males 25 years and older:
- No schooling: 45
- Nursery to 4th grade: 52
- 5th and 6th grade: 172
- 7th and 8th grade: 149
- 9th grade: 122
- 10th grade: 133
- 11th grade: 85
- 12th grade, no diploma: 217
- High school graduate (or equivalency): 1,826
- Less than 1 year of college: 537
- Some college more than 1 year, no degree: 839
- Associate degree: 763
- Bachelor's degree: 695
- Master's degree: 274
- Professional school degree: 121
- Doctorate degree: 4
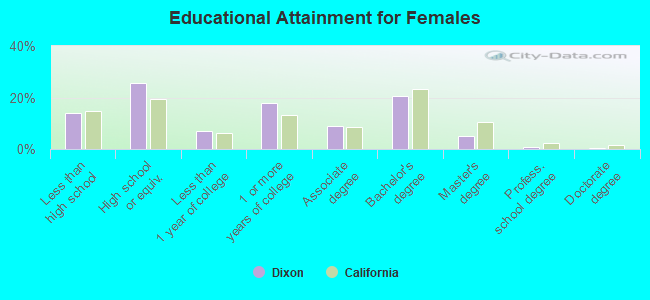
Education attainment for females 25 years and older:
- No schooling: 400
- Nursery to 4th grade: 25
- 5th and 6th grade: 47
- 7th and 8th grade: 157
- 9th grade: 49
- 10th grade: 88
- 11th grade: 5
- 12th grade, no diploma: 67
- High school graduate (or equivalency): 1,543
- Less than 1 year of college: 422
- Some college more than 1 year, no degree: 1,086
- Associate degree: 533
- Bachelor's degree: 1,236
- Master's degree: 312
- Professional school degree: 51
- Doctorate degree: 32
Housing units in structures:
- One, detached: 4,717
- One, attached: 341
- 3 or 4: 591
- 5 to 9: 543
- 10 to 19: 418
- 20 to 49: 60
- 50 or more: 141
House/condo owner moved in on average 14 years ago
Renter moved in on average 3 years ago

- 73.9%Utility gas
- 20.5%Electricity
- 3.6%Solar energy
- 1.0%Bottled, tank, or LP gas
- 0.6%Wood
- 0.3%No fuel used
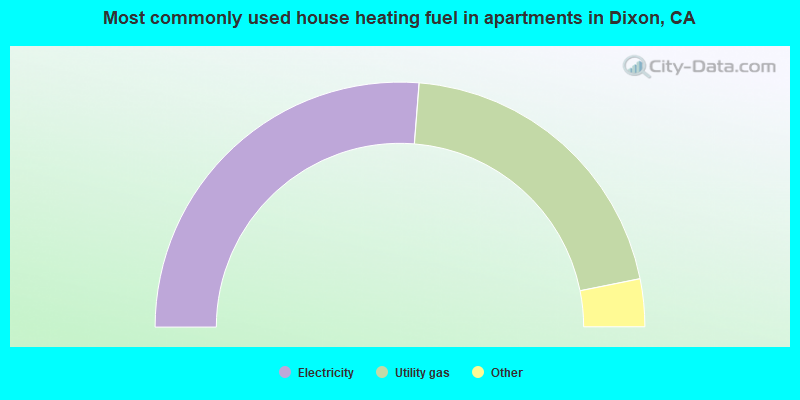
- 52.5%Electricity
- 41.2%Utility gas
- 2.5%Bottled, tank, or LP gas
- 1.9%Solar energy
- 1.8%No fuel used
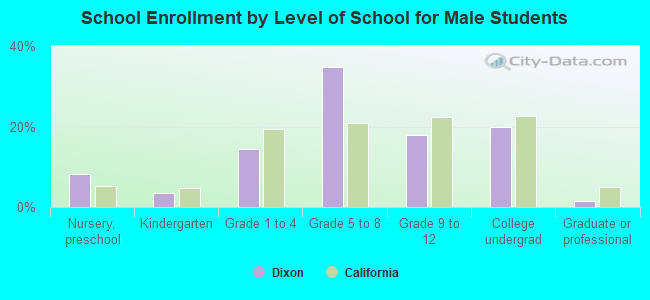
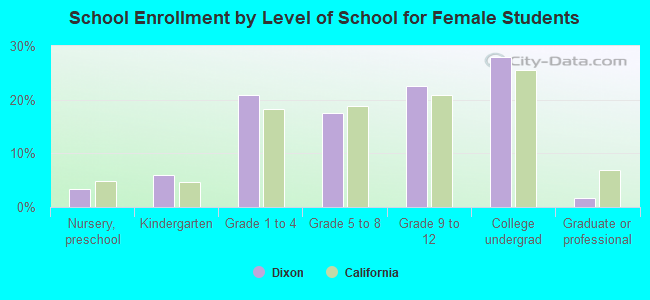
Private vs. public school enrollment:
| Here: | 4.2% |
| California: | 10.5% |
| Here: | 3.9% |
| California: | 8.5% |
| Here: | 8.9% |
| California: | 15.9% |