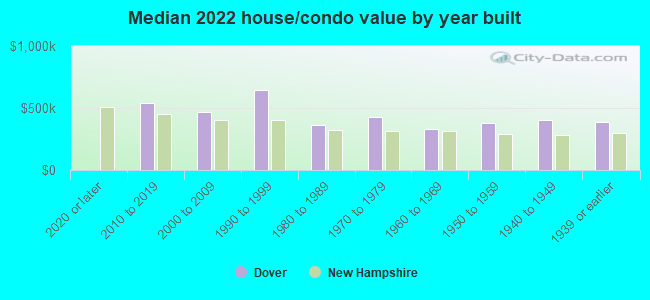
Dover, NH (New Hampshire) Houses and Residents
| Dover: | $426,554 |
| New Hampshire: | $384,700 |
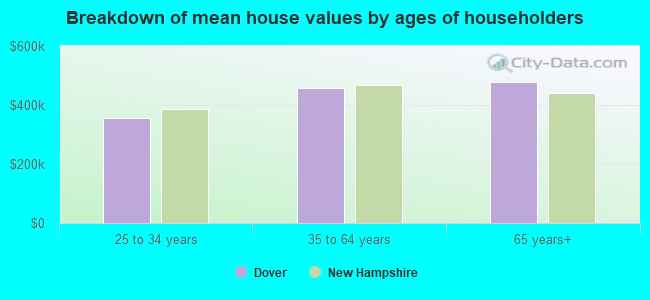
Mean price in 2022:
Detached houses: $484,628
Here: $484,628 State: $491,479 Townhouses or other attached units: $407,770
Here: $407,770 State: $361,001 In 2-unit structures: $365,660
Here: $365,660 State: $368,847 In 3-to-4-unit structures: $372,056
Here: $372,056 State: $575,942 In 5-or-more-unit structures: $481,864
Here: $481,864 State: $274,068 Mobile homes: $123,196
Here: $123,196 State: $124,817
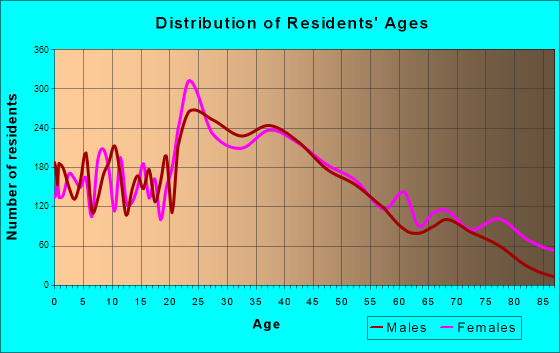
Total population: 30,665 (Urban population: 24,900, Rural population: 1,984 (all nonfarm))
Houses: 15,498 (14,848 occupied: 7,694 owner occupied, 7,122 renter occupied)
| % of renters here: | 48% |
| State: | 28% |
Housing density: 580 houses/condos per square mile
Median price asked for vacant for-sale houses and condos in 2022: $1,115,138.
Median contract rent in 2022: $1,465 (lower quartile is $1,064, upper quartile is $1,887)
Median rent asked for vacant for-rent units in 2022: $860
Median gross rent in Dover, NH in 2022: $1,555
Housing units in Dover with a mortgage: 4,971 (827 second mortgage, 38 home equity loan, 814 both second mortgage and home equity loan)
Houses without a mortgage: 20
Median household income for houses/condos with a mortgage: $148,691
Median household income for apartments without a mortgage: $98,643
Median monthly housing costs: $1,648
Compare current foreclosures near Dover, NH:
| Photo | Address | Area | Beds / Baths | Price | Details |
|---|---|---|---|---|---|

|
#1
Chapel St
Dover, NH 03820
|
1,872 sq. feet
|
2 baths 4 beds |
show details | |

|
#2
Wentworth Ter
Dover, NH 03820
|
2,404 sq. feet
|
3 baths 6 beds |
show details | |

|
#3
Back River Rd
Dover, NH 03820
|
1,193 sq. feet
|
1 baths 3 beds |
show details | |

|
#4
New York St
Dover, NH 03820
|
679 sq. feet
|
1 baths 1 beds |
show details | |

|
#5
Middle Rd
Dover, NH 03820
|
1,120 sq. feet
|
1 baths 3 beds |
show details | |

|
#6
Northam Dr
Dover, NH 03820
|
1,999 sq. feet
|
2 baths 3 beds |
show details | |

|
#7
New York St
Dover, NH 03820
|
- sq. feet
|
- baths - beds |
show details | |

|
#8
1st St, Apt 210-1
Dover, NH 03820
|
- sq. feet
|
- baths - beds |
show details | |

|
#9
Rogers St # B
Dover, NH 03820
|
- sq. feet
|
- baths - beds |
show details | |

|
#10
Brentwood Rd
Exeter, NH 03833
|
2,756 sq. feet
|
2 baths 3 beds |
$419,900
|
show details |
| Photo | Address | Area | Beds / Baths | Price | Details |
|---|---|---|---|---|---|

|
#11
Old Turnpike Rd
Nottingham, NH 03290
|
4,738 sq. feet
|
3 baths 3 beds |
show details | |

|
#12
Hobart St
Rochester, NH 03867
|
1,204 sq. feet
|
1 baths 4 beds |
show details | |

|
#13
Lincoln Ave
Newmarket, NH 03857
|
1,568 sq. feet
|
3 baths 3 beds |
show details | |

|
#14
Laura Dr
Rochester, NH 03867
|
1,674 sq. feet
|
3 baths 3 beds |
show details | |

|
#15
Tasker Hill Rd
Strafford, NH 03884
|
2,630 sq. feet
|
3 baths 3 beds |
show details | |

|
#16
Mcdaniel Shore Dr
Barrington, NH 03825
|
2,681 sq. feet
|
1 baths 3 beds |
show details | |

|
#17
Linden St
Rochester, NH 03867
|
1,648 sq. feet
|
2 baths 3 beds |
show details | |

|
#18
Walnut St
Somersworth, NH 03878
|
1,784 sq. feet
|
1 baths 1 beds |
show details | |

|
#19
Old Post Rd
York, ME 03909
|
864 sq. feet
|
1 baths 2 beds |
show details | |

|
#20
Shore Rd
Cape Neddick, ME 03902
|
1,900 sq. feet
|
1 baths 4 beds |
show details |
| Photo | Address | Area | Beds / Baths | Price | Details |
|---|---|---|---|---|---|

|
#21
Harvard St
Exeter, NH 03833
|
1,509 sq. feet
|
1 baths 3 beds |
show details | |

|
#22
Brentwood Rd
Exeter, NH 03833
|
3,683 sq. feet
|
3 baths 4 beds |
show details | |

|
#23
Dearborn Rd
Epping, NH 03042
|
1,768 sq. feet
|
2 baths 3 beds |
show details | |

|
#24
Piscassic St
Newmarket, NH 03857
|
1,608 sq. feet
|
2 baths 4 beds |
show details | |

|
#25
Langs Ln
Newmarket, NH 03857
|
2,466 sq. feet
|
2 baths 3 beds |
show details | |

|
#26
Roller Coaster Rd
Strafford, NH 03884
|
2,530 sq. feet
|
3 baths 6 beds |
show details | |

|
#27
1st Nh Tpke
Northwood, NH 03261
|
3,778 sq. feet
|
2 baths 6 beds |
show details | |

|
#28
Adams Park
Rye, NH 03870
|
1,008 sq. feet
|
2 baths 3 beds |
show details | |

|
#29
1st Crown Point Rd
Strafford, NH 03884
|
1,738 sq. feet
|
1 baths 3 beds |
show details | |

|
#30
Cedar Point Rd
Durham, NH 03824
|
4,052 sq. feet
|
3 baths 3 beds |
show details |
| Photo | Address | Area | Beds / Baths | Price | Details |
|---|---|---|---|---|---|

|
#31
Old Dover Rd
Rochester, NH 03867
|
- sq. feet
|
1 baths 3 beds |
show details | |

|
#32
Frost Hill Rd, C O Gregory Jackman
Eliot, ME 03903
|
3,472 sq. feet
|
3 baths 4 beds |
show details | |

|
#33
Smoke St
Nottingham, NH 03290
|
4,452 sq. feet
|
2 baths 3 beds |
show details | |

|
#34
Ernest Ave Apt 4
Exeter, NH 03833
|
555 sq. feet
|
1 baths 1 beds |
show details | |

|
#35
Windbrook Dr
Epping, NH 03042
|
1,680 sq. feet
|
1 baths 2 beds |
show details | |

|
#36
Meaderboro Rd
Rochester, NH 03867
|
- sq. feet
|
2 baths 3 beds |
show details | |

|
#37
Keay Rd
Berwick, ME 03901
|
2,556 sq. feet
|
2 baths - beds |
show details | |

|
#38
Tatnic Rd
Wells, ME 04090
|
2,238 sq. feet
|
2 baths - beds |
show details | |

|
#39
Locksmith Ln
Wells, ME 04090
|
1,212 sq. feet
|
1 baths - beds |
show details | |

|
#40
Pine Hill Rd
Berwick, ME 03901
|
2,882 sq. feet
|
2 baths - beds |
show details |
| Photo | Address | Area | Beds / Baths | Price | Details |
|---|---|---|---|---|---|

|
#41
Olde Farm Way
Berwick, ME 03901
|
2,376 sq. feet
|
3 baths - beds |
show details | |

|
#42
Mead Hill Rd
Newmarket, NH 03857
|
- sq. feet
|
- baths - beds |
show details | |

|
#43
Portsmouth Ave # 3
Stratham, NH 03885
|
- sq. feet
|
- baths - beds |
show details | |

|
#44
Royal Dr, Unit 301
Somersworth, NH 03878
|
- sq. feet
|
- baths - beds |
show details | |

|
#45
Juniper Rd
North Hampton, NH 03862
|
- sq. feet
|
- baths - beds |
show details | |

|
#46
Fire Road 1
Strafford, NH 03884
|
- sq. feet
|
- baths - beds |
show details | |

|
#47
Central St Apt 33
Farmington, NH 03835
|
- sq. feet
|
- baths - beds |
show details | |

|
#48
T M Wentworth Rd
Lebanon, ME 04027
|
- sq. feet
|
- baths - beds |
show details | |

|
#49
Beech Hill Rd Lot 18
Exeter, NH 03833
|
- sq. feet
|
- baths - beds |
show details | |

|
Check over 1 million property listings on Foreclosure.com!
|
browse all offers | |||

Latest news about housing in Dover, NH collected exclusively by city-data.com from local newspapers, TV, and radio stations

 | Apartments, singles scene, and home prices in Dover (the gamut) (5 replies) |
| Looking for rentals in the Newmarket/Dover/Portsmouth/Southern Maine area (2 replies) |
| SFH vs Multi- homes. (8 replies) |
| NH Real Estate Market (52 replies) |
| BEST method for searching for apartments in NH (23 replies) |
| Low density housing is killing nh! (67 replies) |
Median year apartment built: 1983
Household type by relationship:
Households: 33,177- Male householders: 7,680 (2,377 living alone), Female householders: 7,072 (2,351 living alone)
6,232 spouses (6,177 opposite-sex spouses), 1,682 unmarried partners, (1,594 opposite-sex unmarried partners), 6,801 children (6,526 natural, 98 adopted, 175 stepchildren), 118 grandchildren, 147 brothers or sisters, 385 parents, 0 foster children, 283 other relatives, 1,781 non-relatives
- In group quarters: 991
Size of family households: 3,956 2-persons, 1,784 3-persons, 1,404 4-persons, 408 5-persons, 98 6-persons.
Size of nonfamily households: 5,130 1-person, 1,773 2-persons, 297 3-persons, 32 4-persons, 42 5-persons, 3 6-persons.
3,964 married couples with children.
1,269 single-parent households (237 men, 1,032 women).
92.5% of residents of Dover speak English at home.
1.7% of residents speak Spanish at home (60% speak English very well, 22% speak English well, 14% speak English not well, 4% don't speak English at all).
2.8% of residents speak other Indo-European language at home (76% speak English very well, 24% speak English well, 1% don't speak English at all).
2.3% of residents speak Asian or Pacific Island language at home (72% speak English very well, 13% speak English well, 15% speak English not well).
0.3% of residents speak other language at home (91% speak English very well, 9% speak English well).
Foreign born population: 2,372 (7.1%)
(60.3% of them are naturalized citizens)
| Here: | 6.2 |
| State: | 6.4 |
| Here: | 3.7 |
| State: | 4.0 |
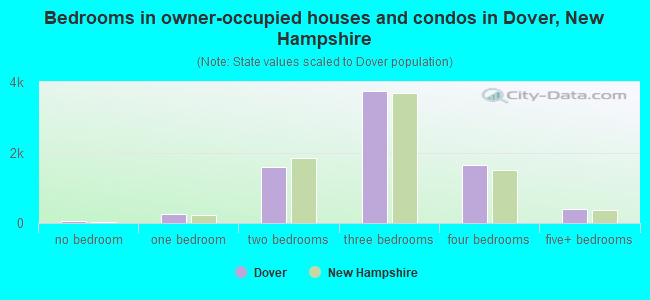
- Bedrooms in owner-occupied houses and condos in Dover, New Hampshire
- 48no bedroom
- 2651 bedroom
- 1,5862 bedrooms
- 3,7373 bedrooms
- 1,6544 bedrooms
- 4055+ bedrooms
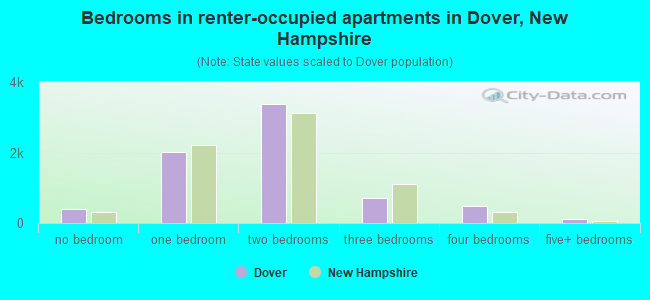
- Bedrooms in renter-occupied apartments in Dover, New Hampshire
- 388no bedroom
- 2,0221 bedroom
- 3,3802 bedrooms
- 7173 bedrooms
- 4894 bedrooms
- 1275+ bedrooms
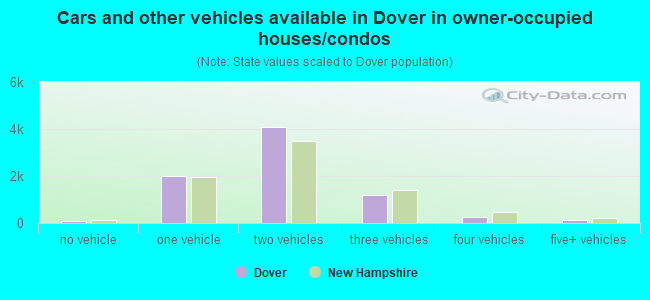
- Cars and other vehicles available in Dover in owner-occupied houses/condos
- 76no vehicle
- 1,9851 vehicle
- 4,0822 vehicles
- 1,1853 vehicles
- 2424 vehicles
- 1245+ vehicles
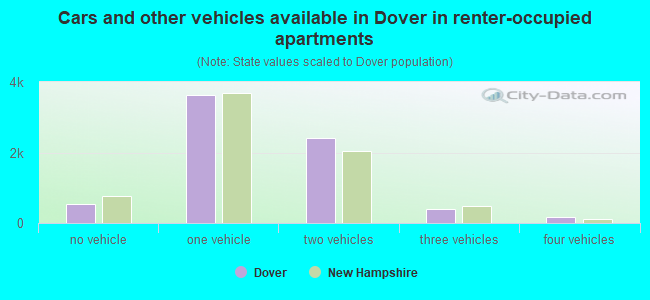
- Cars and other vehicles available in Dover in renter-occupied apartments
- 535no vehicle
- 3,6301 vehicle
- 2,3992 vehicles
- 4023 vehicles
- 1574 vehicles
- 05+ vehicles
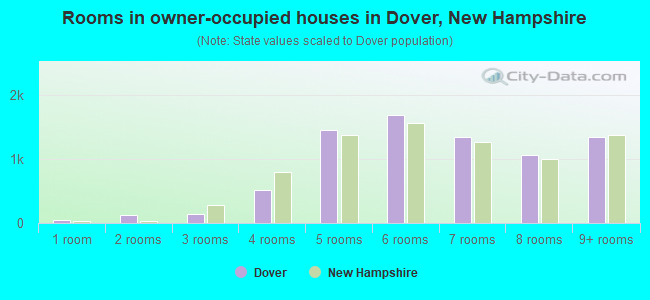
- Rooms in owner-occupied houses in Dover, New Hampshire
- 481 room
- 1262 rooms
- 1443 rooms
- 5164 rooms
- 1,4425 rooms
- 1,6836 rooms
- 1,3377 rooms
- 1,0588 rooms
- 1,3409+ rooms
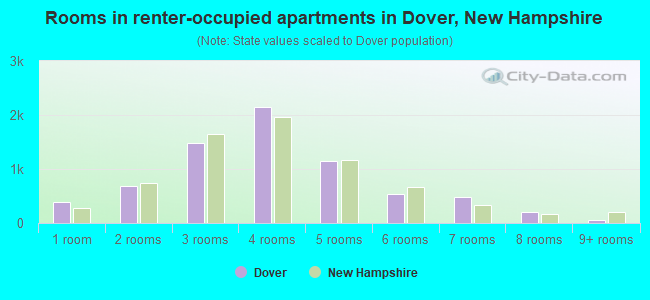
- Rooms in renter-occupied apartments in Dover, New Hampshire
- 3881 room
- 6772 rooms
- 1,4843 rooms
- 2,1504 rooms
- 1,1415 rooms
- 5456 rooms
- 4907 rooms
- 1998 rooms
- 509+ rooms
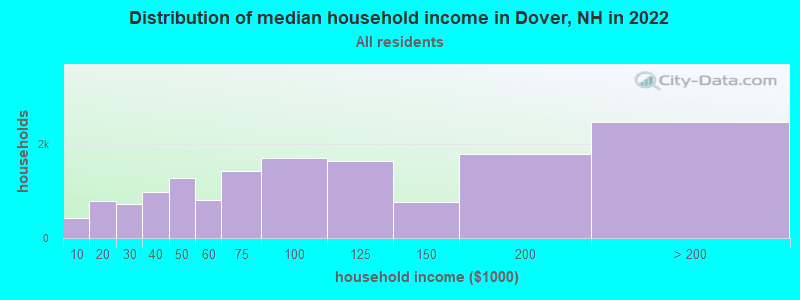
Dover, NH household income distribution

- 422Less than $10,000
- 800$10,000 to $19,999
- 727$20,000 to $29,999
- 974$30,000 to $39,999
- 1,281$40,000 to $49,999
- 814$50,000 to $59,999
- 1,429$60,000 to $74,999
- 1,714$75,000 to $99,999
- 1,640$100,000 to $124,999
- 765$125,000 to $149,999
- 1,802$150,000 to $199,999
- 2,481$200,000 or more
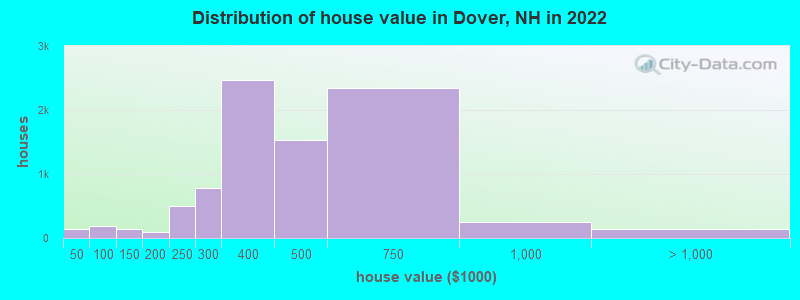
Home value of owner - occupied houses in 2022 in Dover, NH
-
- 11Less than $10,000
- 65$20,000 to $24,999
- 9$25,000 to $29,999
- 12$30,000 to $34,999
- 26$35,000 to $39,999
- 17$40,000 to $49,999
- 16$60,000 to $69,999
- 45$80,000 to $89,999
- 112$90,000 to $99,999
- 36$100,000 to $124,999
- 96$125,000 to $149,999
- 25$150,000 to $174,999
- 60$175,000 to $199,999
- 496$200,000 to $249,999
- 781$250,000 to $299,999
- 2,463$300,000 to $399,999
- 1,534$400,000 to $499,999
- 2,350$500,000 to $749,999
- 251$750,000 to $999,999
- 68$1,000,000 to $1,499,999
- 30$1,500,000 to $1,999,999
- 37$2,000,000 or more
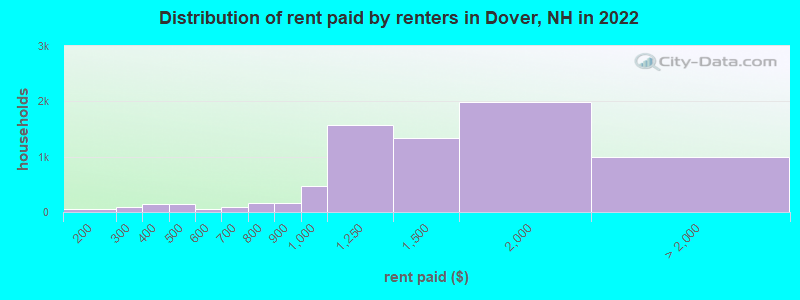
Rent paid by renters in 2022 in Dover, NH
-
- 53$150 to $199
- 31$200 to $249
- 62$250 to $299
- 59$300 to $349
- 76$350 to $399
- 56$400 to $449
- 90$450 to $499
- 36$500 to $549
- 14$550 to $599
- 28$600 to $649
- 61$650 to $699
- 87$700 to $749
- 70$750 to $799
- 157$800 to $899
- 460$900 to $999
- 1,568$1,000 to $1,249
- 1,334$1,250 to $1,499
- 1,986$1,500 to $1,999
- 547$2,000 to $2,499
- 134$2,500 to $2,999
- 67$3,000 to $3,499
- 148$3,500 or more
- 94No cash rent
Percentage of workers working in this county: 59.4%
Number of people working at home: 3,789 (19.4% of all workers)
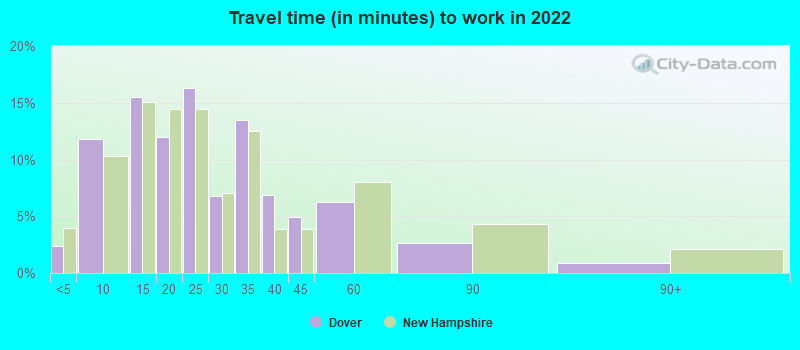
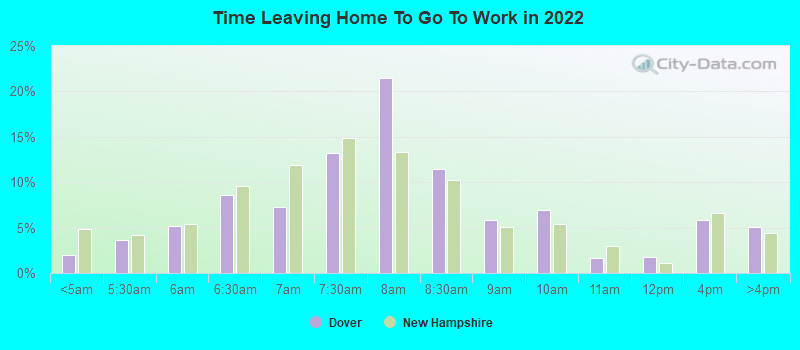
Travel time to work (commute)
- Less than 5 minutes: 420
- 5 to 9 minutes: 1,483
- 10 to 14 minutes: 2,879
- 15 to 19 minutes: 2,592
- 20 to 24 minutes: 3,169
- 25 to 29 minutes: 1,043
- 30 to 34 minutes: 1,961
- 35 to 39 minutes: 869
- 40 to 44 minutes: 342
- 45 to 59 minutes: 559
- 60 to 89 minutes: 773
- 90 or more minutes: 327
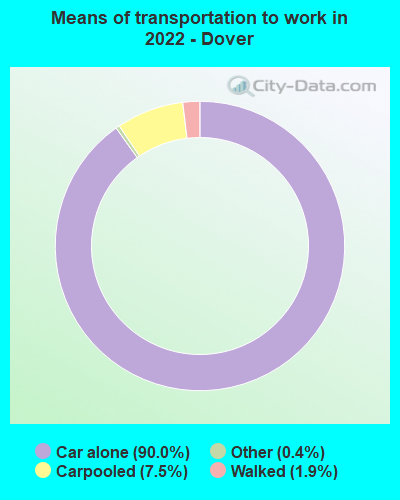
Means of transportation to work:
- Drove a car alone: 14,983 (72.4%)
- Carpooled: 1,493 (7.2%)
- Bus: 5 (0.0%)
- Taxi: 80 (0.4%)
- Bicycle: 18 (0.1%)
- Walked: 320 (1.5%)
- Worked at home: 3,789 (18.3%)
- Unemployment by race in 2022
- Unemployment rate for White non-Hispanic residents
- 2.2%Males
- 2.3%Females
- Unemployment rate for two or more race residents
- 6.8%Females
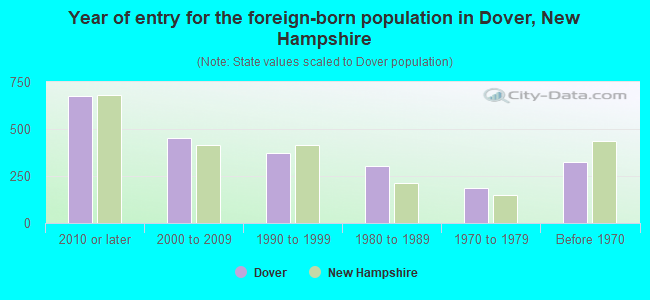
- Year of entry for the foreign-born population in Dover, New Hampshire
- 6752010 or later
- 4512000 to 2009
- 3721990 to 1999
- 3011980 to 1989
- 1841970 to 1979
- 325Before 1970
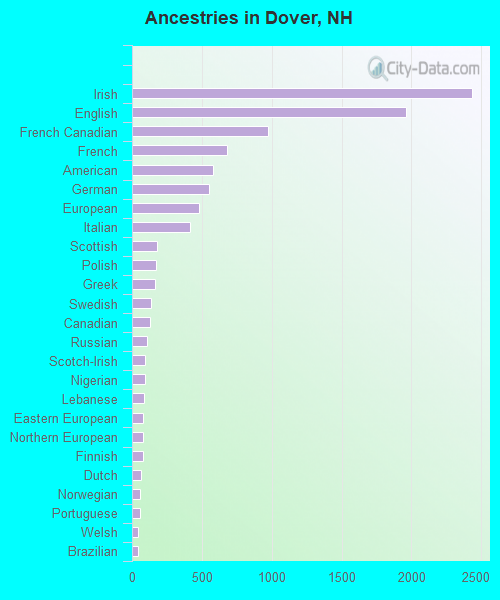
First ancestries reported:
- Irish: 2,433 (19.9%)
- English: 1,960 (16.0%)
- French Canadian: 972 (7.9%)
- French: 680 (5.5%)
- American: 577 (4.7%)
- German: 548 (4.5%)
- European: 482 (3.9%)
- Italian: 412 (3.4%)
- Scottish: 182 (1.5%)
- Polish: 169 (1.4%)
- Greek: 165 (1.3%)
- Swedish: 139 (1.1%)
- Canadian: 130 (1.1%)
- Russian: 106 (0.9%)
- Scotch-Irish: 94 (0.8%)
- Nigerian: 91 (0.7%)
- Lebanese: 84 (0.7%)
- Eastern European: 78 (0.6%)
- Northern European: 77 (0.6%)
- Finnish: 77 (0.6%)
- Dutch: 62 (0.5%)
- Norwegian: 55 (0.4%)
- Portuguese: 54 (0.4%)
- Welsh: 41 (0.3%)
- Brazilian: 40 (0.3%)
- West Indian: 38 (0.3%)
- Jamaican: 38 (0.3%)
- African: 30 (0.2%)
- Ukrainian: 25 (0.2%)
- British: 15 (0.1%)
- Basque: 14 (0.1%)
- Hungarian: 14 (0.1%)
- Swiss: 13 (0.1%)
- Austrian: 10 (0.08%)
- Danish: 10 (0.08%)
- Lithuanian: 9 (0.07%)
- Scandinavian: 7 (0.06%)
- Celtic: 7 (0.06%)
- Haitian: 7 (0.06%)
- Albanian: 6 (0.05%)
- Sudanese: 5 (0.04%)
- Armenian: 1 (0.01%)
Most common places of birth for foreign-born residents (%):
| Dover: | 22.0% (429) |
| New Hampshire: | 9.1% (7,609) |
| Dover: | 9.7% (190) |
| New Hampshire: | 9.1% (7,618) |
| Dover: | 8.3% (162) |
| New Hampshire: | 3.3% (2,768) |
| Dover: | 7.4% (144) |
| New Hampshire: | 1.3% (1,068) |
| Dover: | 5.7% (112) |
| New Hampshire: | 0.6% (527) |
| Dover: | 4.5% (88) |
| New Hampshire: | 7.0% (5,842) |
| Dover: | 4.2% (83) |
| New Hampshire: | 0.6% (464) |
| Dover: | 4.2% (82) |
| New Hampshire: | 0.9% (719) |
| Dover: | 4.1% (81) |
| New Hampshire: | 3.3% (2,742) |
| Dover: | 3.9% (76) |
| New Hampshire: | 0.6% (460) |
| Dover: | 3.8% (74) |
| New Hampshire: | 0.6% (512) |
| Dover: | 2.2% (42) |
| New Hampshire: | 2.2% (1,838) |
| Dover: | 2.1% (41) |
| New Hampshire: | 3.6% (2,964) |
| Dover: | 1.7% (34) |
| New Hampshire: | 1.0% (845) |
| Dover: | 1.7% (34) |
| New Hampshire: | 1.1% (897) |
Place of birth for U.S.-born residents:
- This state: 14,373
- Other state: 15,739
- Northeast: 9,528
- Midwest: 1,646
- South: 2,352
- West: 2,529
82.2% of Dover residents lived in the same house 1 years ago.
Out of people who lived in different houses, 28.3% lived in this county.
Out of people who lived in different counties, 46.6% lived in New Hampshire.
| Dover: | 82.2% |
| State average: | 89.8% |
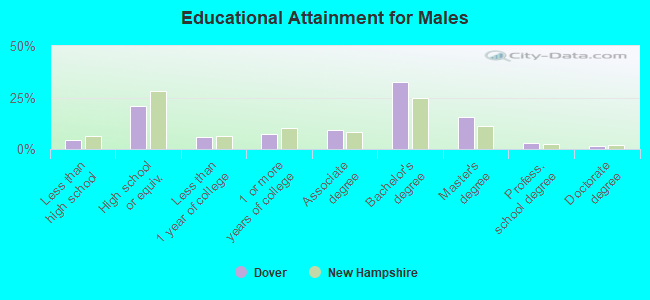
Education attainment for males 25 years and older:
- No schooling: 76
- Nursery to 4th grade: 7
- 5th and 6th grade: 13
- 7th and 8th grade: 161
- 9th grade: 94
- 10th grade: 106
- 11th grade: 81
- 12th grade, no diploma: 21
- High school graduate (or equivalency): 2,578
- Less than 1 year of college: 717
- Some college more than 1 year, no degree: 882
- Associate degree: 1,160
- Bachelor's degree: 3,985
- Master's degree: 1,915
- Professional school degree: 331
- Doctorate degree: 181
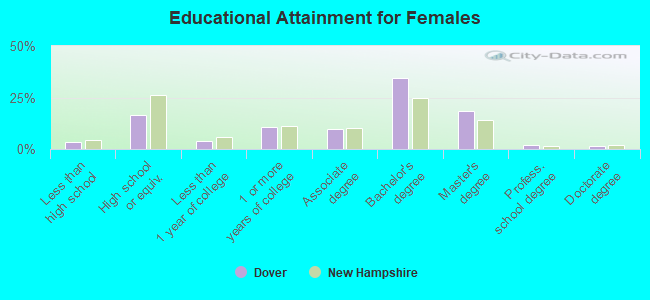
Education attainment for females 25 years and older:
- No schooling: 4
- Nursery to 4th grade: 0
- 5th and 6th grade: 0
- 7th and 8th grade: 45
- 9th grade: 15
- 10th grade: 95
- 11th grade: 58
- 12th grade, no diploma: 186
- High school graduate (or equivalency): 2,059
- Less than 1 year of college: 489
- Some college more than 1 year, no degree: 1,334
- Associate degree: 1,202
- Bachelor's degree: 4,304
- Master's degree: 2,293
- Professional school degree: 264
- Doctorate degree: 158
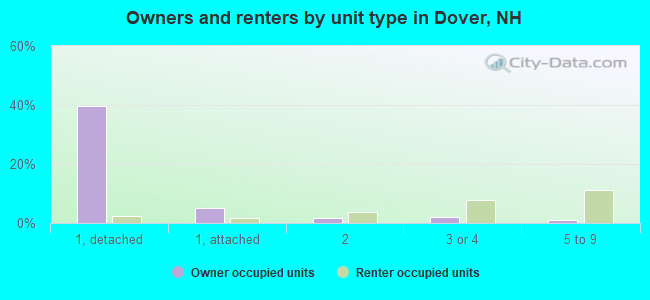
Housing units in structures:
- One, detached: 6,497
- One, attached: 1,003
- Two: 1,128
- 3 or 4: 1,861
- 5 to 9: 1,378
- 10 to 19: 847
- 20 to 49: 1,573
- 50 or more: 756
- Mobile homes: 451
Median worth of mobile homes: $158,063
Housing units lacking complete kitchen facilities in 2022: 1.3%
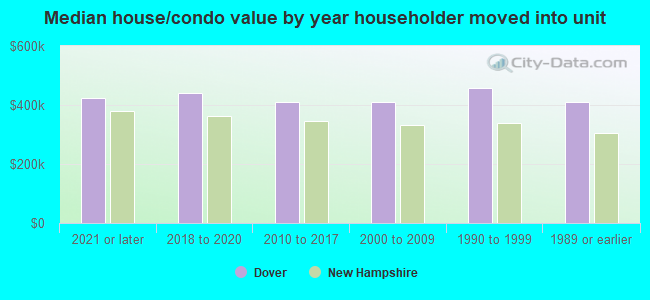
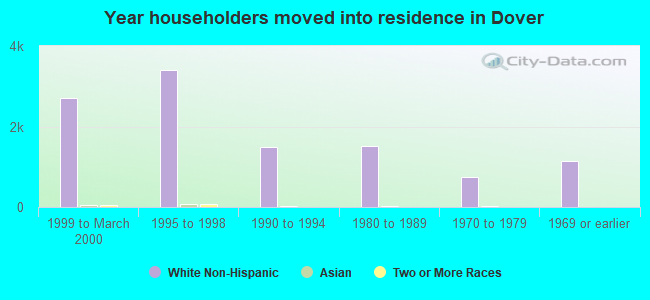
House/condo owner moved in on average 9 years ago
Renter moved in on average 1 years ago
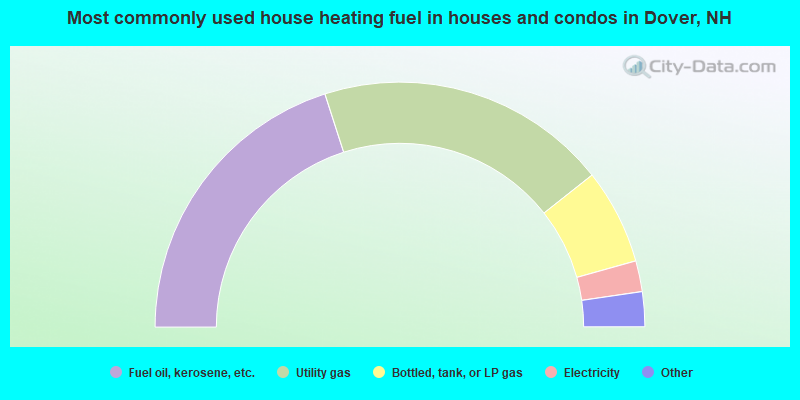
- 40.1%Fuel oil, kerosene, etc.
- 38.6%Utility gas
- 12.6%Bottled, tank, or LP gas
- 4.1%Electricity
- 2.4%Wood
- 1.4%Other fuel
- 0.8%Solar energy
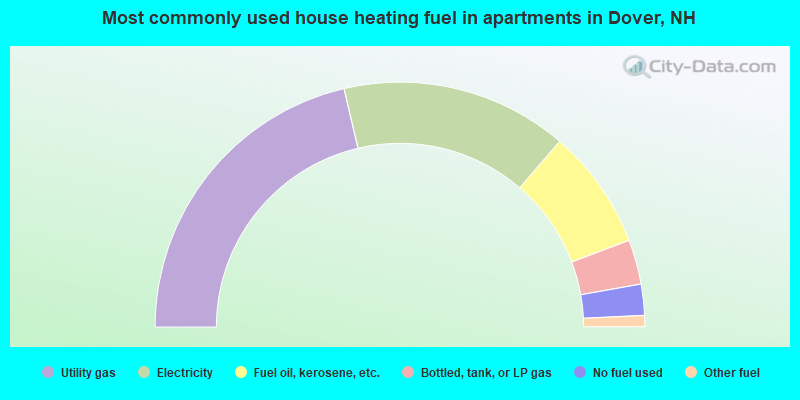
- 42.7%Utility gas
- 30.0%Electricity
- 15.9%Fuel oil, kerosene, etc.
- 5.9%Bottled, tank, or LP gas
- 4.1%No fuel used
- 1.5%Other fuel
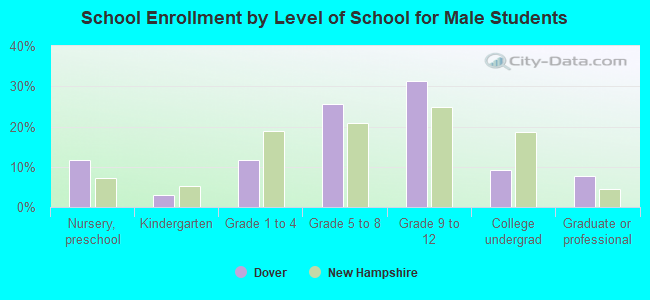
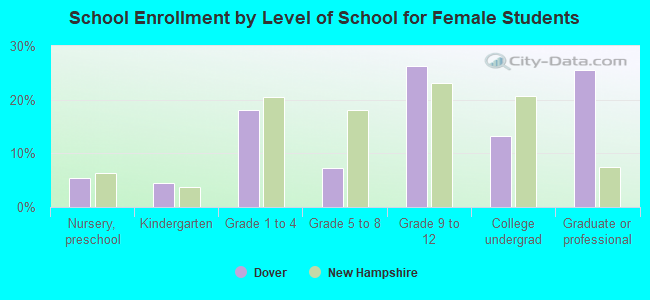
Private vs. public school enrollment:
| Here: | 26.0% |
| New Hampshire: | 11.4% |
| Here: | 2.0% |
| New Hampshire: | 14.0% |
| Here: | 17.2% |
| New Hampshire: | 38.0% |