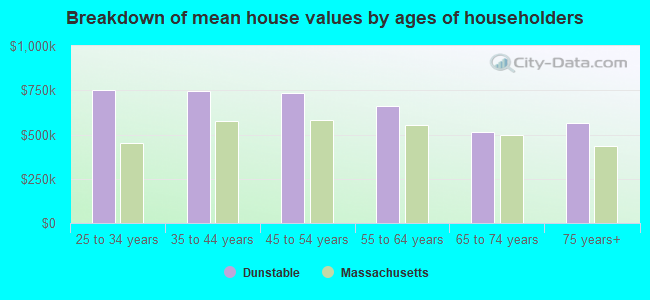
Median price asked for vacant for-sale houses and condos in 2022 in this county: $1,068,910.
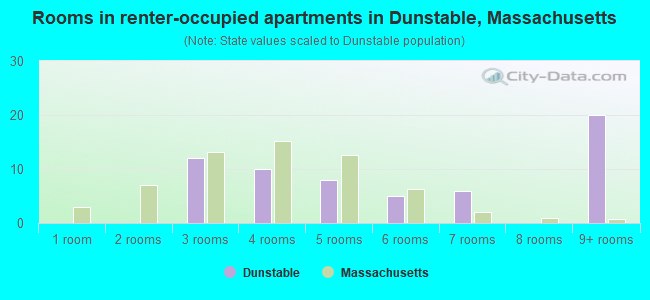
Median contract rent in 2022: $1,699 (lower quartile is $1,458, upper quartile is over $2,000)
Median rent asked for vacant for-rent units in 2022: $1,388
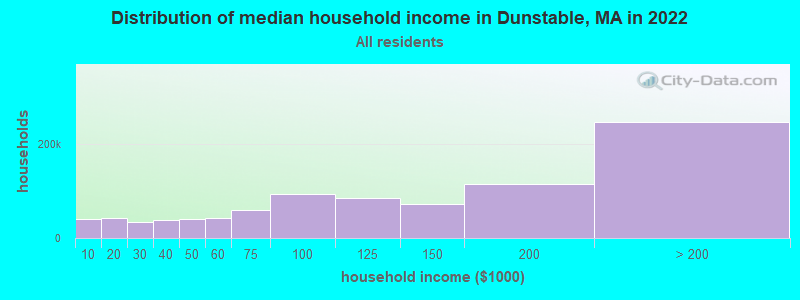
Median gross rent in Dunstable, MA in 2022: over $2,000
Housing units in Dunstable with a mortgage: 639 (60 second mortgage, 84 home equity loan, 4 both second mortgage and home equity loan) Houses without a mortgage: 127
In family households: 1,161,600 (250,263 male householders, 116,393 female householders)
287,332 spouses, 410,462 children (392,286 natural, 9,871 adopted, 8,305 stepchildren), 16,644 grandchildren, 14,569 brothers or sisters, 15,064 parents, foster children, 15,023 other relatives, 25,838 non-relatives
In nonfamily households: 286,073 (95,244 male householders (67,197 living alone)), 118,788 female householders (94,319 living alone)), 72,041 nonrelatives
In group quarters: 55,412 (13,773 institutionalized population)
252,928 married couples with children.
55,356 single-parent households (9,721 men, 45,635 women).
95.7% of residents of Dunstable speak English at home.
1.5% of residents speak Spanish at home (100% speak English very well).
2.3% of residents speak other Indo-European language at home (80% speak English very well, 7% speak English well, 13% speak English not well).
0.5% of residents speak Asian or Pacific Island language at home (100% speak English very well).
Foreign born population: 162 (5.2%)
(74.7% of them are naturalized citizens)
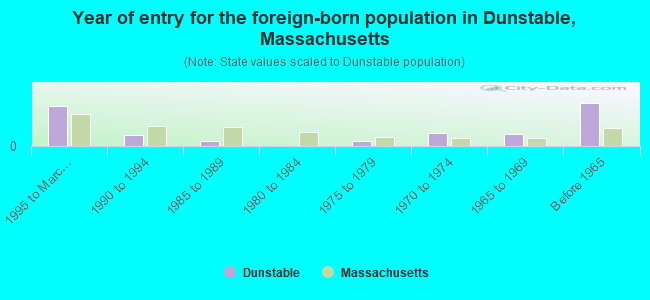
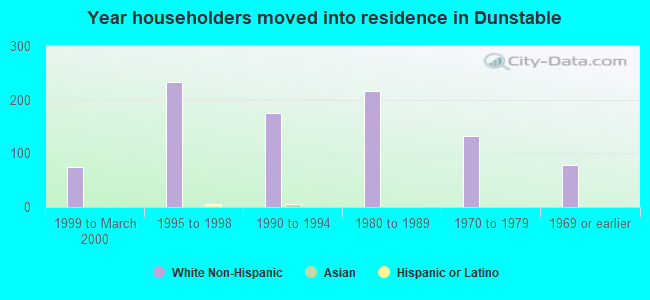
Year of entry for the foreign-born population in Dunstable, Massachusetts
301995 to March 2000
81990 to 1994
41985 to 1989
01980 to 1984
41975 to 1979
101970 to 1974
91965 to 1969
32Before 1965
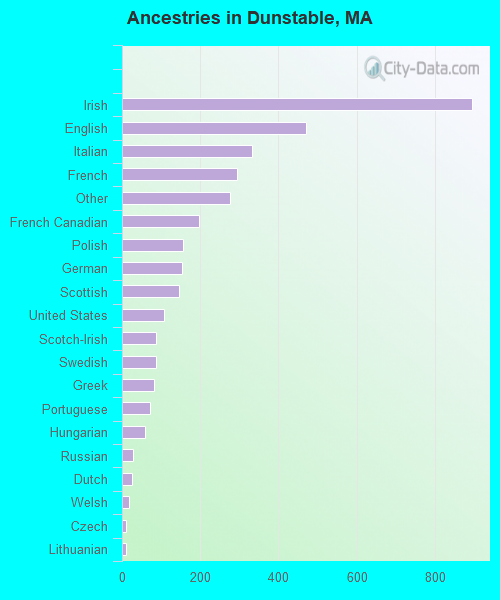
First ancestries reported:
Irish: 894 (25.4%)
English: 471 (13.4%)
Italian: 333 (9.5%)
French: 295 (8.4%)
Other: 276 (7.8%)
French Canadian: 197 (5.6%)
Polish: 155 (4.4%)
German: 153 (4.4%)
Scottish: 146 (4.2%)
United States: 107 (3.0%)
Scotch-Irish: 88 (2.5%)
Swedish: 86 (2.4%)
Greek: 82 (2.3%)
Portuguese: 72 (2.0%)
Hungarian: 59 (1.7%)
Russian: 29 (0.8%)
Dutch: 25 (0.7%)
Welsh: 17 (0.5%)
Czech: 11 (0.3%)
Lithuanian: 11 (0.3%)
Danish: 5 (0.1%)
Norwegian: 5 (0.1%)
Most common places of birth for foreign-born residents (%):
United Kingdom
Dunstable:
26.8% (26)
Massachusetts:
3.3% (25,403)
Romania
Dunstable:
10.3% (10)
Massachusetts:
0.3% (2,058)
Poland
Dunstable:
8.2% (8)
Massachusetts:
1.8% (13,543)
Other Northern Europe
Dunstable:
5.2% (5)
Massachusetts:
0.4% (3,051)
Germany
Dunstable:
5.2% (5)
Massachusetts:
1.9% (14,883)
China, excluding Hong Kong and Taiwan
Dunstable:
5.2% (5)
Massachusetts:
5.1% (39,255)
Taiwan
Dunstable:
5.2% (5)
Massachusetts:
0.9% (7,258)
Australia
Dunstable:
5.2% (5)
Massachusetts:
0.2% (1,855)
Colombia
Dunstable:
5.2% (5)
Massachusetts:
2.0% (15,286)
Sweden
Dunstable:
4.1% (4)
Massachusetts:
0.3% (2,135)
Portugal
Dunstable:
4.1% (4)
Massachusetts:
8.6% (66,627)
Hungary
Dunstable:
4.1% (4)
Massachusetts:
0.2% (1,710)
Malaysia
Dunstable:
4.1% (4)
Massachusetts:
0.1% (1,104)
Mexico
Dunstable:
4.1% (4)
Massachusetts:
1.0% (7,867)
Cuba
Dunstable:
3.1% (3)
Massachusetts:
0.5% (3,868)
Place of birth for U.S.-born residents:
This state: 1,957
Other state: 761
Northeast: 578
Midwest: 124
South: 44
West: 15
72% of Dunstable residents lived in the same house 5 years ago. Out of people who lived in different houses, 73% lived in this county. Out of people who lived in different counties, 16% lived in Massachusetts.
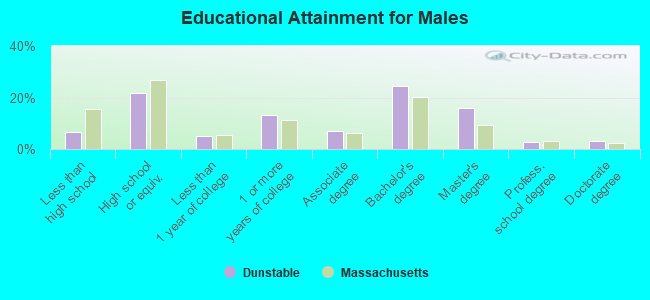
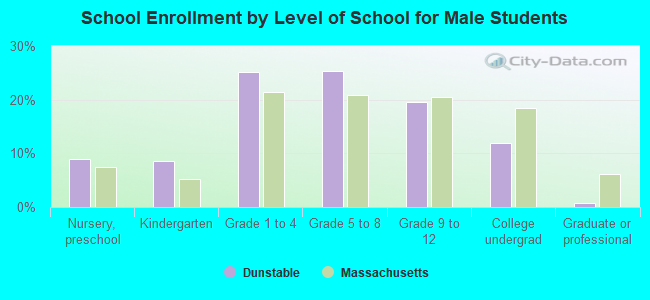
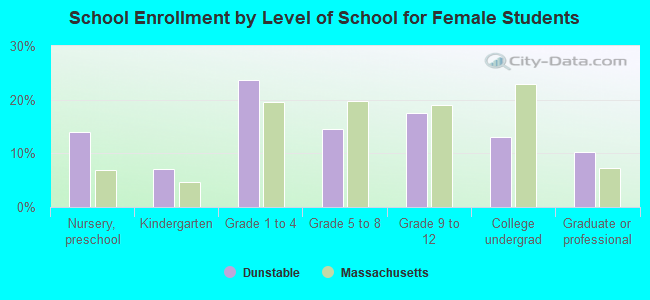
Education attainment for males 25 years and older:
No schooling: 0
Nursery to 4th grade: 0
5th and 6th grade: 4
7th and 8th grade: 4
9th grade: 4
10th grade: 0
11th grade: 13
12th grade, no diploma: 34
High school graduate (or equivalency): 193
Less than 1 year of college: 46
Some college more than 1 year, no degree: 118
Associate degree: 62
Bachelor's degree: 216
Master's degree: 140
Professional school degree: 25
Doctorate degree: 26
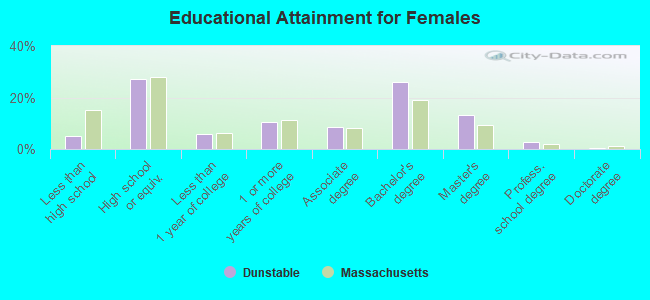
Education attainment for females 25 years and older:
No schooling: 0
Nursery to 4th grade: 0
5th and 6th grade: 0
7th and 8th grade: 0
9th grade: 15
10th grade: 0
11th grade: 13
12th grade, no diploma: 20
High school graduate (or equivalency): 260
Less than 1 year of college: 57
Some college more than 1 year, no degree: 100
Associate degree: 82
Bachelor's degree: 248
Master's degree: 125
Professional school degree: 27
Doctorate degree: 5
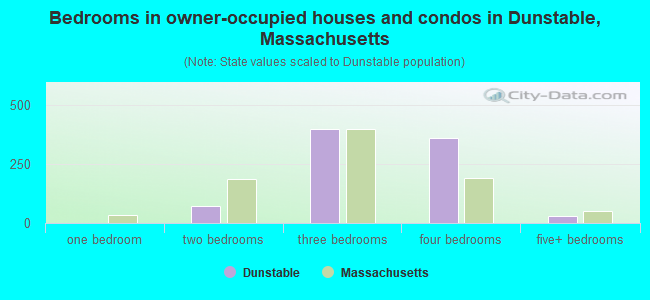
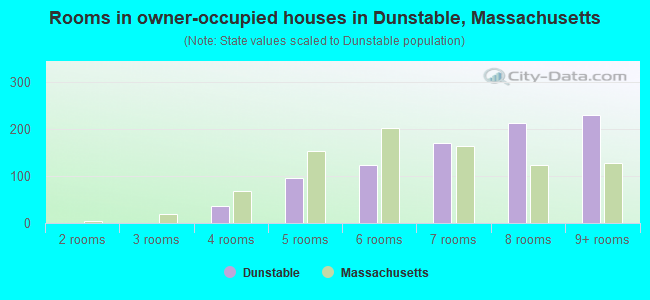
Housing units in structures:
One, detached: 906
One, attached: 18
Two: 14
3 or 4: 6
Housing units lacking complete kitchen facilities: 0.4%