Housing density: 302 houses/condos per square mile
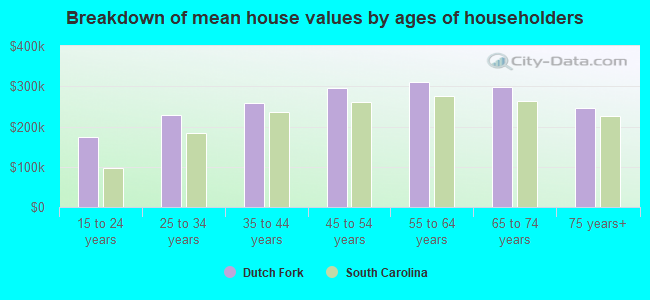
Median price asked for vacant for-sale houses and condos in 2022 in this county: $201,780.
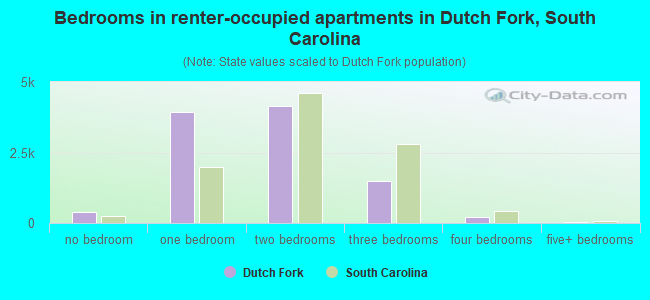
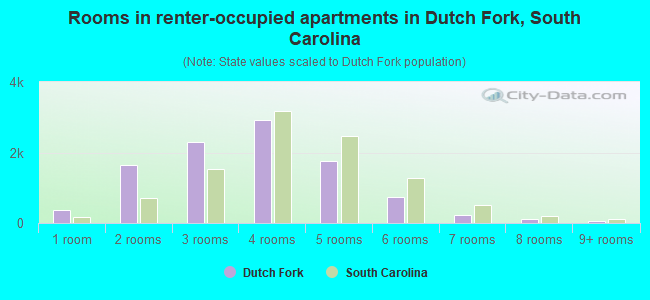
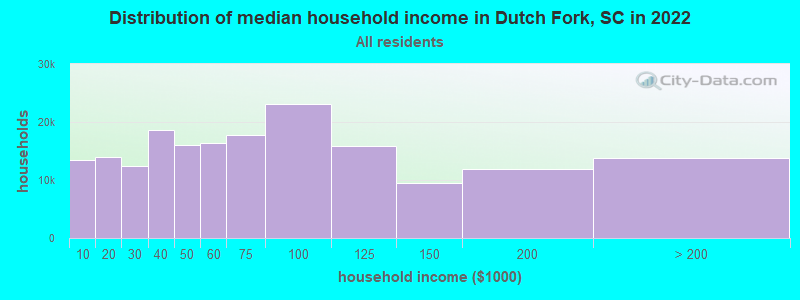
Median contract rent in 2022: $1,037 (lower quartile is $919, upper quartile is $1,289)
Median rent asked for vacant for-rent units in 2022: $1,053
Median gross rent in Dutch Fork, SC in 2022: $1,243
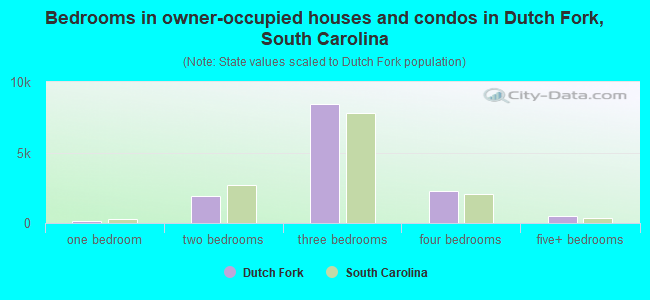
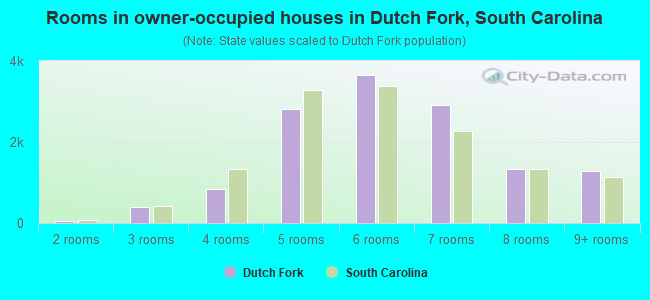
Housing units in Dutch Fork with a mortgage: 10,123 (1,347 second mortgage, 1,226 home equity loan, 11 both second mortgage and home equity loan) Houses without a mortgage: 1,766
In family households: 279,972 (52,417 male householders, 36,940 female householders)
57,541 spouses, 101,939 children (94,993 natural, 2,417 adopted, 4,529 stepchildren), 9,926 grandchildren, 4,371 brothers or sisters, 2,760 parents, foster children, 5,245 other relatives, 7,479 non-relatives
In nonfamily households: 72,530 (25,060 male householders (18,816 living alone)), 30,777 female householders (25,012 living alone)), 16,693 nonrelatives
In group quarters: 32,002 (9,551 institutionalized population)
43,283 married couples with children.
23,238 single-parent households (3,019 men, 20,219 women).
94.3% of residents of Dutch Fork speak English at home.
2.5% of residents speak Spanish at home (59% speak English very well, 25% speak English well, 14% speak English not well, 1% don't speak English at all).
1.7% of residents speak other Indo-European language at home (77% speak English very well, 14% speak English well, 8% speak English not well).
1.1% of residents speak Asian or Pacific Island language at home (49% speak English very well, 27% speak English well, 23% speak English not well, 1% don't speak English at all).
0.4% of residents speak other language at home (62% speak English very well, 35% speak English well, 3% speak English not well).
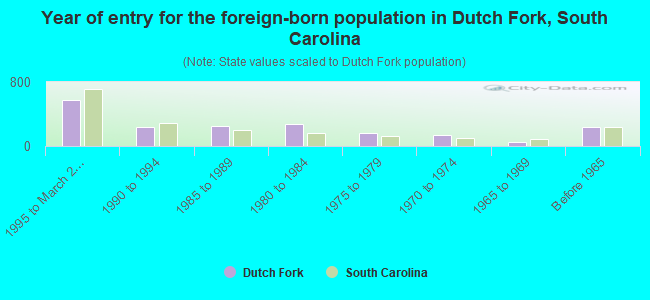
Foreign born population: 3,421 (4.4%)
(55.1% of them are naturalized citizens)
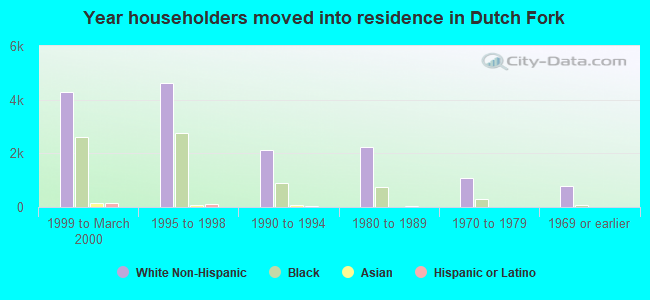
Year of entry for the foreign-born population in Dutch Fork, South Carolina
5731995 to March 2000
2421990 to 1994
2551985 to 1989
2771980 to 1984
1571975 to 1979
1361970 to 1974
481965 to 1969
236Before 1965
Most common places of birth for foreign-born residents (%):
Canada
Dutch Fork:
10.5% (202)
South Carolina:
4.8% (5,512)
Korea
Dutch Fork:
7.4% (142)
South Carolina:
2.6% (3,030)
Germany
Dutch Fork:
6.9% (132)
South Carolina:
6.8% (7,873)
Vietnam
Dutch Fork:
6.2% (119)
South Carolina:
2.7% (3,098)
India
Dutch Fork:
5.8% (111)
South Carolina:
4.4% (5,130)
China, excluding Hong Kong and Taiwan
Dutch Fork:
4.8% (93)
South Carolina:
2.9% (3,314)
United Kingdom
Dutch Fork:
4.5% (86)
South Carolina:
5.9% (6,890)
Panama
Dutch Fork:
2.8% (53)
South Carolina:
1.0% (1,124)
Philippines
Dutch Fork:
2.6% (50)
South Carolina:
4.4% (5,108)
Mexico
Dutch Fork:
2.5% (49)
South Carolina:
27.3% (31,719)
Japan
Dutch Fork:
2.2% (43)
South Carolina:
1.8% (2,125)
Other Eastern Africa
Dutch Fork:
2.2% (42)
South Carolina:
0.5% (585)
Thailand
Dutch Fork:
2.2% (42)
South Carolina:
0.8% (906)
Iran
Dutch Fork:
1.9% (37)
South Carolina:
0.5% (628)
Italy
Dutch Fork:
1.9% (36)
South Carolina:
1.0% (1,130)
Nigeria
Dutch Fork:
1.8% (35)
South Carolina:
0.4% (422)
Taiwan
Dutch Fork:
1.8% (34)
South Carolina:
0.7% (795)
Other Western Asia
Dutch Fork:
1.7% (33)
South Carolina:
0.2% (230)
Hong Kong
Dutch Fork:
1.7% (33)
South Carolina:
0.4% (432)
Greece
Dutch Fork:
1.7% (32)
South Carolina:
0.9% (1,082)
Colombia
Dutch Fork:
1.6% (31)
South Carolina:
2.9% (3,394)
Place of birth for U.S.-born residents:
This state: 34,603
Other state: 22,313
Northeast: 4,930
Midwest: 3,814
South: 12,142
West: 1,427
43% of Dutch Fork residents lived in the same house 5 years ago. Out of people who lived in different houses, 39% lived in this county. Out of people who lived in different counties, 64% lived in South Carolina.
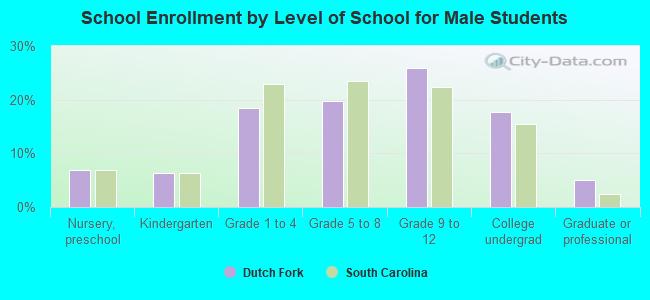
Education attainment for males 25 years and older:
No schooling: 43
Nursery to 4th grade: 8
5th and 6th grade: 93
7th and 8th grade: 168
9th grade: 183
10th grade: 316
11th grade: 606
12th grade, no diploma: 722
High school graduate (or equivalency): 4,231
Less than 1 year of college: 918
Some college more than 1 year, no degree: 3,303
Associate degree: 1,532
Bachelor's degree: 4,371
Master's degree: 1,092
Professional school degree: 409
Doctorate degree: 385
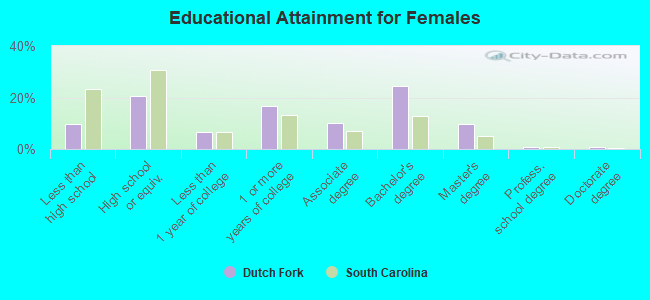
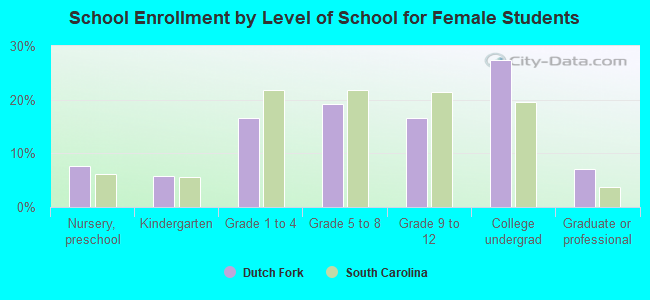
Education attainment for females 25 years and older:
No schooling: 68
Nursery to 4th grade: 96
5th and 6th grade: 52
7th and 8th grade: 280
9th grade: 228
10th grade: 216
11th grade: 328
12th grade, no diploma: 627
High school graduate (or equivalency): 3,946
Less than 1 year of college: 1,275
Some college more than 1 year, no degree: 3,180
Associate degree: 1,968
Bachelor's degree: 4,715
Master's degree: 1,836
Professional school degree: 168
Doctorate degree: 184
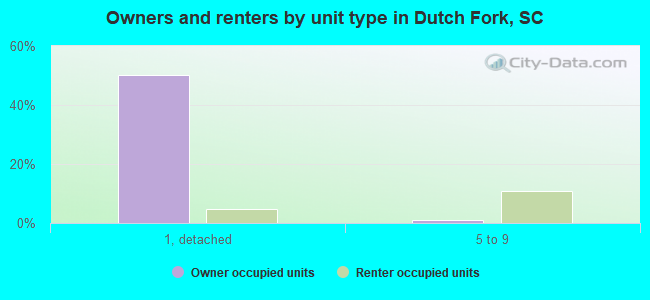
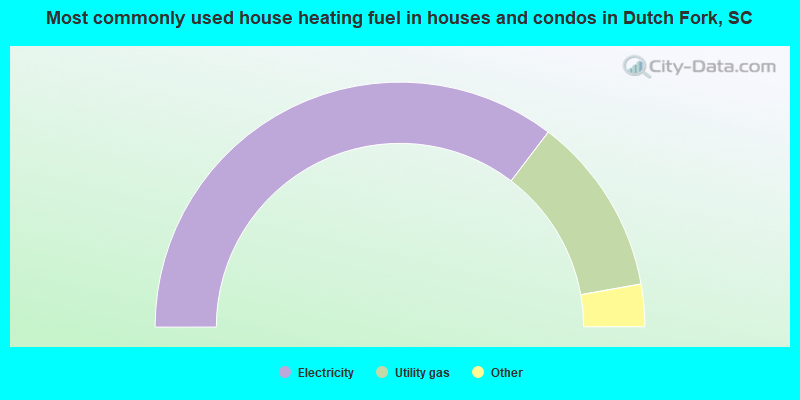
Housing units in structures:
One, detached: 13,382
One, attached: 795
Two: 522
3 or 4: 1,494
5 to 9: 3,138
10 to 19: 2,711
20 to 49: 1,255
50 or more: 1,336
Mobile homes: 563
Median worth of mobile homes: $61,762
Housing units lacking complete plumbing facilities: 0.5%
Housing units lacking complete kitchen facilities: 0.4%