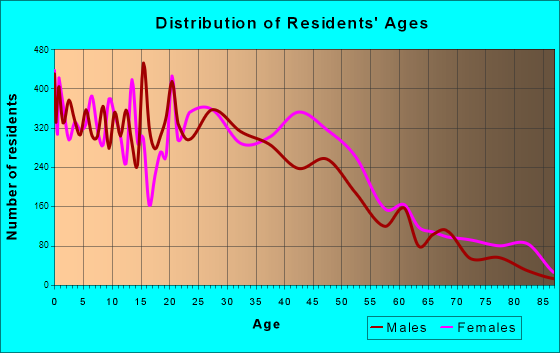
East Point, GA (Georgia) Houses and Residents
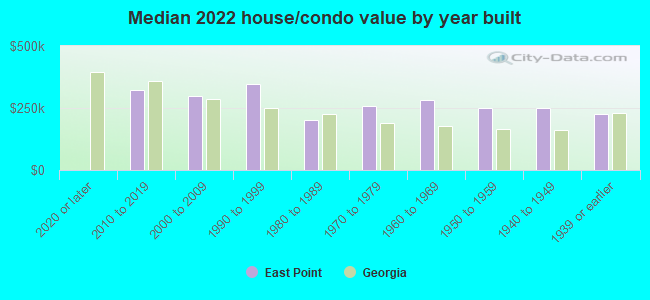
| East Point: | $243,924 |
| Georgia: | $297,400 |
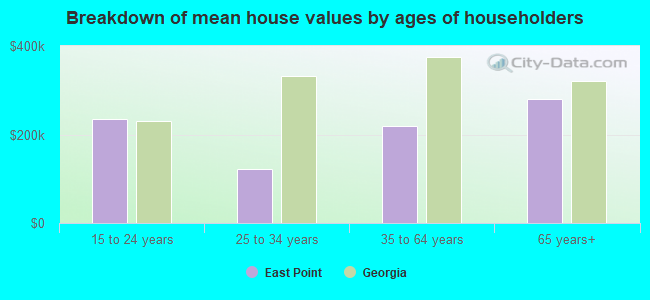
Mean price in 2022:
Detached houses: $261,621
Here: $261,621 State: $376,364 Townhouses or other attached units: $179,132
Here: $179,132 State: $341,709 In 2-unit structures: $202,705
Here: $202,705 State: $269,631 In 5-or-more-unit structures: $184,849
Here: $184,849 State: $370,730 Mobile homes: $37,952
Here: $37,952 State: $102,413
Total population: 35,488 (All urban)
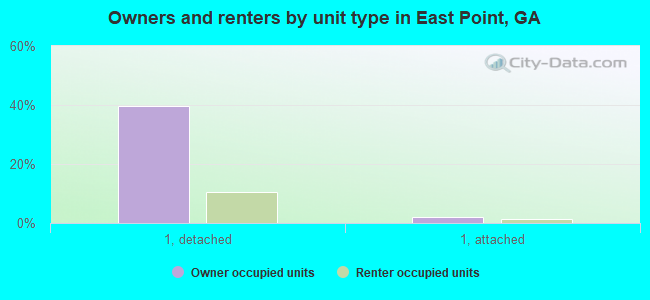
Houses: 18,654 (16,362 occupied: 6,951 owner occupied, 9,580 renter occupied)
| % of renters here: | 58% |
| State: | 34% |
Housing density: 1,356 houses/condos per square mile
Median price asked for vacant for-sale houses and condos in 2022: $156,621.
Median contract rent in 2022: $1,083 (lower quartile is $902, upper quartile is $1,300)
Median rent asked for vacant for-rent units in 2022: $1,280
Median gross rent in East Point, GA in 2022: $1,315
Housing units in East Point with a mortgage: 5,461 (261 second mortgage, 0 home equity loan, 197 both second mortgage and home equity loan)
Houses without a mortgage: 62
Median household income for houses/condos with a mortgage: $85,197
Median household income for apartments without a mortgage: $69,308
Median monthly housing costs: $1,297
Compare current foreclosures near East Point, GA:
| Photo | Address | Area | Beds / Baths | Price | Details |
|---|---|---|---|---|---|

|
#1
Charlotte Blvd
Stockbridge, GA 30281
|
2,200 sq. feet
|
2 baths 3 beds |
$290,000
|
show details |

|
#2
Westmont Rd SW
Atlanta, GA 30311
|
1,338 sq. feet
|
1 baths 2 beds |
$190,000
|
show details |

|
#3
Clay Rd
Austell, GA 30106
|
1,412 sq. feet
|
2 baths 3 beds |
$290,000
|
show details |

|
#4
Bell Flower Ct
Stone Mountain, GA 30088
|
- sq. feet
|
2 baths 4 beds |
$249,900
|
show details |

|
#5
Ivy Ridge Dr SE
Atlanta, GA 30339
|
1,709 sq. feet
|
2 baths 2 beds |
show details | |

|
#6
Peachtree Road NE
Atlanta, GA 30309
|
741 sq. feet
|
1 baths 1 beds |
show details | |

|
#7
Coventry Rd Apt 11b
Decatur, GA 30030
|
923 sq. feet
|
1 baths 2 beds |
show details | |

|
#8
Grant Cir SE Unit 404
Atlanta, GA 30315
|
1,250 sq. feet
|
2 baths 2 beds |
show details | |

|
#9
Bayrose Cir
Atlanta, GA 30344
|
1,326 sq. feet
|
3 baths 3 beds |
show details | |

|
#10
Peachtree St NE Unit 3415
Atlanta, GA 30309
|
2,416 sq. feet
|
3 baths 3 beds |
show details |
| Photo | Address | Area | Beds / Baths | Price | Details |
|---|---|---|---|---|---|

|
#11
Caroline St NE Apt 203
Atlanta, GA 30307
|
1,072 sq. feet
|
1 baths 1 beds |
show details | |

|
#12
Saint David St
Fairburn, GA 30213
|
1,855 sq. feet
|
2 baths 3 beds |
show details | |

|
#13
Mayson Turner Rd NW Unit 1419
Atlanta, GA 30314
|
872 sq. feet
|
1 baths 2 beds |
show details | |

|
#14
Rifflewood Way
Douglasville, GA 30135
|
3,777 sq. feet
|
5 baths 6 beds |
show details | |

|
#15
Kelley Chapel Rd
Decatur, GA 30034
|
1,732 sq. feet
|
3 baths 3 beds |
show details | |

|
#16
Liberty Commons Dr NW
Atlanta, GA 30314
|
1,704 sq. feet
|
2 baths 3 beds |
show details | |

|
#17
Milam Dr
Ellenwood, GA 30294
|
3,266 sq. feet
|
4 baths 5 beds |
show details | |

|
#18
Mandarin Dr
Jonesboro, GA 30236
|
2,355 sq. feet
|
2 baths 4 beds |
show details | |

|
#19
Archer Trl
Decatur, GA 30034
|
2,892 sq. feet
|
6 baths 6 beds |
show details | |

|
#20
Oak Woods Ct
Douglasville, GA 30135
|
2,738 sq. feet
|
3 baths 3 beds |
show details |
| Photo | Address | Area | Beds / Baths | Price | Details |
|---|---|---|---|---|---|

|
#21
Smithson Creek Dr
Ellenwood, GA 30294
|
2,722 sq. feet
|
2 baths 5 beds |
show details | |

|
#22
Skyline Ridge Dr
Lithia Springs, GA 30122
|
1,284 sq. feet
|
2 baths 3 beds |
show details | |

|
#23
Thaxton Rd
Atlanta, GA 30349
|
1,748 sq. feet
|
2 baths 3 beds |
show details | |

|
#24
Stanley Rd
Fayetteville, GA 30214
|
5,417 sq. feet
|
7 baths 6 beds |
show details | |

|
#25
Brenda Dr
Austell, GA 30168
|
1,000 sq. feet
|
1 baths 3 beds |
show details | |

|
#26
Wrotham Cir
Atlanta, GA 30349
|
2,134 sq. feet
|
3 baths 4 beds |
show details | |

|
#27
Kingsbrook Blvd
Decatur, GA 30034
|
2,070 sq. feet
|
2 baths 4 beds |
show details | |

|
#28
Clearwater Dr
Douglasville, GA 30135
|
1,276 sq. feet
|
2 baths 3 beds |
show details | |

|
#29
Shadow Creek Ct
Fairburn, GA 30213
|
3,122 sq. feet
|
2 baths 4 beds |
show details | |

|
#30
Brown Dr
Decatur, GA 30034
|
1,708 sq. feet
|
3 baths 3 beds |
show details |
| Photo | Address | Area | Beds / Baths | Price | Details |
|---|---|---|---|---|---|

|
#31
Forsyth St NW Apt 15d
Atlanta, GA 30303
|
868 sq. feet
|
2 baths 2 beds |
show details | |

|
#32
Waverly Dr
Forest Park, GA 30297
|
975 sq. feet
|
1 baths 3 beds |
show details | |

|
#33
Windmill Rd
Ellenwood, GA 30294
|
1,972 sq. feet
|
2 baths 4 beds |
show details | |

|
#34
Collier Ridge Dr NW
Atlanta, GA 30318
|
804 sq. feet
|
1 baths 2 beds |
show details | |

|
#35
Alveston Dr
Atlanta, GA 30349
|
2,364 sq. feet
|
2 baths 4 beds |
show details | |

|
#36
Santa Barbara Dr NW
Atlanta, GA 30318
|
954 sq. feet
|
1 baths 3 beds |
show details | |

|
#37
Brycewood Dr
Decatur, GA 30034
|
1,737 sq. feet
|
2 baths 3 beds |
show details | |

|
#38
N Ave
Atlanta, GA 30318
|
1,002 sq. feet
|
1 baths 3 beds |
show details | |

|
#39
Broadmoor Way
Fairburn, GA 30213
|
- sq. feet
|
5 baths 6 beds |
show details | |

|
#40
Dale Creek Dr NW
Atlanta, GA 30318
|
1,102 sq. feet
|
1 baths 2 beds |
show details |
| Photo | Address | Area | Beds / Baths | Price | Details |
|---|---|---|---|---|---|

|
#41
Collier Dr NW
Atlanta, GA 30318
|
2,747 sq. feet
|
1 baths 4 beds |
show details | |

|
#42
Stillmist Dr
Fairburn, GA 30213
|
2,578 sq. feet
|
3 baths 4 beds |
show details | |

|
#43
Carissa Ct
Ellenwood, GA 30294
|
3,108 sq. feet
|
4 baths 4 beds |
show details | |

|
#44
Westchester Blvd NW
Atlanta, GA 30314
|
964 sq. feet
|
2 baths 4 beds |
show details | |

|
#45
Perch Pl 238
Atlanta, GA 30312
|
1,202 sq. feet
|
2 baths 2 beds |
show details | |

|
#46
Regal Ln SW
Atlanta, GA 30331
|
1,938 sq. feet
|
2 baths 3 beds |
show details | |

|
#47
Camelot Dr
Atlanta, GA 30349
|
4,220 sq. feet
|
3 baths 3 beds |
show details | |

|
#48
Wieuca Rd NE Apt 24
Atlanta, GA 30342
|
1,944 sq. feet
|
3 baths 3 beds |
show details | |

|
#49
Farmbrook Pkwy
Stockbridge, GA 30281
|
1,498 sq. feet
|
2 baths 3 beds |
show details | |

|
Check over 1 million property listings on Foreclosure.com!
|
browse all offers | |||


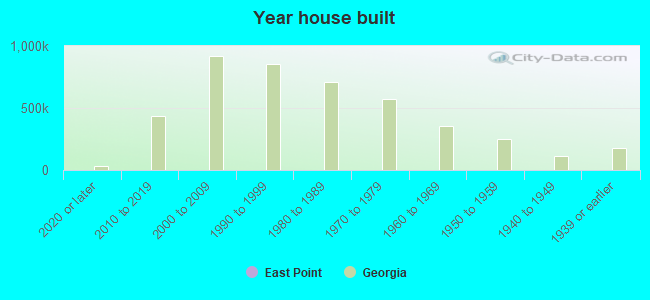
Median year apartment built: 1978
Household type by relationship:
Households: 38,568- Male householders: 6,677 (3,192 living alone), Female householders: 9,576 (3,179 living alone)
3,515 spouses (3,420 opposite-sex spouses), 1,626 unmarried partners, (1,469 opposite-sex unmarried partners), 11,754 children (11,181 natural, 82 adopted, 490 stepchildren), 2,082 grandchildren, 696 brothers or sisters, 676 parents, 12 foster children, 716 other relatives, 850 non-relatives
- In group quarters: 383
Size of family households: 3,654 2-persons, 2,598 3-persons, 1,141 4-persons, 929 5-persons, 201 6-persons, 176 7-or-more-persons.
Size of nonfamily households: 6,494 1-person, 1,258 2-persons, 98 3-persons.
2,274 married couples with children.
5,484 single-parent households (640 men, 4,844 women).
88.3% of residents of East Point speak English at home.
8.2% of residents speak Spanish at home (64% speak English very well, 11% speak English well, 10% speak English not well, 15% don't speak English at all).
1.6% of residents speak other Indo-European language at home (93% speak English very well, 6% speak English well, 1% speak English not well).
0.9% of residents speak Asian or Pacific Island language at home (94% speak English very well, 6% speak English well).
1.0% of residents speak other language at home (74% speak English very well, 13% speak English well, 6% speak English not well, 7% don't speak English at all).
Foreign born population: 2,418 (6.3%)
(33.8% of them are naturalized citizens)
| Here: | 6.6 |
| State: | 6.8 |
| Here: | 4.5 |
| State: | 4.6 |
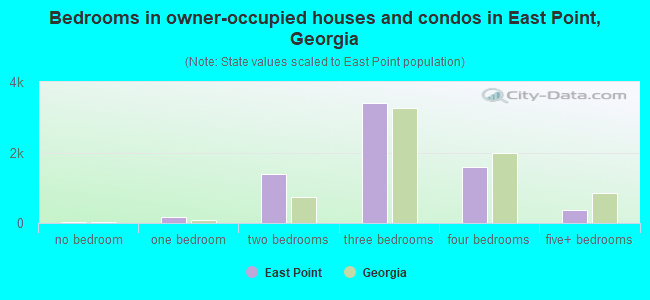
- Bedrooms in owner-occupied houses and condos in East Point, Georgia
- 33no bedroom
- 1571 bedroom
- 1,3912 bedrooms
- 3,4033 bedrooms
- 1,5954 bedrooms
- 3735+ bedrooms
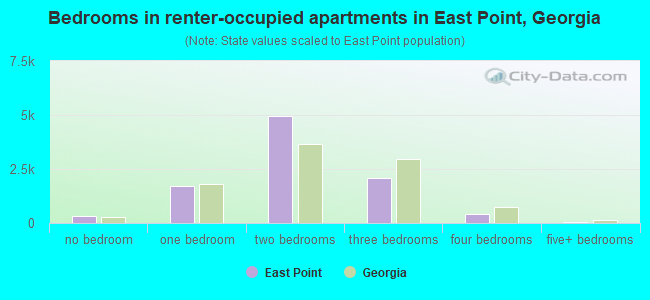
- Bedrooms in renter-occupied apartments in East Point, Georgia
- 312no bedroom
- 1,7241 bedroom
- 4,9622 bedrooms
- 2,0953 bedrooms
- 4254 bedrooms
- 635+ bedrooms
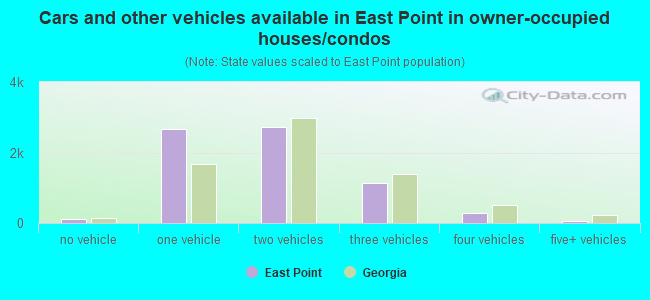
- Cars and other vehicles available in East Point in owner-occupied houses/condos
- 105no vehicle
- 2,6701 vehicle
- 2,7212 vehicles
- 1,1233 vehicles
- 2744 vehicles
- 595+ vehicles
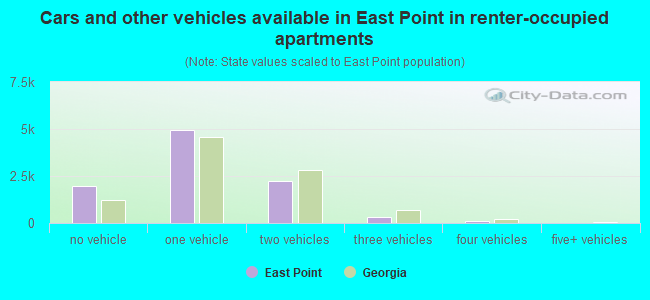
- Cars and other vehicles available in East Point in renter-occupied apartments
- 1,954no vehicle
- 4,9261 vehicle
- 2,2562 vehicles
- 3263 vehicles
- 1184 vehicles
- 05+ vehicles
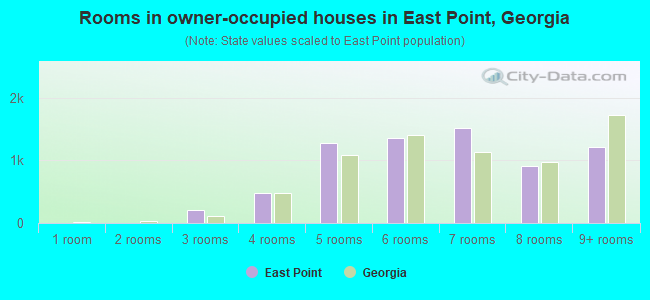
- Rooms in owner-occupied houses in East Point, Georgia
- 01 room
- 02 rooms
- 2023 rooms
- 4864 rooms
- 1,2735 rooms
- 1,3526 rooms
- 1,5177 rooms
- 9118 rooms
- 1,2109+ rooms
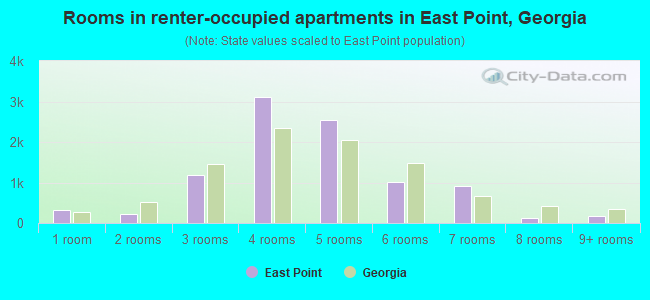
- Rooms in renter-occupied apartments in East Point, Georgia
- 3121 room
- 2142 rooms
- 1,1813 rooms
- 3,1014 rooms
- 2,5465 rooms
- 1,0206 rooms
- 9137 rooms
- 1138 rooms
- 1809+ rooms
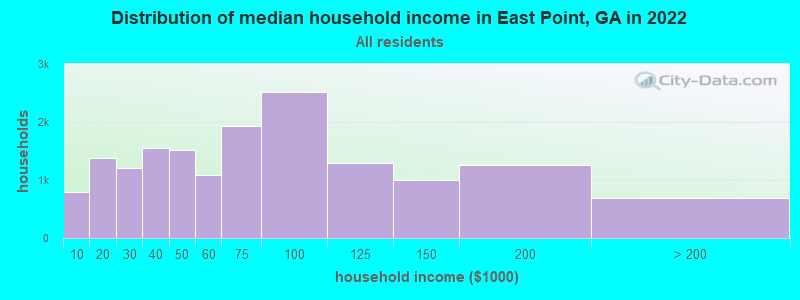
East Point, GA household income distribution

- 794Less than $10,000
- 1,386$10,000 to $19,999
- 1,213$20,000 to $29,999
- 1,557$30,000 to $39,999
- 1,518$40,000 to $49,999
- 1,094$50,000 to $59,999
- 1,929$60,000 to $74,999
- 2,517$75,000 to $99,999
- 1,296$100,000 to $124,999
- 995$125,000 to $149,999
- 1,251$150,000 to $199,999
- 697$200,000 or more
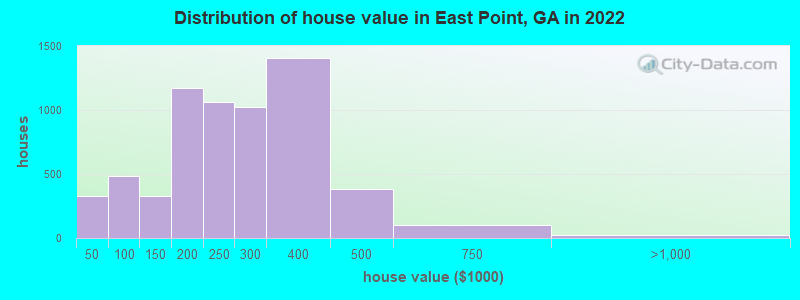
Home value of owner - occupied houses in 2022 in East Point, GA
-
- 145Less than $10,000
- 11$10,000 to $14,999
- 10$15,000 to $19,999
- 37$20,000 to $24,999
- 15$25,000 to $29,999
- 57$30,000 to $34,999
- 24$35,000 to $39,999
- 26$40,000 to $49,999
- 50$50,000 to $59,999
- 90$60,000 to $69,999
- 4$70,000 to $79,999
- 128$80,000 to $89,999
- 180$90,000 to $99,999
- 254$100,000 to $124,999
- 72$125,000 to $149,999
- 411$150,000 to $174,999
- 760$175,000 to $199,999
- 1,060$200,000 to $249,999
- 1,022$250,000 to $299,999
- 1,405$300,000 to $399,999
- 379$400,000 to $499,999
- 98$500,000 to $749,999
- 21$750,000 to $999,999
- 3$1,000,000 to $1,499,999
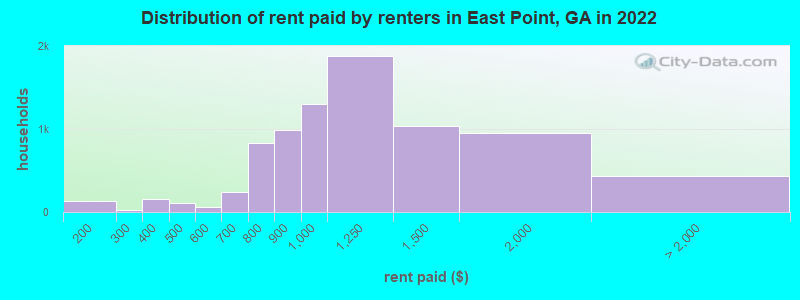
Rent paid by renters in 2022 in East Point, GA
-
- 15Less than $100
- 130$100 to $149
- 4$200 to $249
- 24$250 to $299
- 122$300 to $349
- 31$350 to $399
- 61$400 to $449
- 45$450 to $499
- 33$500 to $549
- 30$550 to $599
- 85$600 to $649
- 156$650 to $699
- 251$700 to $749
- 578$750 to $799
- 987$800 to $899
- 1,300$900 to $999
- 1,883$1,000 to $1,249
- 1,031$1,250 to $1,499
- 948$1,500 to $1,999
- 45$3,000 to $3,499
- 388No cash rent
Percentage of workers working in this county: 72.4%
Number of people working at home: 3,378 (17.1% of all workers)
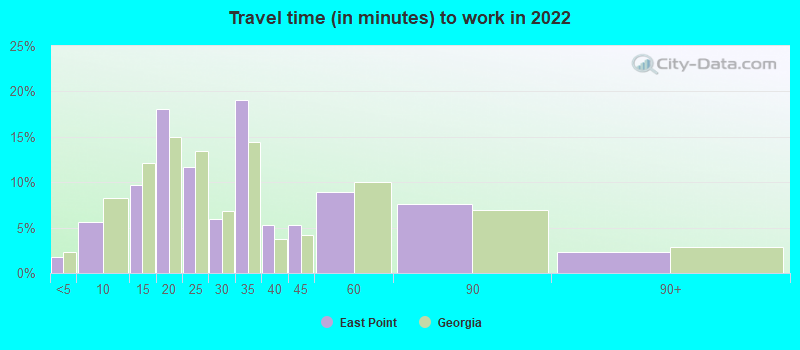
Travel time to work (commute)
- Less than 5 minutes: 517
- 5 to 9 minutes: 674
- 10 to 14 minutes: 1,318
- 15 to 19 minutes: 1,934
- 20 to 24 minutes: 2,671
- 25 to 29 minutes: 1,083
- 30 to 34 minutes: 3,603
- 35 to 39 minutes: 452
- 40 to 44 minutes: 649
- 45 to 59 minutes: 1,082
- 60 to 89 minutes: 1,035
- 90 or more minutes: 476
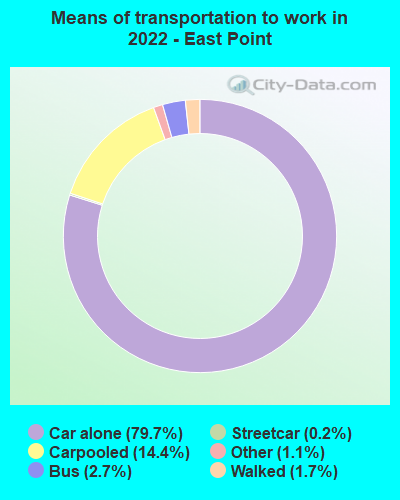
Means of transportation to work:
- Drove a car alone: 10,360 (64.1%)
- Carpooled: 2,070 (12.8%)
- Bus: 267 (1.7%)
- Subway or elevated rail: 15 (0.1%)
- Light rail, streetcar or trolley: 9 (0.1%)
- Taxi: 135 (0.8%)
- Walked: 236 (1.5%)
- Worked at home: 3,378 (20.9%)
- Unemployment by race in 2022
- Unemployment rate for White non-Hispanic residents
- 4.3%Males
- 1.2%Females
- Unemployment rate for Black residents
- 7.8%Males
- 7.4%Females
- Unemployment rate for American Indian and Alaska Native residents
- 16.3%Males
- Unemployment rate for two or more race residents
- 5.8%Males
- Unemployment rate for Hispanic or Latino residents
- 5.1%Males
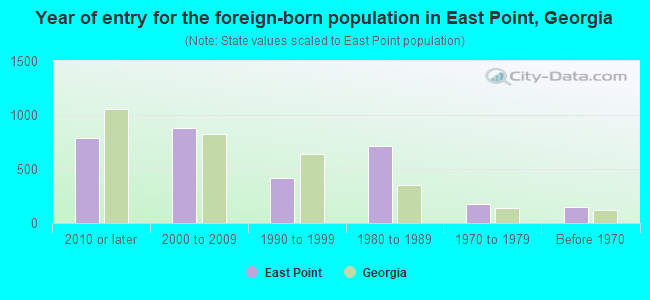
- Year of entry for the foreign-born population in East Point, Georgia
- 7862010 or later
- 8772000 to 2009
- 4181990 to 1999
- 7151980 to 1989
- 1781970 to 1979
- 151Before 1970
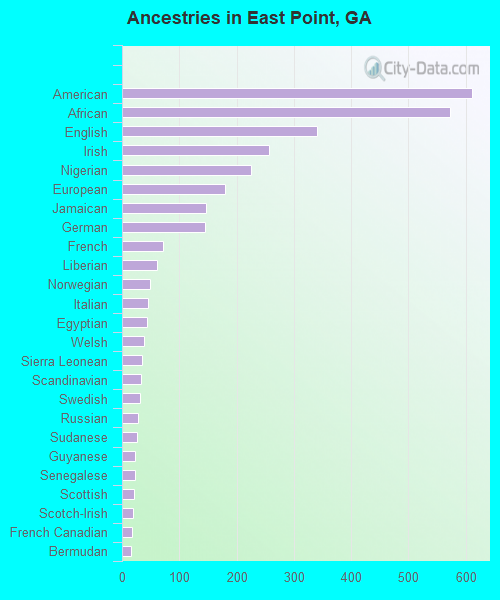
First ancestries reported:
- American: 610 (2.2%)
- African: 572 (2.1%)
- English: 341 (1.2%)
- Irish: 257 (0.9%)
- Nigerian: 225 (0.8%)
- European: 179 (0.7%)
- Jamaican: 146 (0.5%)
- German: 145 (0.5%)
- French: 71 (0.3%)
- Liberian: 61 (0.2%)
- Norwegian: 49 (0.2%)
- Italian: 45 (0.2%)
- Egyptian: 43 (0.2%)
- Welsh: 39 (0.1%)
- Sierra Leonean: 35 (0.1%)
- Scandinavian: 33 (0.1%)
- Swedish: 32 (0.1%)
- Russian: 28 (0.1%)
- Sudanese: 27 (0.10%)
- Guyanese: 23 (0.08%)
- Senegalese: 22 (0.08%)
- Scottish: 21 (0.08%)
- Scotch-Irish: 19 (0.07%)
- French Canadian: 18 (0.07%)
- Bermudan: 16 (0.06%)
- Bahamian: 15 (0.05%)
- Croatian: 12 (0.04%)
- Dutch: 12 (0.04%)
- Australian: 11 (0.04%)
- Belizean: 11 (0.04%)
- British: 8 (0.03%)
- Canadian: 2 (0.01%)
Most common places of birth for foreign-born residents (%):
| East Point: | 26.3% (663) |
| Georgia: | 20.0% (223,400) |
| East Point: | 12.4% (312) |
| Georgia: | 0.4% (4,350) |
| East Point: | 8.2% (207) |
| Georgia: | 2.5% (27,846) |
| East Point: | 6.0% (151) |
| Georgia: | 1.8% (20,700) |
| East Point: | 4.5% (113) |
| Georgia: | 3.5% (39,227) |
| East Point: | 4.4% (112) |
| Georgia: | 0.3% (2,940) |
| East Point: | 3.5% (87) |
| Georgia: | 2.1% (23,813) |
| East Point: | 3.5% (87) |
| Georgia: | 1.1% (12,223) |
| East Point: | 3.1% (79) |
| Georgia: | 3.6% (39,974) |
| East Point: | 2.8% (70) |
| Georgia: | 0.1% (1,138) |
| East Point: | 2.5% (62) |
| Georgia: | 2.1% (23,500) |
| East Point: | 2.1% (53) |
| Georgia: | 3.9% (43,756) |
| East Point: | 2.1% (52) |
| Georgia: | 0.4% (4,565) |
| East Point: | 2.0% (51) |
| Georgia: | 0.3% (3,839) |
| East Point: | 2.0% (50) |
| Georgia: | 0.3% (3,088) |
| East Point: | 1.9% (48) |
| Georgia: | 4.6% (51,270) |
| East Point: | 1.9% (48) |
| Georgia: | 1.7% (19,012) |
| East Point: | 1.8% (45) |
| Georgia: | 0.5% (6,116) |
| East Point: | 1.7% (42) |
| Georgia: | 1.6% (17,851) |
Place of birth for U.S.-born residents:
- This state: 21,082
- Other state: 14,346
- Northeast: 2,462
- Midwest: 2,525
- South: 8,175
- West: 1,322
82.7% of East Point residents lived in the same house 1 years ago.
Out of people who lived in different houses, 32.3% lived in this county.
Out of people who lived in different counties, 52.1% lived in Georgia.
| East Point: | 82.7% |
| State average: | 86.6% |
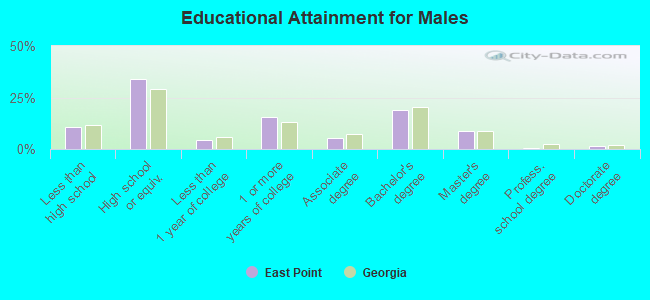
Education attainment for males 25 years and older:
- No schooling: 231
- Nursery to 4th grade: 53
- 5th and 6th grade: 165
- 7th and 8th grade: 241
- 9th grade: 107
- 10th grade: 125
- 11th grade: 202
- 12th grade, no diploma: 142
- High school graduate (or equivalency): 3,988
- Less than 1 year of college: 497
- Some college more than 1 year, no degree: 1,840
- Associate degree: 629
- Bachelor's degree: 2,236
- Master's degree: 1,035
- Professional school degree: 77
- Doctorate degree: 161
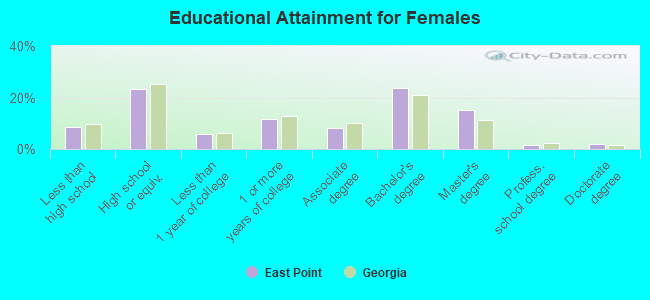
Education attainment for females 25 years and older:
- No schooling: 185
- Nursery to 4th grade: 25
- 5th and 6th grade: 148
- 7th and 8th grade: 103
- 9th grade: 192
- 10th grade: 384
- 11th grade: 97
- 12th grade, no diploma: 77
- High school graduate (or equivalency): 3,293
- Less than 1 year of college: 839
- Some college more than 1 year, no degree: 1,651
- Associate degree: 1,177
- Bachelor's degree: 3,357
- Master's degree: 2,145
- Professional school degree: 240
- Doctorate degree: 262
Housing units in structures:
- One, detached: 9,787
- One, attached: 543
- Two: 820
- 3 or 4: 776
- 5 to 9: 2,386
- 10 to 19: 2,730
- 20 to 49: 562
- 50 or more: 777
- Mobile homes: 235
- Boats, RVs, vans, etc.: 34
Housing units lacking complete kitchen facilities in 2022: 2.6%
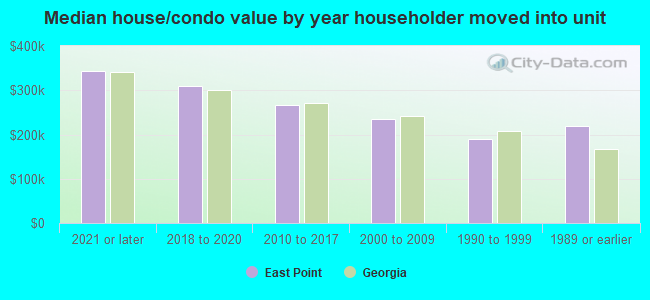
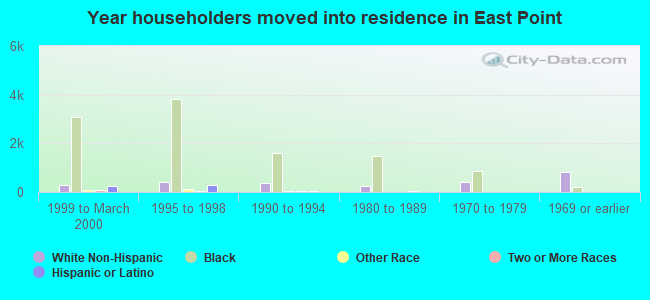
House/condo owner moved in on average 14 years ago
Renter moved in on average 3 years ago
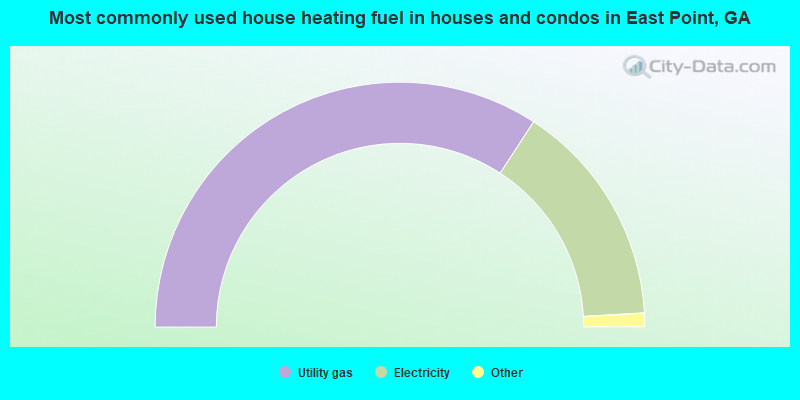
- 68.4%Utility gas
- 29.8%Electricity
- 1.0%Bottled, tank, or LP gas
- 0.4%Fuel oil, kerosene, etc.
- 0.4%Solar energy
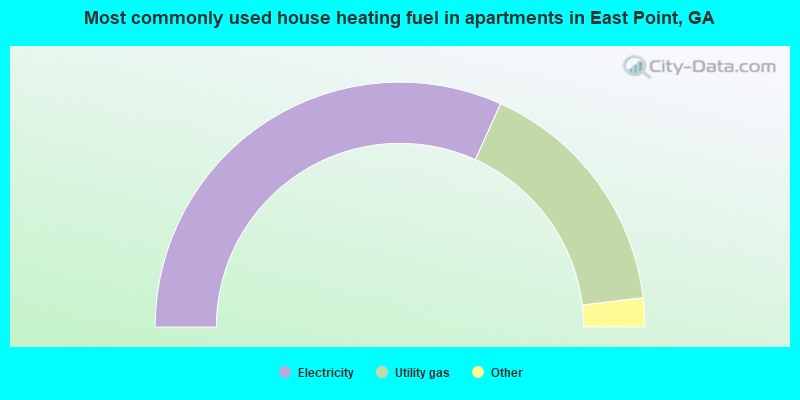
- 63.5%Electricity
- 32.7%Utility gas
- 2.5%Bottled, tank, or LP gas
- 0.9%No fuel used
- 0.3%Fuel oil, kerosene, etc.
- 0.1%Other fuel
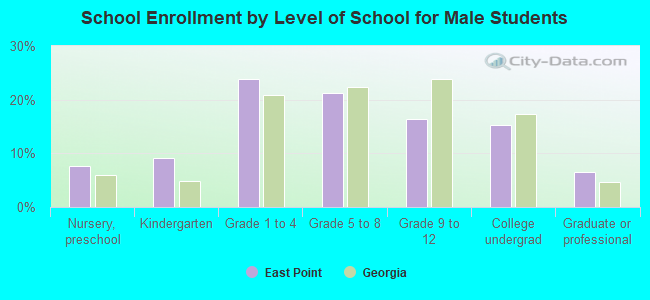
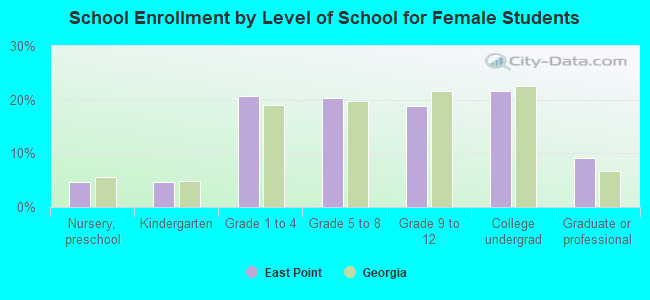
Private vs. public school enrollment:
| Here: | 6.8% |
| Georgia: | 12.1% |
| Here: | 16.4% |
| Georgia: | 10.8% |
| Here: | 30.7% |
| Georgia: | 17.1% |