Easton, CT (Connecticut) Houses and Residents
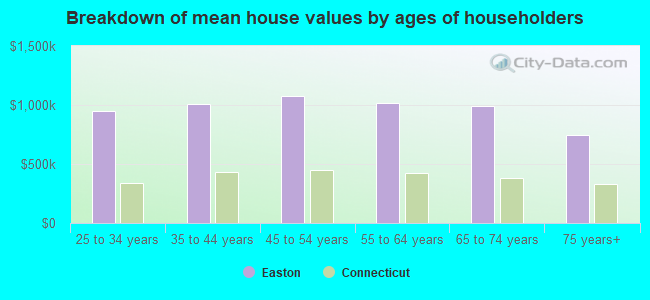
| Easton: | $991,876 |
| Connecticut: | $347,200 |
Total population: 7,490 (Urban population: 2,927, Rural population: 4,345 (85 farm, 4,260 nonfarm))
Houses: 2,511 (2,465 occupied: 2,324 owner occupied, 141 renter occupied)
| % of renters here: | 6% |
| State: | 34% |
Housing density: 92 houses/condos per square mile
Median price asked for vacant for-sale houses and condos in 2022 in this county: $820,471.
Median contract rent in 2022: over $2,000
Median rent asked for vacant for-rent units in 2022: $3,940
Median gross rent in Easton, CT in 2022: over $2,000
Housing units in Easton with a mortgage: 1,576 (158 second mortgage, 265 home equity loan, 6 both second mortgage and home equity loan)
Houses without a mortgage: 593
Compare current foreclosures near Easton, CT:
| Photo | Address | Area | Beds / Baths | Price | Details |
|---|---|---|---|---|---|

|
#1
Marsh Rd
Easton, CT 06612
|
1,383 sq. feet
|
1 baths 4 beds |
show details | |

|
#2
Buck Hill Rd
Easton, CT 06612
|
3,222 sq. feet
|
3 baths 3 beds |
show details | |

|
#3
Soundview Dr
Easton, CT 06612
|
4,684 sq. feet
|
3 baths 5 beds |
show details | |

|
#4
Rock House Rd
Easton, CT 06612
|
- sq. feet
|
- baths - beds |
show details | |

|
#5
Lynne Pl
Bridgeport, CT 06610
|
1,152 sq. feet
|
2 baths 3 beds |
$389,900
|
show details |

|
#6
N Star Dr
Seymour, CT 06483
|
1,670 sq. feet
|
2 baths 3 beds |
$424,900
|
show details |

|
#7
Plymouth St
Stratford, CT 06614
|
1,824 sq. feet
|
2 baths 3 beds |
$499,900
|
show details |

|
#8
Davis Dr
Milford, CT 06460
|
1,165 sq. feet
|
1 baths 4 beds |
$454,900
|
show details |

|
#9
Abbott Ave
Danbury, CT 06810
|
1,401 sq. feet
|
1 baths 3 beds |
$499,900
|
show details |

|
#10
Santangelo Terrace #30
Derby, CT 06418
|
652 sq. feet
|
1 baths 1 beds |
$189,000
|
show details |
| Photo | Address | Area | Beds / Baths | Price | Details |
|---|---|---|---|---|---|

|
#11
Olcott Way # 122
Ridgefield, CT 06877
|
920 sq. feet
|
1 baths 1 beds |
$364,900
|
show details |

|
#12
Beecher Ave
Shelton, CT 06484
|
1,911 sq. feet
|
2 baths 4 beds |
$589,900
|
show details |

|
#13
Highland Park Dr
Danbury, CT 06811
|
875 sq. feet
|
2 baths 2 beds |
$460,000
|
show details |

|
#14
Partridge Dr
Seymour, CT 06483
|
1,500 sq. feet
|
1 baths 3 beds |
$300,000
|
show details |

|
#15
Talmadge Hill Rd
Darien, CT 06820
|
- sq. feet
|
4 baths 5 beds |
$2,395,000
|
show details |

|
#16
Lindley St
Bridgeport, CT 06606
|
- sq. feet
|
2 baths 4 beds |
$421,900
|
show details |

|
#17
Sasco Hill Rd
Fairfield, CT 06824
|
- sq. feet
|
4 baths 5 beds |
$6,700,000
|
show details |

|
#18
Patricia Rd Unit B
Bridgeport, CT 06606
|
1,275 sq. feet
|
1 baths 2 beds |
show details | |

|
#19
Remington St
Bridgeport, CT 06610
|
1,292 sq. feet
|
1 baths 3 beds |
show details | |

|
#20
Park Ave Unit 22
Bridgeport, CT 06604
|
2,296 sq. feet
|
2 baths 2 beds |
show details |
| Photo | Address | Area | Beds / Baths | Price | Details |
|---|---|---|---|---|---|

|
#21
-337 Ridgefield Ave
Bridgeport, CT 06610
|
3,679 sq. feet
|
3 baths 6 beds |
show details | |

|
#22
Huntington Ct
Bethel, CT 06801
|
1,312 sq. feet
|
1 baths 2 beds |
show details | |

|
#23
Wooster St
Bethel, CT 06801
|
2,573 sq. feet
|
3 baths 5 beds |
show details | |

|
#24
Riverdale Rd
Milford, CT 06460
|
912 sq. feet
|
1 baths 3 beds |
show details | |

|
#25
Wood Acres Lane
Monroe, CT 06468
|
3,159 sq. feet
|
4 baths 4 beds |
show details | |

|
#26
Oakleaf St
Bridgeport, CT 06606
|
1,152 sq. feet
|
1 baths 4 beds |
show details | |

|
#27
Hawthorne Ave
Derby, CT 06418
|
5,129 sq. feet
|
5 baths 7 beds |
show details | |

|
#28
Chestnut Hill Rd
Wilton, CT 06897
|
4,630 sq. feet
|
4 baths 5 beds |
show details | |

|
#29
Governors Hill Rd
Oxford, CT 06478
|
2,106 sq. feet
|
2 baths 3 beds |
show details | |

|
#30
Rennell St
Bridgeport, CT 06604
|
1,419 sq. feet
|
1 baths 3 beds |
show details |
| Photo | Address | Area | Beds / Baths | Price | Details |
|---|---|---|---|---|---|

|
#31
Mountain View Dr
Weston, CT 06883
|
4,687 sq. feet
|
3 baths 4 beds |
show details | |

|
#32
Upland Ct
Norwalk, CT 06854
|
1,368 sq. feet
|
1 baths 4 beds |
show details | |

|
#33
Buttery Rd
New Canaan, CT 06840
|
1,986 sq. feet
|
2 baths 4 beds |
show details | |

|
#34
Harris St
Norwalk, CT 06850
|
1,176 sq. feet
|
2 baths 3 beds |
show details | |

|
#35
Briar Oak Dr
Weston, CT 06883
|
2,634 sq. feet
|
3 baths 4 beds |
show details | |

|
#36
82 Herkimer St
Bridgeport, CT 06604
|
- sq. feet
|
3 baths 5 beds |
show details | |

|
#37
Daniel Ct
Westport, CT 06880
|
4,566 sq. feet
|
4 baths 4 beds |
show details | |

|
#38
Lexington Ave Apt 203
Bridgeport, CT 06604
|
715 sq. feet
|
1 baths 1 beds |
show details | |

|
#39
Beechwood Ave
Bridgeport, CT 06604
|
2,167 sq. feet
|
2 baths 3 beds |
show details | |

|
#40
Great Plain Road15
Danbury, CT 06811
|
715 sq. feet
|
1 baths 1 beds |
show details |
| Photo | Address | Area | Beds / Baths | Price | Details |
|---|---|---|---|---|---|

|
#41
Oak Crest Dr
Brookfield, CT 06804
|
2,074 sq. feet
|
1 baths 3 beds |
show details | |

|
#42
Weber Ave
Bridgeport, CT 06610
|
1,322 sq. feet
|
2 baths 3 beds |
show details | |

|
#43
Northill St Apt 2x
Stamford, CT 06907
|
1,076 sq. feet
|
2 baths 2 beds |
show details | |

|
#44
Lockwood Rd
Fairfield, CT 06825
|
3,635 sq. feet
|
2 baths 5 beds |
show details | |

|
#45
Overlook Ave
Bridgeport, CT 06606
|
1,232 sq. feet
|
2 baths 3 beds |
show details | |

|
#46
Madison Ave
Bridgeport, CT 06606
|
1,100 sq. feet
|
1 baths 3 beds |
show details | |

|
#47
High View Dr
Stratford, CT 06614
|
2,574 sq. feet
|
2 baths 4 beds |
show details | |

|
#48
Linwood St
West Haven, CT 06516
|
1,387 sq. feet
|
1 baths 2 beds |
show details | |

|
#49
Forest Hills Rd
West Haven, CT 06516
|
1,638 sq. feet
|
1 baths 3 beds |
show details | |

|
Check over 1 million property listings on Foreclosure.com!
|
browse all offers | |||
Latest news about housing in Easton, CT collected exclusively by city-data.com from local newspapers, TV, and radio stations


Household type by relationship:
Households: 897,661- In family households: 768,709 (156,025 male householders, 76,871 female householders)
178,028 spouses, 283,184 children (270,358 natural, 5,825 adopted, 7,001 stepchildren), 13,517 grandchildren, 10,152 brothers or sisters, 9,951 parents, foster children, 13,466 other relatives, 21,162 non-relatives
- In nonfamily households: 128,952 (44,659 male householders (33,783 living alone)), 57,990 female householders (49,710 living alone)), 26,303 nonrelatives
- In group quarters: 19,168 (9,152 institutionalized population)
167,032 married couples with children.
41,379 single-parent households (6,664 men, 34,715 women).
86.5% of residents of Easton speak English at home.
0.9% of residents speak Spanish at home (93% speak English very well, 7% speak English not well).
9.6% of residents speak other Indo-European language at home (74% speak English very well, 18% speak English well, 8% speak English not well, 1% don't speak English at all).
1.7% of residents speak Asian or Pacific Island language at home (43% speak English very well, 37% speak English well, 19% speak English not well).
1.4% of residents speak other language at home (93% speak English very well, 7% speak English well).
Foreign born population: 1,184 (14.3%)
(70.4% of them are naturalized citizens)
| Here: | 9.2 |
| State: | 6.5 |
| Here: | 6.6 |
| State: | 4.0 |
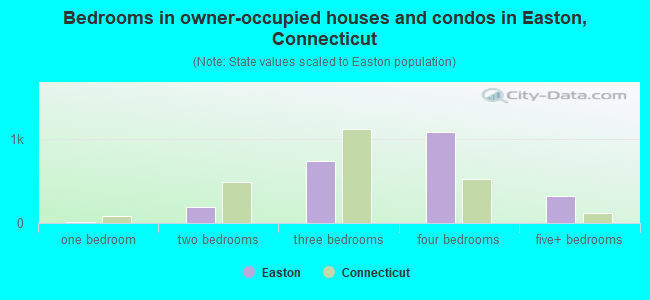
- Bedrooms in owner-occupied houses and condos in Easton, Connecticut
- 0no bedroom
- 71 bedroom
- 1882 bedrooms
- 7323 bedrooms
- 1,0744 bedrooms
- 3235+ bedrooms
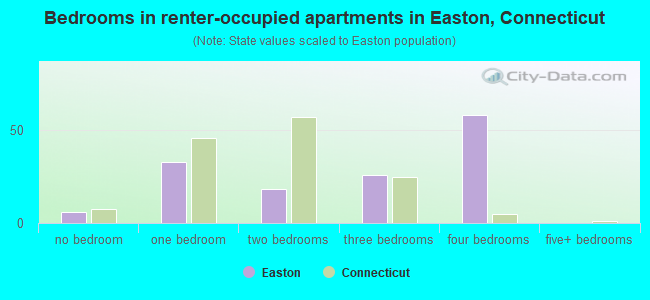
- Bedrooms in renter-occupied apartments in Easton, Connecticut
- 6no bedroom
- 331 bedroom
- 182 bedrooms
- 263 bedrooms
- 584 bedrooms
- 05+ bedrooms
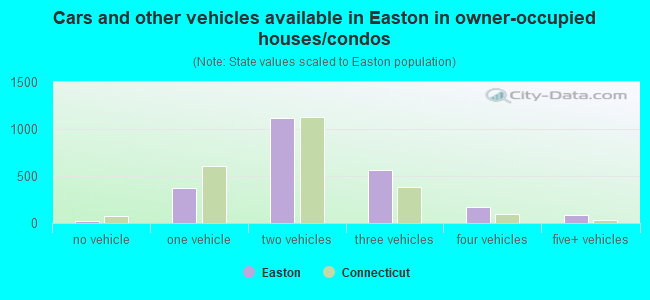
- Cars and other vehicles available in Easton in owner-occupied houses/condos
- 23no vehicle
- 3681 vehicle
- 1,1182 vehicles
- 5633 vehicles
- 1714 vehicles
- 815+ vehicles
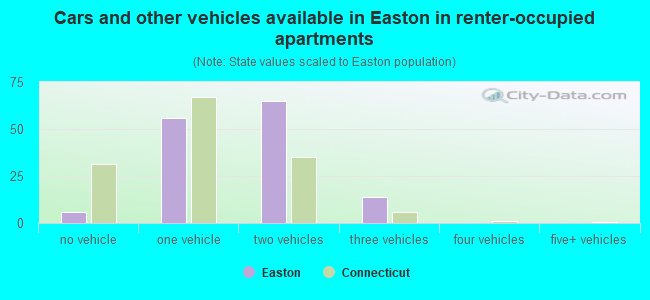
- Cars and other vehicles available in Easton in renter-occupied apartments
- 6no vehicle
- 561 vehicle
- 652 vehicles
- 143 vehicles
- 04 vehicles
- 05+ vehicles
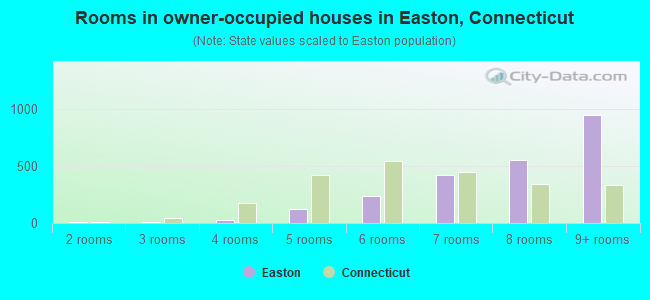
- Rooms in owner-occupied houses in Easton, Connecticut
- 01 room
- 72 rooms
- 63 rooms
- 284 rooms
- 1275 rooms
- 2396 rooms
- 4207 rooms
- 5518 rooms
- 9469+ rooms
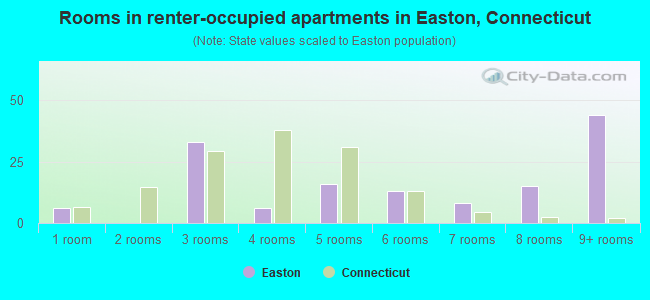
- Rooms in renter-occupied apartments in Easton, Connecticut
- 61 room
- 02 rooms
- 333 rooms
- 64 rooms
- 165 rooms
- 136 rooms
- 87 rooms
- 158 rooms
- 449+ rooms
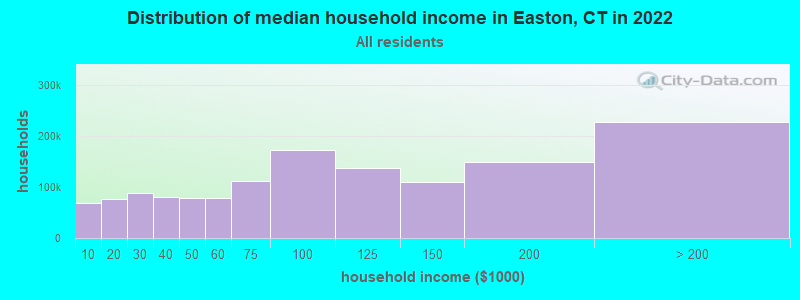
Easton, CT household income distribution

- 73,254Less than $10,000
- 82,087$10,000 to $19,999
- 93,489$20,000 to $29,999
- 84,715$30,000 to $39,999
- 83,679$40,000 to $49,999
- 82,554$50,000 to $59,999
- 117,073$60,000 to $74,999
- 182,246$75,000 to $99,999
- 143,165$100,000 to $124,999
- 114,384$125,000 to $149,999
- 156,872$150,000 to $199,999
- 237,164$200,000 or more
Percentage of workers working in this county: 89.3%
Number of people working at home: 680 (17.4% of all workers)
Travel time to work (commute)
- Less than 5 minutes: 47
- 5 to 9 minutes: 126
- 10 to 14 minutes: 286
- 15 to 19 minutes: 419
- 20 to 24 minutes: 600
- 25 to 29 minutes: 211
- 30 to 34 minutes: 356
- 35 to 39 minutes: 134
- 40 to 44 minutes: 146
- 45 to 59 minutes: 351
- 60 to 89 minutes: 187
- 90 or more minutes: 276
Means of transportation to work:
- Drove a car alone: 2,650 (77.7%)
- Carpooled: 181 (5.3%)
- Bus or trolley bus: 3 (0.1%)
- Railroad: 250 (7.3%)
- Walked: 47 (1.4%)
- Other means: 8 (0.2%)
- Worked at home: 273 (8.0%)
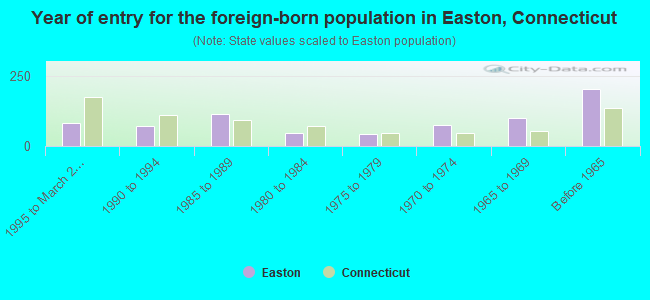
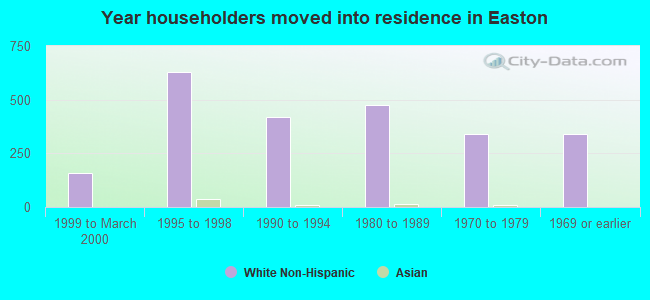
- Year of entry for the foreign-born population in Easton, Connecticut
- 821995 to March 2000
- 701990 to 1994
- 1151985 to 1989
- 461980 to 1984
- 431975 to 1979
- 771970 to 1974
- 1011965 to 1969
- 203Before 1965
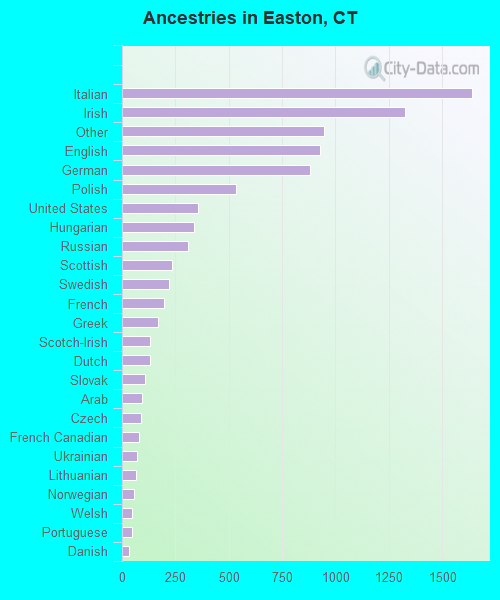
First ancestries reported:
- Italian: 1,638 (18.1%)
- Irish: 1,324 (14.6%)
- Other: 948 (10.5%)
- English: 928 (10.2%)
- German: 880 (9.7%)
- Polish: 532 (5.9%)
- United States: 357 (3.9%)
- Hungarian: 339 (3.7%)
- Russian: 310 (3.4%)
- Scottish: 236 (2.6%)
- Swedish: 219 (2.4%)
- French: 196 (2.2%)
- Greek: 169 (1.9%)
- Scotch-Irish: 132 (1.5%)
- Dutch: 130 (1.4%)
- Slovak: 107 (1.2%)
- Arab: 94 (1.0%)
- Czech: 87 (1.0%)
- French Canadian: 82 (0.9%)
- Ukrainian: 70 (0.8%)
- Lithuanian: 65 (0.7%)
- Norwegian: 57 (0.6%)
- Welsh: 47 (0.5%)
- Portuguese: 45 (0.5%)
- Danish: 34 (0.4%)
- Swiss: 27 (0.3%)
- Subsaharan African: 8 (0.09%)
Most common places of birth for foreign-born residents (%):
| Easton: | 17.9% (132) |
| Connecticut: | 7.0% (26,023) |
| Easton: | 11.8% (87) |
| Connecticut: | 4.4% (16,395) |
| Easton: | 6.5% (48) |
| Connecticut: | 6.9% (25,507) |
| Easton: | 5.6% (41) |
| Connecticut: | 1.2% (4,622) |
| Easton: | 4.9% (36) |
| Connecticut: | 0.7% (2,646) |
| Easton: | 4.3% (32) |
| Connecticut: | 3.1% (11,432) |
| Easton: | 4.1% (30) |
| Connecticut: | 2.5% (9,358) |
| Easton: | 3.8% (28) |
| Connecticut: | 0.4% (1,374) |
| Easton: | 3.3% (24) |
| Connecticut: | 0.7% (2,742) |
| Easton: | 3.3% (24) |
| Connecticut: | 4.1% (15,108) |
| Easton: | 3.0% (22) |
| Connecticut: | 5.2% (19,083) |
| Easton: | 2.2% (16) |
| Connecticut: | 0.4% (1,303) |
| Easton: | 2.2% (16) |
| Connecticut: | 0.6% (2,106) |
| Easton: | 2.2% (16) |
| Connecticut: | 1.5% (5,508) |
| Easton: | 2.2% (16) |
| Connecticut: | 1.8% (6,680) |
| Easton: | 2.2% (16) |
| Connecticut: | 3.6% (13,282) |
| Easton: | 2.2% (16) |
| Connecticut: | 2.8% (10,379) |
| Easton: | 2.0% (15) |
| Connecticut: | 3.6% (13,234) |
| Easton: | 1.8% (13) |
| Connecticut: | 0.4% (1,483) |
| Easton: | 1.8% (13) |
| Connecticut: | 3.2% (12,009) |
Place of birth for U.S.-born residents:
- This state: 3,832
- Other state: 2,636
- Northeast: 1,986
- Midwest: 222
- South: 263
- West: 165
67% of Easton residents lived in the same house 5 years ago.
Out of people who lived in different houses, 73% lived in this county.
Out of people who lived in different counties, 18% lived in Connecticut.
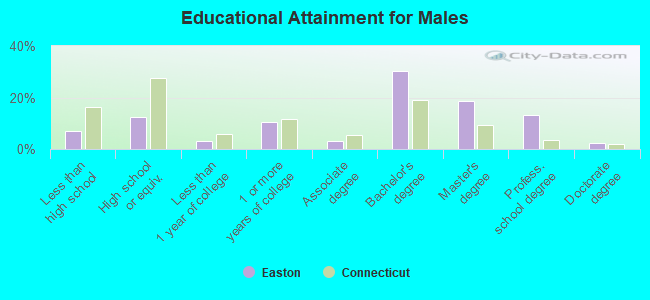
Education attainment for males 25 years and older:
- No schooling: 0
- Nursery to 4th grade: 0
- 5th and 6th grade: 27
- 7th and 8th grade: 49
- 9th grade: 32
- 10th grade: 16
- 11th grade: 16
- 12th grade, no diploma: 29
- High school graduate (or equivalency): 291
- Less than 1 year of college: 73
- Some college more than 1 year, no degree: 245
- Associate degree: 69
- Bachelor's degree: 715
- Master's degree: 438
- Professional school degree: 309
- Doctorate degree: 56
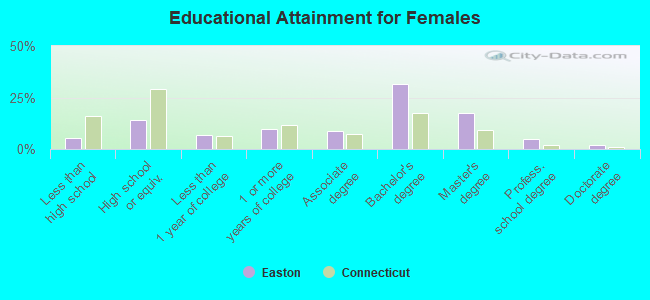
Education attainment for females 25 years and older:
- No schooling: 25
- Nursery to 4th grade: 0
- 5th and 6th grade: 19
- 7th and 8th grade: 21
- 9th grade: 12
- 10th grade: 6
- 11th grade: 9
- 12th grade, no diploma: 47
- High school graduate (or equivalency): 366
- Less than 1 year of college: 174
- Some college more than 1 year, no degree: 246
- Associate degree: 226
- Bachelor's degree: 813
- Master's degree: 444
- Professional school degree: 119
- Doctorate degree: 47
Housing units in structures:
- One, detached: 2,483
- One, attached: 15
- Two: 6
- 5 to 9: 7
Housing units lacking complete kitchen facilities: 0.5%
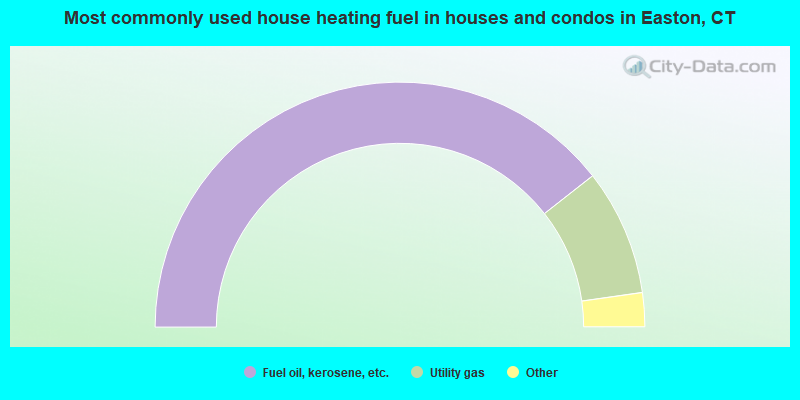
- 78.9%Fuel oil, kerosene, etc.
- 16.7%Utility gas
- 2.2%Electricity
- 2.0%Bottled, tank, or LP gas
- 0.3%Wood
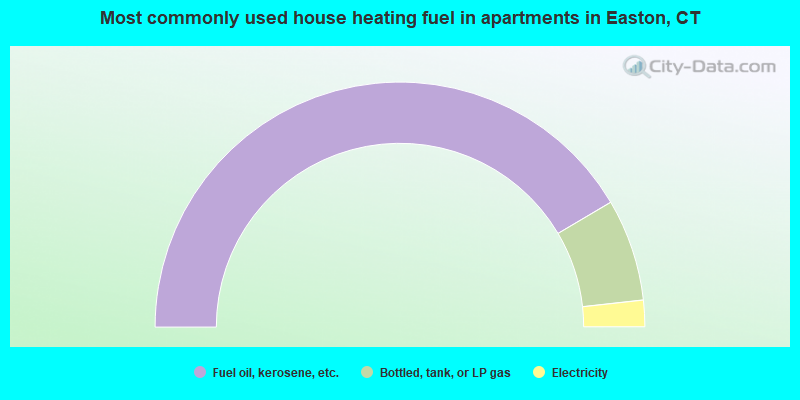
- 83.0%Fuel oil, kerosene, etc.
- 13.5%Bottled, tank, or LP gas
- 3.5%Electricity
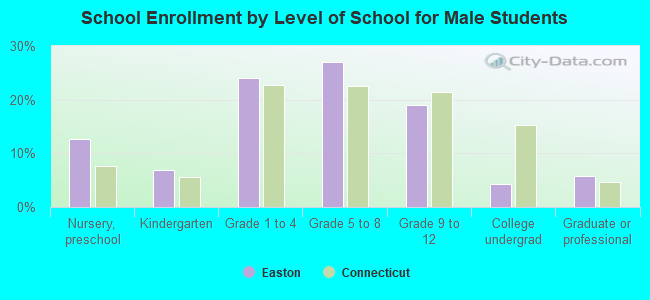
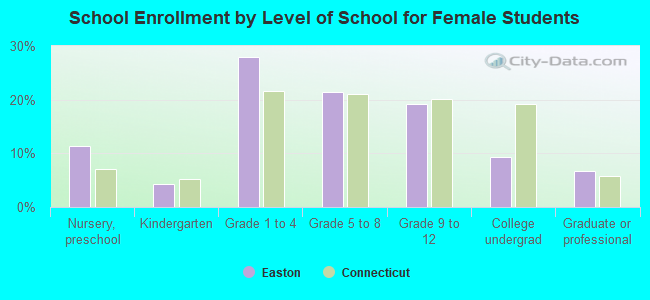
Private vs. public school enrollment:
| Here: | 9.5% |
| Connecticut: | 9.9% |
| Here: | 12.2% |
| Connecticut: | 11.0% |
| Here: | 48.6% |
| Connecticut: | 33.4% |