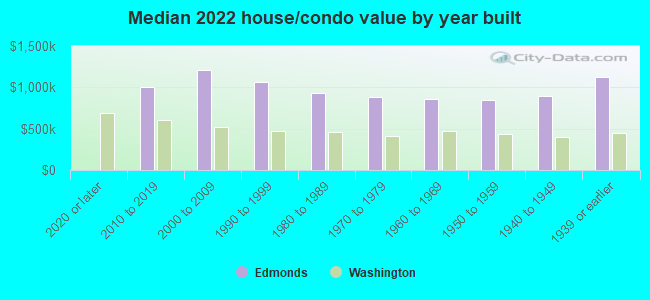
Edmonds, WA (Washington) Houses and Residents
| Edmonds: | $915,923 |
| Washington: | $569,500 |
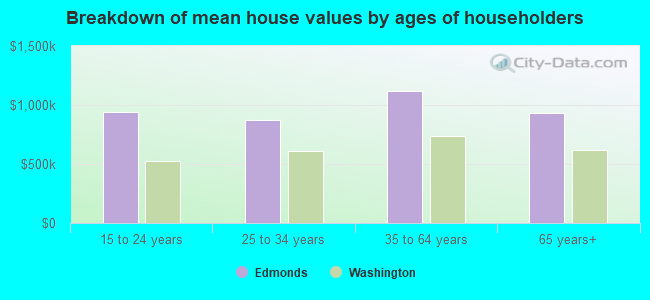
Mean price in 2022:
Detached houses: $1,141,339
Here: $1,141,339 State: $734,307 Townhouses or other attached units: $656,309
Here: $656,309 State: $657,697 In 2-unit structures: $621,286
Here: $621,286 State: $534,634 In 3-to-4-unit structures: $705,523
Here: $705,523 State: $510,239 In 5-or-more-unit structures: $557,802
Here: $557,802 State: $503,183 Mobile homes: $137,563
Here: $137,563 State: $218,362
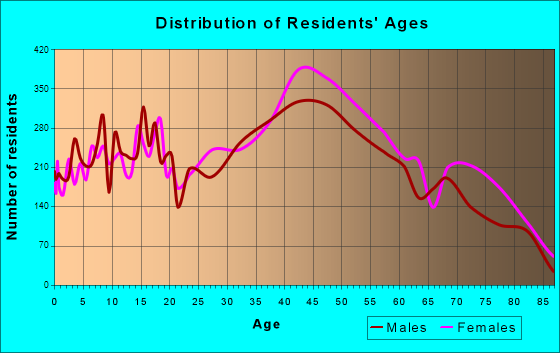
Total population: 40,896 (Urban population: 39,610, Rural population: 0)
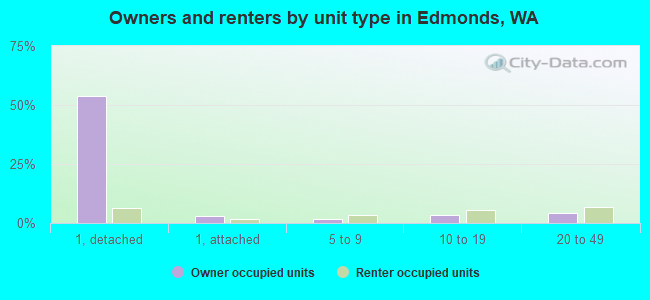
Houses: 19,821 (18,855 occupied: 13,027 owner occupied, 5,671 renter occupied)
| % of renters here: | 30% |
| State: | 36% |
Housing density: 2,226 houses/condos per square mile
Median price asked for vacant for-sale houses and condos in 2022: $5,021,006.
Median contract rent in 2022: $1,716 (lower quartile is $1,472, upper quartile is over $2,000)
Median rent asked for vacant for-rent units in 2022: $2,823
Median gross rent in Edmonds, WA in 2022: $1,842
Housing units in Edmonds with a mortgage: 8,062 (1,297 second mortgage, 90 home equity loan, 1,144 both second mortgage and home equity loan)
Houses without a mortgage: 146
Median household income for houses/condos with a mortgage: $161,255
Median household income for apartments without a mortgage: $89,463
Median monthly housing costs: $1,893
Compare current foreclosures near Edmonds, WA:
| Photo | Address | Area | Beds / Baths | Price | Details |
|---|---|---|---|---|---|

|
#1
91st Ave W
Edmonds, WA 98026
|
1,504 sq. feet
|
1 baths 3 beds |
show details | |

|
#2
78th Pl W
Edmonds, WA 98026
|
2,136 sq. feet
|
2 baths 4 beds |
show details | |

|
#3
Olympic View Dr
Edmonds, WA 98026
|
2,378 sq. feet
|
3 baths 3 beds |
show details | |

|
#4
52nd Ave W
Edmonds, WA 98026
|
1,489 sq. feet
|
2 baths 3 beds |
show details | |

|
#5
240th St SW
Edmonds, WA 98026
|
1,125 sq. feet
|
1 baths 3 beds |
show details | |

|
#6
145th St SW
Edmonds, WA 98026
|
1,756 sq. feet
|
2 baths 3 beds |
show details | |

|
#7
89th Pl W
Edmonds, WA 98026
|
2,188 sq. feet
|
2 baths 4 beds |
show details | |

|
#8
87th Ave W
Edmonds, WA 98026
|
1,956 sq. feet
|
2 baths 3 beds |
show details | |

|
#9
91st Ave W
Edmonds, WA 98026
|
2,160 sq. feet
|
2 baths 4 beds |
show details | |

|
#10
82nd Pl W
Edmonds, WA 98026
|
2,632 sq. feet
|
3 baths 3 beds |
show details |
| Photo | Address | Area | Beds / Baths | Price | Details |
|---|---|---|---|---|---|

|
#11
E Greystone Ln
Edmonds, WA 98020
|
3,851 sq. feet
|
4 baths 4 beds |
show details | |

|
#12
Picnic Point Rd
Edmonds, WA 98026
|
3,014 sq. feet
|
2 baths 5 beds |
show details | |

|
#13
Summit Ln
Edmonds, WA 98026
|
1,608 sq. feet
|
1 baths 2 beds |
show details | |

|
#14
96th Ave W
Edmonds, WA 98020
|
1,934 sq. feet
|
1 baths 4 beds |
show details | |

|
#15
201st St SW
Edmonds, WA 98026
|
960 sq. feet
|
1 baths 3 beds |
show details | |

|
#16
81st Pl W
Edmonds, WA 98026
|
1,614 sq. feet
|
1 baths 3 beds |
show details | |

|
#17
48th Ave W # 1
Edmonds, WA 98026
|
3,136 sq. feet
|
5 baths 6 beds |
show details | |

|
#18
145th St SW
Edmonds, WA 98026
|
2,439 sq. feet
|
2 baths 3 beds |
show details | |

|
#19
81st Pl W
Edmonds, WA 98026
|
936 sq. feet
|
1 baths 3 beds |
show details | |

|
#20
88th Ave W
Edmonds, WA 98026
|
3,280 sq. feet
|
3 baths 3 beds |
show details |
| Photo | Address | Area | Beds / Baths | Price | Details |
|---|---|---|---|---|---|

|
#21
218th St SW Apt 36
Edmonds, WA 98026
|
890 sq. feet
|
1 baths 2 beds |
show details | |

|
#22
236th St SW Apt 20
Edmonds, WA 98026
|
- sq. feet
|
- baths - beds |
show details | |

|
#23
Highway 99, Unit 605
Edmonds, WA 98026
|
- sq. feet
|
- baths - beds |
show details | |

|
#24
218th St SW Apt 1
Edmonds, WA 98026
|
- sq. feet
|
- baths - beds |
show details | |

|
#25
244th St SW Apt Q101
Edmonds, WA 98020
|
- sq. feet
|
- baths - beds |
show details | |

|
#26
148th St Sw, Apt A208
Edmonds, WA 98026
|
- sq. feet
|
- baths - beds |
show details | |

|
#27
80th Ave W Apt 12
Edmonds, WA 98026
|
- sq. feet
|
- baths - beds |
show details | |

|
#28
Highway 99 Apt A-307
Edmonds, WA 98026
|
- sq. feet
|
- baths - beds |
show details | |

|
#29
Rucker Ave Apt 9
Everett, WA 98201
|
879 sq. feet
|
1 baths 2 beds |
show details | |

|
#30
100th St SW Apt B206
Everett, WA 98204
|
856 sq. feet
|
2 baths 2 beds |
show details |
| Photo | Address | Area | Beds / Baths | Price | Details |
|---|---|---|---|---|---|

|
#31
14th Ct NE
Seattle, WA 98155
|
1,420 sq. feet
|
2 baths 2 beds |
show details | |

|
#32
4th Ave W Apt 6a
Everett, WA 98204
|
1,346 sq. feet
|
3 baths 2 beds |
show details | |

|
#33
242nd St SW
Mountlake Terrace, WA 98043
|
2,184 sq. feet
|
2 baths 5 beds |
show details | |

|
#34
NE 190th St
Seattle, WA 98155
|
2,070 sq. feet
|
2 baths 5 beds |
show details | |

|
#35
W Casino Rd Apt 63
Everett, WA 98204
|
1,203 sq. feet
|
2 baths 2 beds |
show details | |

|
#36
NE Woodinville Duvall Rd
Woodinville, WA 98072
|
1,520 sq. feet
|
1 baths 2 beds |
show details | |

|
#37
93rd St SW
Everett, WA 98204
|
1,022 sq. feet
|
1 baths 3 beds |
show details | |

|
#38
41st Ave SW
Seattle, WA 98116
|
1,420 sq. feet
|
1 baths 2 beds |
show details | |

|
#39
Herring Street And 4361 Douglas Street
Langley, WA 98260
|
1,191 sq. feet
|
1 baths 2 beds |
show details | |

|
#40
2nd Ave SE
Bothell, WA 98012
|
1,988 sq. feet
|
2 baths 3 beds |
show details |
| Photo | Address | Area | Beds / Baths | Price | Details |
|---|---|---|---|---|---|

|
#41
19th Dr SE
Bothell, WA 98012
|
852 sq. feet
|
1 baths 3 beds |
show details | |

|
#42
Leonard Dr
Everett, WA 98201
|
1,000 sq. feet
|
1 baths 3 beds |
show details | |

|
#43
3rd Ave W
Seattle, WA 98119
|
1,410 sq. feet
|
1 baths 3 beds |
show details | |

|
#44
116th Ave NE
Kirkland, WA 98033
|
1,260 sq. feet
|
2 baths 3 beds |
show details | |

|
#45
Stone Ct N
Seattle, WA 98133
|
1,640 sq. feet
|
1 baths 3 beds |
show details | |

|
#46
NE Madison St
Suquamish, WA 98392
|
1,040 sq. feet
|
1 baths 2 beds |
show details | |

|
#47
Wahl Rd
Freeland, WA 98249
|
1,512 sq. feet
|
1 baths 3 beds |
show details | |

|
#48
Cascadian Way
Bothell, WA 98012
|
1,492 sq. feet
|
2 baths 3 beds |
show details | |

|
#49
49th Ave SE
Bothell, WA 98012
|
1,756 sq. feet
|
2 baths 3 beds |
show details | |

|
Check over 1 million property listings on Foreclosure.com!
|
browse all offers | |||

Latest news about housing in Edmonds, WA collected exclusively by city-data.com from local newspapers, TV, and radio stations


Median year apartment built: 1977
Household type by relationship:
Households: 43,310- Male householders: 8,640 (1,548 living alone), Female householders: 9,887 (3,671 living alone)
9,917 spouses (9,727 opposite-sex spouses), 1,268 unmarried partners, (1,236 opposite-sex unmarried partners), 10,271 children (9,720 natural, 389 adopted, 161 stepchildren), 409 grandchildren, 316 brothers or sisters, 652 parents, 19 foster children, 417 other relatives, 1,048 non-relatives
- In group quarters: 460
Size of family households: 6,154 2-persons, 2,371 3-persons, 2,193 4-persons, 758 5-persons, 124 6-persons, 154 7-or-more-persons.
Size of nonfamily households: 5,561 1-person, 1,284 2-persons, 177 3-persons.
6,149 married couples with children.
833 single-parent households (360 men, 473 women).
85.3% of residents of Edmonds speak English at home.
3.7% of residents speak Spanish at home (55% speak English very well, 25% speak English well, 10% speak English not well, 11% don't speak English at all).
3.1% of residents speak other Indo-European language at home (73% speak English very well, 18% speak English well, 9% speak English not well).
7.4% of residents speak Asian or Pacific Island language at home (63% speak English very well, 18% speak English well, 17% speak English not well, 1% don't speak English at all).
1.2% of residents speak other language at home (71% speak English very well, 20% speak English well, 8% don't speak English at all).
Foreign born population: 6,352 (14.7%)
(55.5% of them are naturalized citizens)
| Here: | 7.0 |
| State: | 6.5 |
| Here: | 3.8 |
| State: | 3.9 |
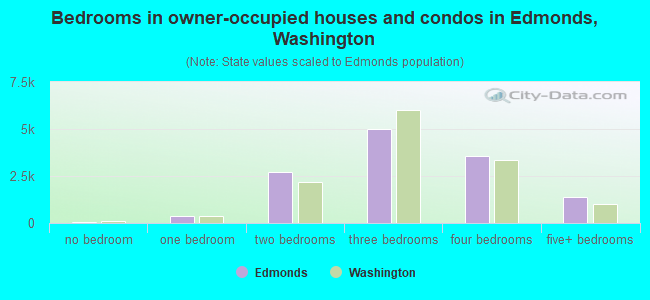
- Bedrooms in owner-occupied houses and condos in Edmonds, Washington
- 62no bedroom
- 3561 bedroom
- 2,6872 bedrooms
- 5,0223 bedrooms
- 3,5414 bedrooms
- 1,3595+ bedrooms
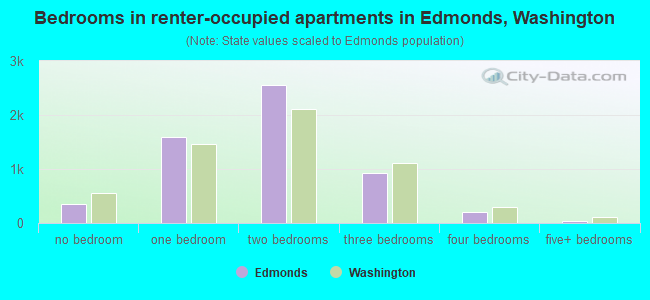
- Bedrooms in renter-occupied apartments in Edmonds, Washington
- 344no bedroom
- 1,5961 bedroom
- 2,5572 bedrooms
- 9303 bedrooms
- 2084 bedrooms
- 375+ bedrooms
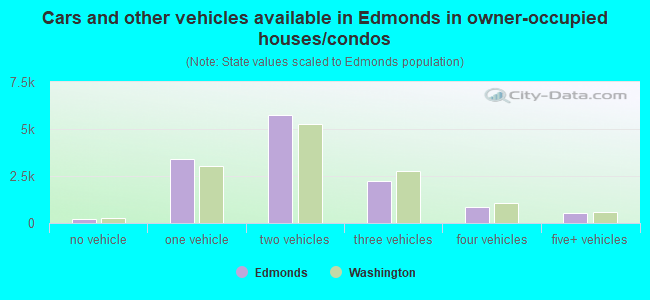
- Cars and other vehicles available in Edmonds in owner-occupied houses/condos
- 227no vehicle
- 3,4131 vehicle
- 5,7702 vehicles
- 2,2213 vehicles
- 8454 vehicles
- 5525+ vehicles
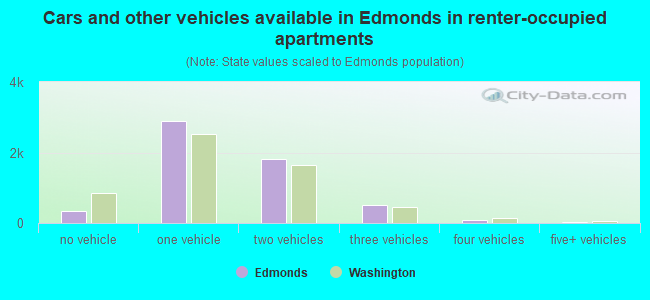
- Cars and other vehicles available in Edmonds in renter-occupied apartments
- 349no vehicle
- 2,8841 vehicle
- 1,8252 vehicles
- 5093 vehicles
- 804 vehicles
- 255+ vehicles
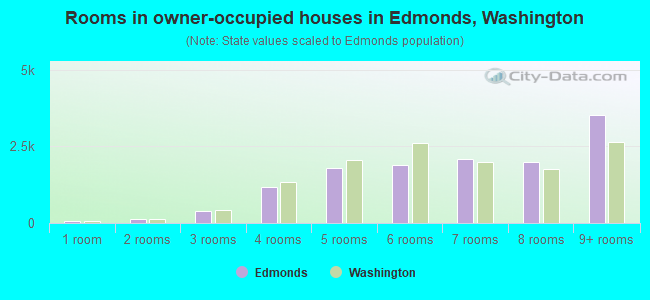
- Rooms in owner-occupied houses in Edmonds, Washington
- 621 room
- 1312 rooms
- 4063 rooms
- 1,1734 rooms
- 1,7845 rooms
- 1,8956 rooms
- 2,0757 rooms
- 1,9778 rooms
- 3,5249+ rooms
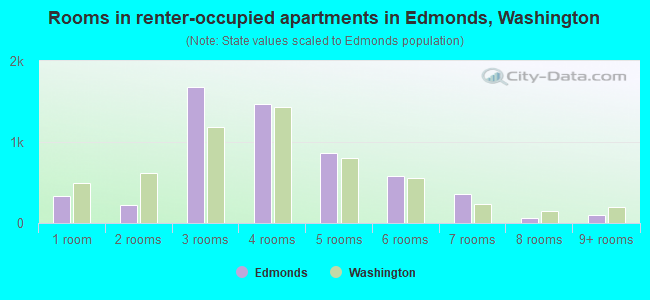
- Rooms in renter-occupied apartments in Edmonds, Washington
- 3361 room
- 2272 rooms
- 1,6803 rooms
- 1,4664 rooms
- 8655 rooms
- 5836 rooms
- 3537 rooms
- 588 rooms
- 1039+ rooms
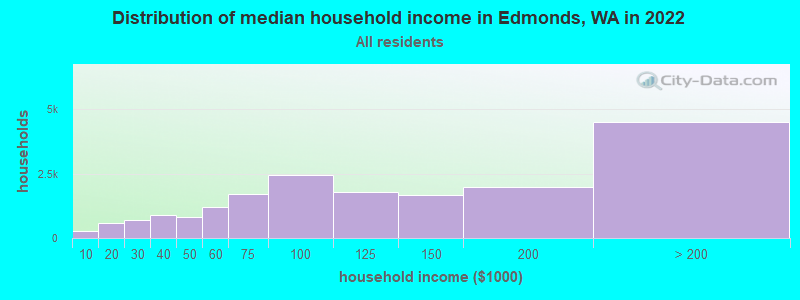
Edmonds, WA household income distribution

- 259Less than $10,000
- 586$10,000 to $19,999
- 695$20,000 to $29,999
- 876$30,000 to $39,999
- 805$40,000 to $49,999
- 1,216$50,000 to $59,999
- 1,694$60,000 to $74,999
- 2,451$75,000 to $99,999
- 1,768$100,000 to $124,999
- 1,666$125,000 to $149,999
- 1,987$150,000 to $199,999
- 4,499$200,000 or more
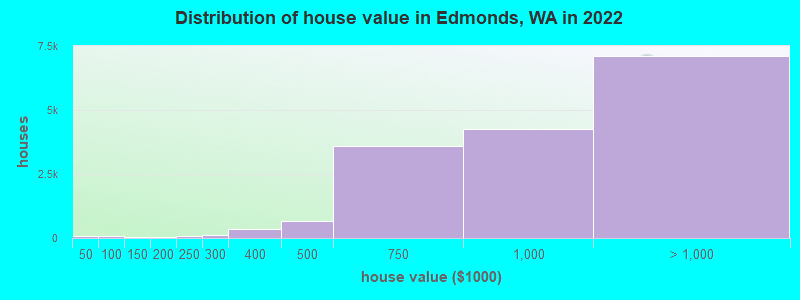
Home value of owner - occupied houses in 2022 in Edmonds, WA
-
- 53Less than $10,000
- 5$10,000 to $14,999
- 24$40,000 to $49,999
- 26$50,000 to $59,999
- 10$80,000 to $89,999
- 9$90,000 to $99,999
- 40$100,000 to $124,999
- 22$150,000 to $174,999
- 21$175,000 to $199,999
- 69$200,000 to $249,999
- 107$250,000 to $299,999
- 349$300,000 to $399,999
- 656$400,000 to $499,999
- 3,604$500,000 to $749,999
- 4,263$750,000 to $999,999
- 4,762$1,000,000 to $1,499,999
- 1,585$1,500,000 to $1,999,999
- 753$2,000,000 or more
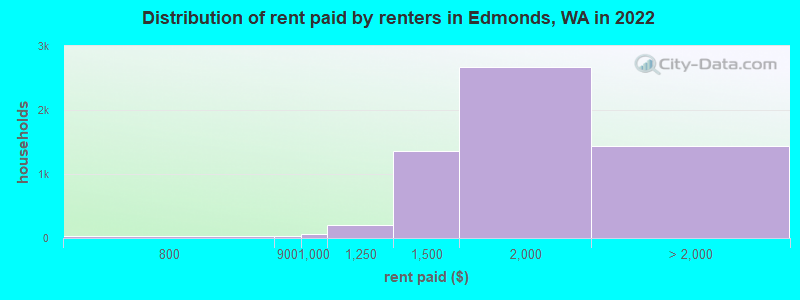
Rent paid by renters in 2022 in Edmonds, WA
-
- 10Less than $100
- 13$150 to $199
- 15$300 to $349
- 5$400 to $449
- 15$700 to $749
- 21$750 to $799
- 31$800 to $899
- 67$900 to $999
- 209$1,000 to $1,249
- 1,361$1,250 to $1,499
- 2,679$1,500 to $1,999
- 626$2,000 to $2,499
- 334$2,500 to $2,999
- 163$3,000 to $3,499
- 194$3,500 or more
- 116No cash rent
Percentage of workers working in this county: 60.2%
Number of people working at home: 6,529 (28.8% of all workers)
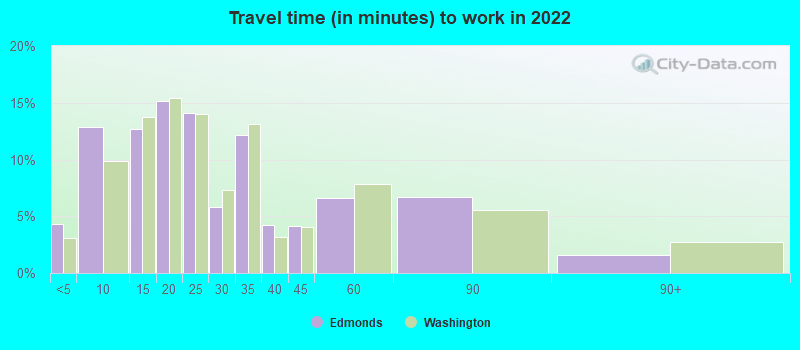
Travel time to work (commute)
- Less than 5 minutes: 602
- 5 to 9 minutes: 2,087
- 10 to 14 minutes: 1,458
- 15 to 19 minutes: 2,096
- 20 to 24 minutes: 1,773
- 25 to 29 minutes: 921
- 30 to 34 minutes: 2,473
- 35 to 39 minutes: 624
- 40 to 44 minutes: 1,228
- 45 to 59 minutes: 2,002
- 60 to 89 minutes: 1,325
- 90 or more minutes: 252
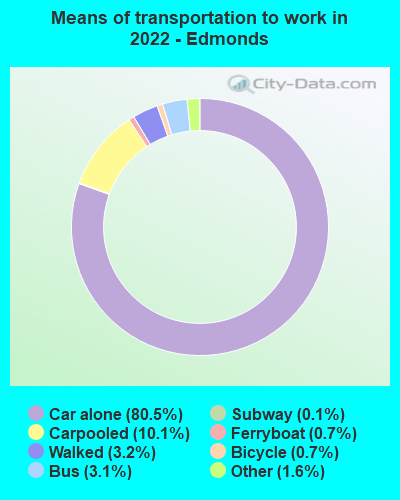
Means of transportation to work:
- Drove a car alone: 10,857 (54.6%)
- Carpooled: 1,454 (7.3%)
- Bus: 562 (2.8%)
- Long-distance train or commuter rail: 18 (0.1%)
- Ferryboat: 125 (0.6%)
- Taxi: 251 (1.3%)
- Bicycle: 59 (0.3%)
- Walked: 516 (2.6%)
- Worked at home: 6,529 (32.8%)
- Unemployment by race in 2022
- Unemployment rate for White non-Hispanic residents
- 3.4%Males
- 2.8%Females
- Unemployment rate for Black residents
- 3.4%Males
- 16.0%Females
- Unemployment rate for Asian residents
- 1.5%Females
- Unemployment rate for two or more race residents
- 6.9%Males
- 15.7%Females
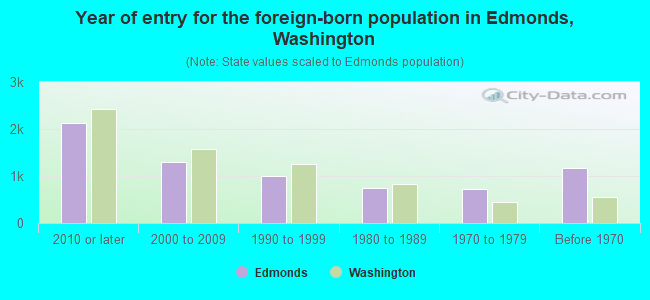
- Year of entry for the foreign-born population in Edmonds, Washington
- 2,1362010 or later
- 1,3012000 to 2009
- 1,0081990 to 1999
- 7521980 to 1989
- 7261970 to 1979
- 1,177Before 1970
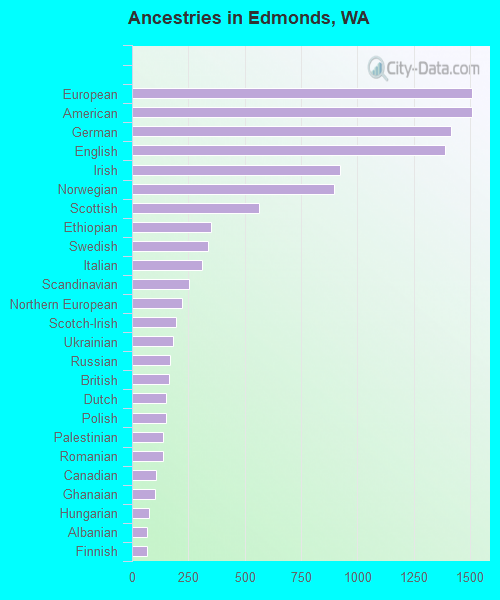
First ancestries reported:
- European: 1,509 (8.4%)
- American: 1,508 (8.4%)
- German: 1,417 (7.9%)
- English: 1,390 (7.7%)
- Irish: 922 (5.1%)
- Norwegian: 897 (5.0%)
- Scottish: 565 (3.1%)
- Ethiopian: 351 (1.9%)
- Swedish: 339 (1.9%)
- Italian: 309 (1.7%)
- Scandinavian: 254 (1.4%)
- Northern European: 224 (1.2%)
- Scotch-Irish: 194 (1.1%)
- Ukrainian: 181 (1.0%)
- Russian: 168 (0.9%)
- British: 164 (0.9%)
- Dutch: 152 (0.8%)
- Polish: 151 (0.8%)
- Palestinian: 139 (0.8%)
- Romanian: 137 (0.8%)
- Canadian: 108 (0.6%)
- Ghanaian: 100 (0.6%)
- Hungarian: 74 (0.4%)
- Albanian: 68 (0.4%)
- Finnish: 65 (0.4%)
- Croatian: 54 (0.3%)
- Welsh: 51 (0.3%)
- French Canadian: 50 (0.3%)
- Danish: 50 (0.3%)
- French: 48 (0.3%)
- Iranian: 46 (0.3%)
- Icelander: 40 (0.2%)
- African: 37 (0.2%)
- Belgian: 36 (0.2%)
- Eastern European: 35 (0.2%)
- Czech: 35 (0.2%)
- Portuguese: 34 (0.2%)
- Cajun: 26 (0.1%)
- Bulgarian: 26 (0.1%)
- Lithuanian: 25 (0.1%)
- Austrian: 25 (0.1%)
- Kenyan: 25 (0.1%)
- Egyptian: 24 (0.1%)
- South African: 18 (0.10%)
- Slovak: 18 (0.10%)
- Trinidadian and Tobagonian: 18 (0.10%)
- Lebanese: 13 (0.07%)
- Swiss: 10 (0.06%)
- Brazilian: 9 (0.05%)
- Somali: 6 (0.03%)
- Slavic: 4 (0.02%)
Most common places of birth for foreign-born residents (%):
| Edmonds: | 8.7% (546) |
| Washington: | 6.3% (71,661) |
| Edmonds: | 8.6% (545) |
| Washington: | 7.4% (84,470) |
| Edmonds: | 7.0% (440) |
| Washington: | 4.1% (47,238) |
| Edmonds: | 7.0% (439) |
| Washington: | 5.4% (62,003) |
| Edmonds: | 5.9% (374) |
| Washington: | 4.3% (48,886) |
| Edmonds: | 4.6% (287) |
| Washington: | 1.2% (13,745) |
| Edmonds: | 3.6% (228) |
| Washington: | 21.1% (241,655) |
| Edmonds: | 3.5% (222) |
| Washington: | 8.9% (101,353) |
| Edmonds: | 2.6% (163) |
| Washington: | 0.1% (1,457) |
| Edmonds: | 2.6% (161) |
| Washington: | 0.6% (6,500) |
| Edmonds: | 2.5% (158) |
| Washington: | 0.0% (396) |
| Edmonds: | 2.3% (146) |
| Washington: | 0.1% (1,702) |
| Edmonds: | 2.2% (136) |
| Washington: | 0.7% (7,568) |
| Edmonds: | 2.1% (132) |
| Washington: | 0.0% (503) |
| Edmonds: | 2.0% (125) |
| Washington: | 1.6% (17,938) |
| Edmonds: | 2.0% (125) |
| Washington: | 1.5% (17,453) |
| Edmonds: | 2.0% (124) |
| Washington: | 0.9% (9,937) |
| Edmonds: | 1.8% (111) |
| Washington: | 0.3% (3,373) |
| Edmonds: | 1.7% (106) |
| Washington: | 1.6% (17,761) |
| Edmonds: | 1.5% (97) |
| Washington: | 1.0% (10,943) |
Place of birth for U.S.-born residents:
- This state: 20,478
- Other state: 15,600
- Northeast: 2,305
- Midwest: 4,265
- South: 1,903
- West: 7,263
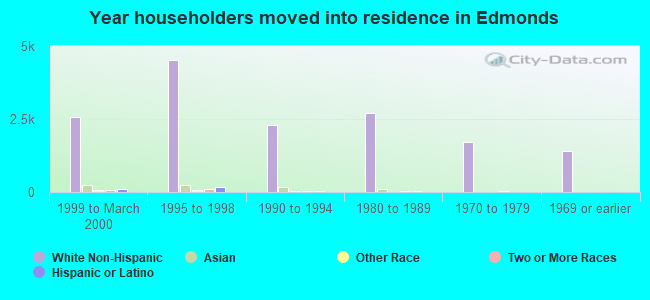
87.5% of Edmonds residents lived in the same house 1 years ago.
Out of people who lived in different houses, 29.9% lived in this county.
Out of people who lived in different counties, 72.4% lived in Washington.
| Edmonds: | 87.5% |
| State average: | 85.2% |
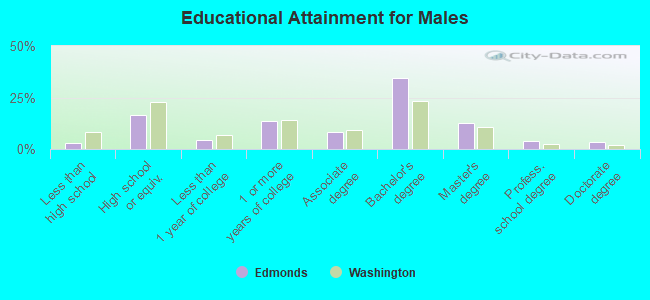
Education attainment for males 25 years and older:
- No schooling: 65
- Nursery to 4th grade: 26
- 5th and 6th grade: 91
- 7th and 8th grade: 0
- 9th grade: 132
- 10th grade: 8
- 11th grade: 25
- 12th grade, no diploma: 135
- High school graduate (or equivalency): 2,619
- Less than 1 year of college: 709
- Some college more than 1 year, no degree: 2,154
- Associate degree: 1,345
- Bachelor's degree: 5,514
- Master's degree: 2,000
- Professional school degree: 612
- Doctorate degree: 534
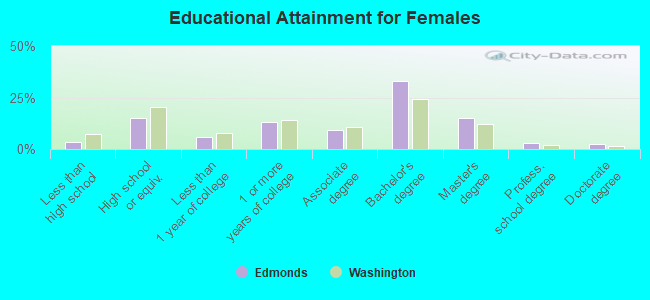
Education attainment for females 25 years and older:
- No schooling: 139
- Nursery to 4th grade: 7
- 5th and 6th grade: 125
- 7th and 8th grade: 46
- 9th grade: 84
- 10th grade: 68
- 11th grade: 8
- 12th grade, no diploma: 129
- High school graduate (or equivalency): 2,769
- Less than 1 year of college: 1,034
- Some college more than 1 year, no degree: 2,414
- Associate degree: 1,725
- Bachelor's degree: 6,009
- Master's degree: 2,780
- Professional school degree: 517
- Doctorate degree: 403
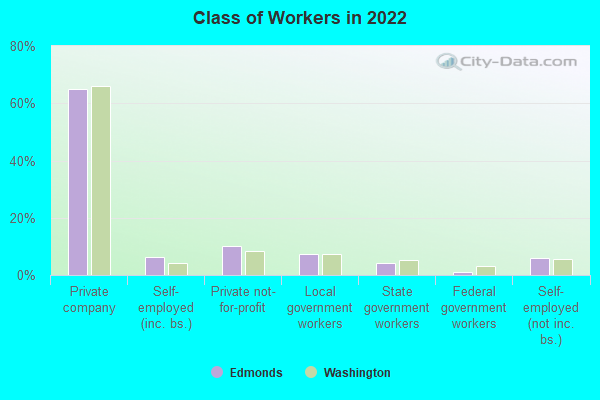
Housing units in structures:
- One, detached: 11,921
- One, attached: 818
- Two: 388
- 3 or 4: 685
- 5 to 9: 917
- 10 to 19: 1,594
- 20 to 49: 2,087
- 50 or more: 1,320
- Mobile homes: 61
- Boats, RVs, vans, etc.: 25
Median worth of mobile homes: $11,878
Housing units lacking complete kitchen facilities in 2022: 1.4%
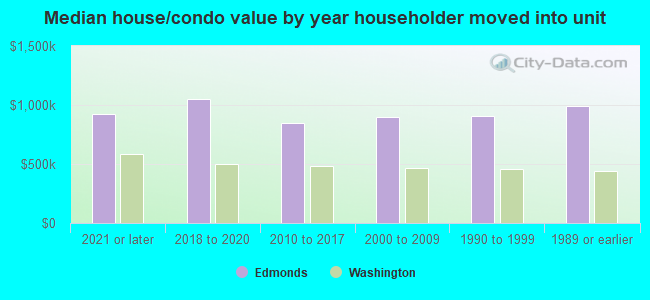
House/condo owner moved in on average 13 years ago
Renter moved in on average 2 years ago
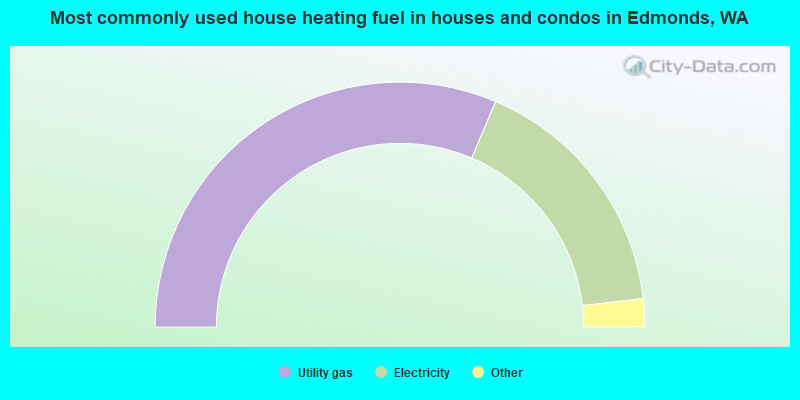
- 62.8%Utility gas
- 33.5%Electricity
- 1.9%Fuel oil, kerosene, etc.
- 1.0%Bottled, tank, or LP gas
- 0.4%Wood
- 0.3%Solar energy
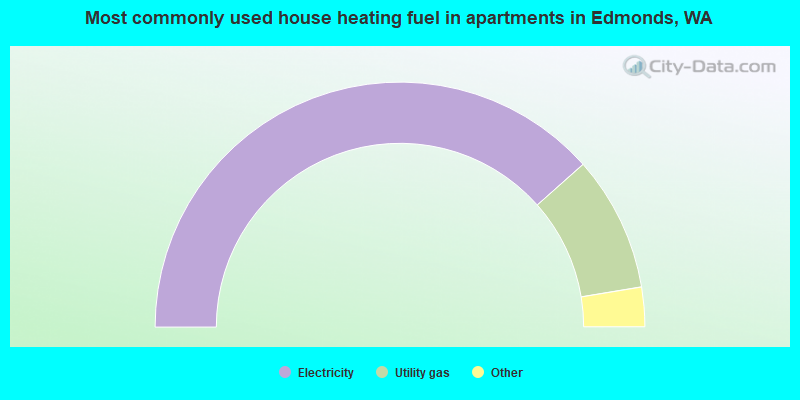
- 76.8%Electricity
- 17.9%Utility gas
- 2.2%Fuel oil, kerosene, etc.
- 1.3%No fuel used
- 1.1%Bottled, tank, or LP gas
- 0.3%Wood
- 0.3%Other fuel
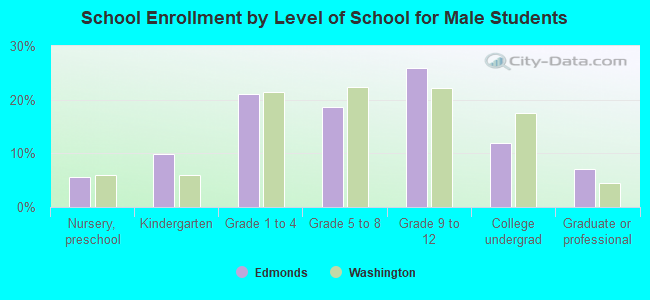
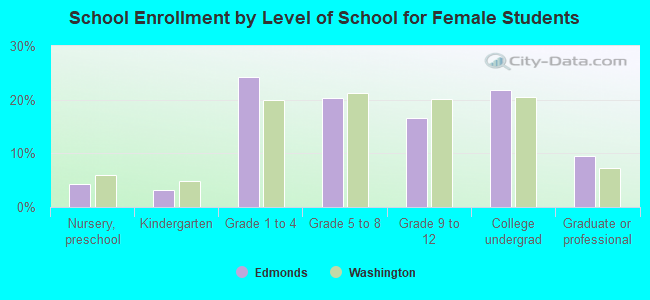
Private vs. public school enrollment:
| Here: | 15.9% |
| Washington: | 12.4% |
| Here: | 18.3% |
| Washington: | 9.2% |
| Here: | 12.4% |
| Washington: | 16.5% |