Ellicott City, MD (Maryland) Houses and Residents
Estimated median house or condo value in 2022: $628,000 (it was $237,800 in 2000 )
Ellicott City:
$628,000Maryland:
$398,100
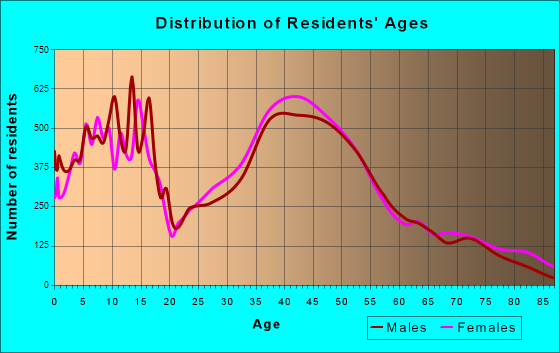
Lower value quartile - upper value quartile: $505,900 - $750,200Total population: 65,834 (Urban population: 55,835, Rural population: 474 (all nonfarm) )
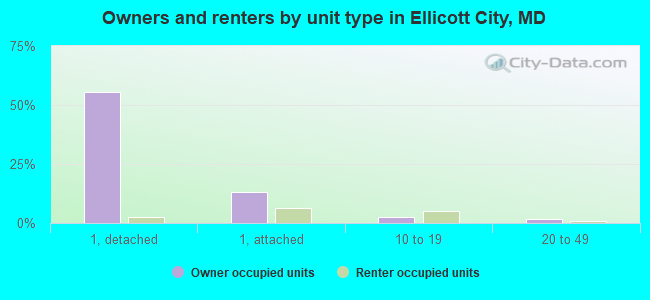
Houses: 27,059 (26,138 occupied: 19,446 owner occupied, 6,692 renter occupied )
% of renters here:
26%State:
32%
Housing density: 845 houses/condos per square mile
Median price asked for vacant for-sale houses and condos in 2022: $528,506.
Median contract rent in 2022: over $2,000 (lower quartile is $1,671, upper quartile is over $2,000)
Median rent asked for vacant for-rent units in 2022: $2,669
Median gross rent in Ellicott City, MD in 2022: over $2,000
Housing units in Ellicott City with a mortgage: 13,774 (1,917 second mortgage, 0 home equity loan, 1,736 both second mortgage and home equity loan )Houses without a mortgage: 321
Median household income for houses/condos with a mortgage: $193,194
Median household income for apartments without a mortgage: $160,911
Median monthly housing costs: $2,357
Data:
Median house or condo value ($)
Median house or condo value ($ change since 2000)
Median house or condo value ($) - White
Median house or condo value ($) - Black or African American
Median house or condo value ($) - Asian
Median house or condo value ($) - Hispanic or Latino
Median house or condo value ($) - American Indian and Alaska Native
Median house or condo value ($) - Multirace
Median house or condo value ($) - Other Race
Median price asked for mobile homes ($)
Household density (households per square mile)
Mean house or condo value by units in structure - 1, detached ($)
Mean house or condo value by units in structure - 1, attached ($)
Mean house or condo value by units in structure - 2 ($)
Mean house or condo value by units in structure by units in structure - 3 or 4 ($)
Mean house or condo value by units in structure - 5 or more ($)
Mean house or condo value by units in structure - Boat, RV, van, etc. ($)
Mean house or condo value by units in structure - Mobile home ($)
Median contract rent ($)
Median contract rent - Lower quartile ($)
Median contract rent - Upper quartile ($)
Median gross rent ($)
Urban houses (%)
Rural houses (%)
Houses occupied (%)
Houses occupied (% change since 2000)
Houses owner occupied (%)
Houses owner occupied (% change since 2000)
Houses renter occupied (%)
Houses renter occupied (% change since 2000)
Vacant housing units - For rent (%)
Vacant housing units - For rent (% change since 2000)
Vacant housing units - For sale only (%)
Vacant housing units - For sale only (% change since 2000)
Vacant housing units - Rented or sold, not occupied (%)
Vacant housing units - Rented or sold, not occupied (% change since 2000)
Vacant housing units - For seasonal, recreational, or occasional use (%)
Vacant housing units - For seasonal, recreational, or occasional use (% change since 2000)
Vacant housing units - For migrant workers (%)
Vacant housing units - For migrant workers (% change since 2000)
Vacant housing units - Other vacant (%)
Vacant housing units - Other vacant (% change since 2000)
Median monthly housing costs ($)
Median household income for houses/condos with a mortgage ($)
Median household income for houses/condos without a mortgage ($)
Median household income ($)
Median household income ($) - White
Median household income ($) - Black or African American
Median household income ($) - Asian
Median household income ($) - Hispanic or Latino
Median household income ($) - American Indian and Alaska Native
Median household income ($) - Multirace
Median household income ($) - Other Race
Mortgage status - with mortgage (%)
Mortgage status - with second mortgage (%)
Mortgage status - with home equity loan (%)
Mortgage status - with both second mortgage and home equity loan (%)
Mortgage status - without a mortgage (%)
Median year house/condo built
Median year apartment built
Household type by relationship - Male householder living alone (%)
Household type by relationship - Male householder not living alone (%)
Household type by relationship - Female householder living alone (%)
Household type by relationship - Female householder not living alone (%)
Household type by relationship - Opposite-Sex spouse (%)
Household type by relationship - Same-Sex spouse (%)
Household type by relationship - Opposite-Sex unmarried partner (%)
Household type by relationship - Same-Sex unmarried partner (%)
Household type by relationship - In group quarters (%)
Size of family households - 2-person household (%)
Size of family households - 3-person household (%)
Size of family households - 4-person household (%)
Size of family households - 5-person household (%)
Size of family households - 6-person household (%)
Size of family households - 7-or-more-person household (%)
Size of nonfamily households - 1-person household (%)
Size of nonfamily households - 2-person household (%)
Size of nonfamily households - 3-person household (%)
Size of nonfamily households - 4-person household (%)
Size of nonfamily households - 5-person household (%)
Size of nonfamily households - 6-person household (%)
Size of nonfamily households - 7-or-moreperson household (%)
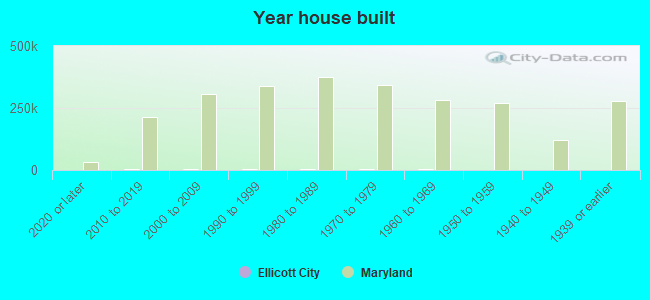
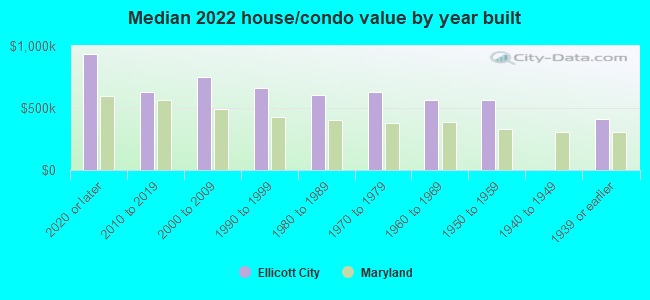
Year house built - Built 2010 or later (%)
Year house built - Built 2000 to 2009 (%)
Year house built - Built 1990 to 1999 (%)
Year house built - Built 1980 to 1989 (%)
Year house built - Built 1970 to 1979 (%)
Year house built - Built 1960 to 1969 (%)
Year house built - Built 1950 to 1959 (%)
Year house built - Built 1940 to 1949 (%)
Year house built - Built 1939 or earlier (%)
Median number of rooms in houses and condos
Median number of rooms in apartments
Median number of bedrooms in owner occupied houses
Mean number of bedrooms in owner occupied houses
Median number of bedrooms in renter occupied houses
Mean number of bedrooms in renter occupied houses
Median number of vehichles in owner occupied houses
Mean number of vehichles in owner occupied houses
Median number of vehichles in renter occupied houses
Mean number of vehichles in renter occupied houses
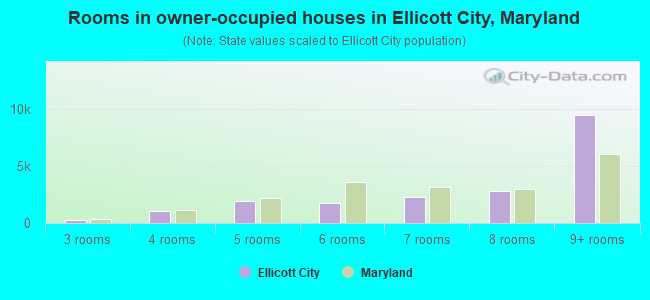
Rooms in owner-occupied houses - 1 room (%)
Rooms in owner-occupied houses - 2 rooms (%)
Rooms in owner-occupied houses - 3 rooms (%)
Rooms in owner-occupied houses - 4 rooms (%)
Rooms in owner-occupied houses - 5 rooms (%)
Rooms in owner-occupied houses - 6 rooms (%)
Rooms in owner-occupied houses - 7 rooms (%)
Rooms in owner-occupied houses - 8 rooms (%)
Rooms in owner-occupied houses - 9+ rooms (%)
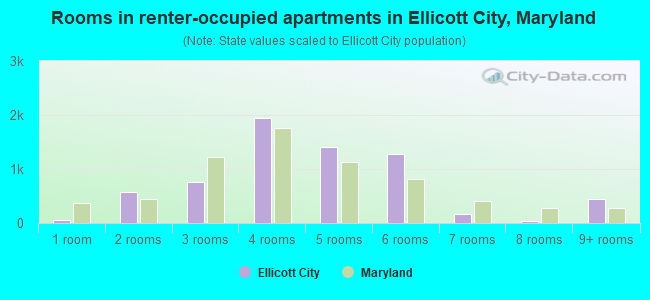
Rooms in renter-occupied houses - 1 room (%)
Rooms in renter-occupied houses - 2 rooms (%)
Rooms in renter-occupied houses - 3 rooms (%)
Rooms in renter-occupied houses - 4 rooms (%)
Rooms in renter-occupied houses - 5 rooms (%)
Rooms in renter-occupied houses - 6 rooms (%)
Rooms in renter-occupied houses - 7 rooms (%)
Rooms in renter-occupied houses - 8 rooms (%)
Rooms in renter-occupied houses - 9+ rooms (%)
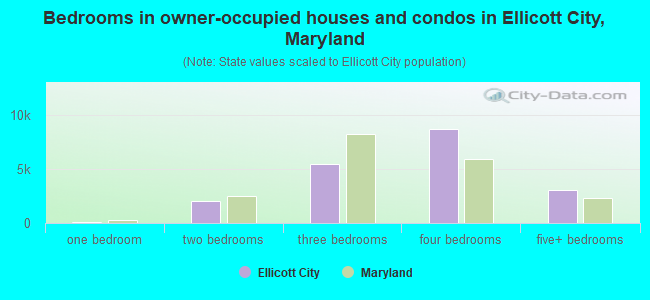
Bedrooms in owner-occupied houses - no bedrooms (%)
Bedrooms in owner-occupied houses - 1 bedroom (%)
Bedrooms in owner-occupied houses - 2 bedrooms (%)
Bedrooms in owner-occupied houses - 3 bedrooms (%)
Bedrooms in owner-occupied houses - 4 bedrooms (%)
Bedrooms in owner-occupied houses - 5+ bedrooms (%)
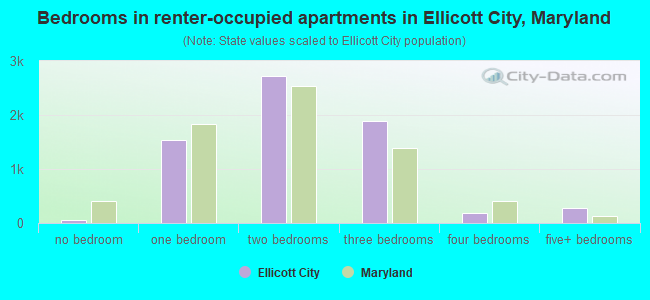
Bedrooms in renter-occupied houses - no bedrooms (%)
Bedrooms in renter-occupied houses - 1 bedroom (%)
Bedrooms in renter-occupied houses - 2 bedrooms (%)
Bedrooms in renter-occupied houses - 3 bedrooms (%)
Bedrooms in renter-occupied houses - 4 bedrooms (%)
Bedrooms in renter-occupied houses - 5+ bedrooms (%)
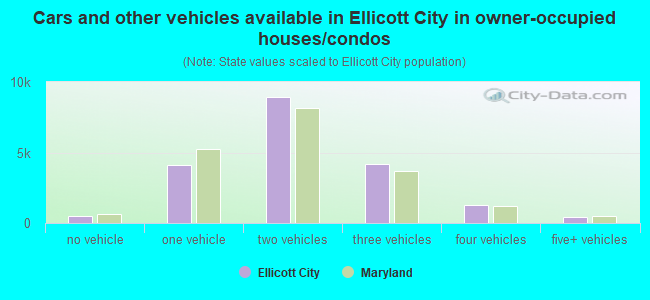
Vehicles available in owner-occupied houses - no vehicle available (%)
Vehicles available in owner-occupied houses - 1 vehicle available(%)
Vehicles available in owner-occupied houses - 2 Vehicles available (%)
Vehicles available in owner-occupied houses - 3 Vehicles available (%)
Vehicles available in owner-occupied houses - 4 Vehicles available (%)
Vehicles available in owner-occupied houses - 5+ Vehicles available (%)
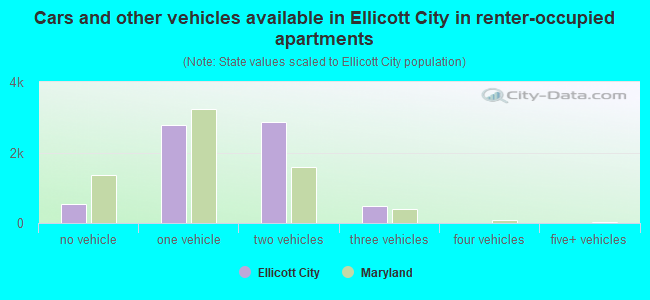
Vehicles available in renter-occupied houses - no vehicle available (%)
Vehicles available in renter-occupied houses - 1 vehicle available (%)
Vehicles available in renter-occupied houses - 2 Vehicles available (%)
Vehicles available in renter-occupied houses - 3 Vehicles available (%)
Vehicles available in renter-occupied houses - 4 Vehicles available (%)
Vehicles available in renter-occupied houses - 5+ Vehicles available (%)
Housing units in structures - 1, detached (%)
Housing units in structures - 1, attached (%)
Housing units in structures - 2 (%)
Housing units in structures - 3 or 4 (%)
Housing units in structures - 5 to 9 (%)
Housing units in structures - 10 to 19 (%)
Housing units in structures - 20 to 49 (%)
Housing units in structures - 50 or more (%)
Housing units in structures - Mobile home (%)
Housing units in structures - Boat, RV, van, etc. (%)
Housing units in structures - Owners - 1, detached (%)
Housing units in structures - Owners - 1, attached (%)
Housing units in structures - Owners - 2 (%)
Housing units in structures - Owners - 3 or 4 (%)
Housing units in structures - Owners - 5 to 9 (%)
Housing units in structures - Owners - 10 to 19 (%)
Housing units in structures - Owners - 20 to 49 (%)
Housing units in structures - Owners - 50 or more (%)
Housing units in structures - Owners - Mobile home (%)
Housing units in structures - Owners - Boat, RV, van, etc. (%)
Housing units in structures - Renters - 1, detached (%)
Housing units in structures - Renters - 1, attached (%)
Housing units in structures - Renters - 2 (%)
Housing units in structures - Renters - 3 or 4 (%)
Housing units in structures - Renters - 5 to 9 (%)
Housing units in structures - Renters - 10 to 19 (%)
Housing units in structures - Renters - 20 to 49 (%)
Housing units in structures - Renters - 50 or more (%)
Housing units in structures - Renters - Mobile home (%)
Housing units in structures - Renters - Boat, RV, van, etc. (%)
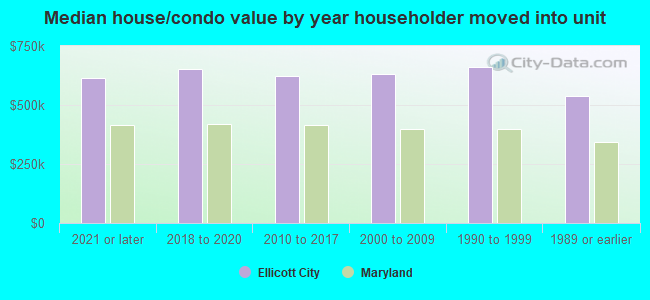
House/condo owner moved in on average (years ago)
Renter moved in on average (years ago)
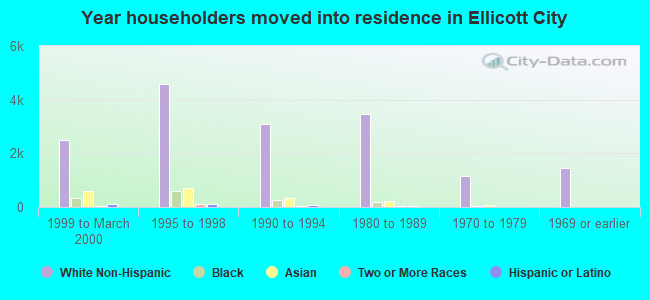
Year householder moved into unit - Moved in 1999 to March 2000 (%)
Year householder moved into unit - Moved in 1999 to March 2000 (%) - White
Year householder moved into unit - Moved in 1999 to March 2000 (%) - Black or African American
Year householder moved into unit - Moved in 1999 to March 2000 (%) - Asian
Year householder moved into unit - Moved in 1999 to March 2000 (%) - Hispanic or Latino
Year householder moved into unit - Moved in 1999 to March 2000 (%) - American Indian and Alaska Native
Year householder moved into unit - Moved in 1999 to March 2000 (%) - Multirace
Year householder moved into unit - Moved in 1999 to March 2000 (%) - Other Race
Year householder moved into unit - Moved in 1995 to 1998 (%)
Year householder moved into unit - Moved in 1995 to 1998 (%) - White
Year householder moved into unit - Moved in 1995 to 1998 (%) - Black or African American
Year householder moved into unit - Moved in 1995 to 1998 (%) - Asian
Year householder moved into unit - Moved in 1995 to 1998 (%) - Hispanic or Latino
Year householder moved into unit - Moved in 1995 to 1998 (%) - American Indian and Alaska Native
Year householder moved into unit - Moved in 1995 to 1998 (%) - Multirace
Year householder moved into unit - Moved in 1995 to 1998 (%) - Other Race
Year householder moved into unit - Moved in 1990 to 1994 (%)
Year householder moved into unit - Moved in 1990 to 1994 (%) - White
Year householder moved into unit - Moved in 1990 to 1994 (%) - Black or African American
Year householder moved into unit - Moved in 1990 to 1994 (%) - Asian
Year householder moved into unit - Moved in 1990 to 1994 (%) - Hispanic or Latino
Year householder moved into unit - Moved in 1990 to 1994 (%) - American Indian and Alaska Native
Year householder moved into unit - Moved in 1990 to 1994 (%) - Multirace
Year householder moved into unit - Moved in 1990 to 1994 (%) - Other Race
Year householder moved into unit - Moved in 1980 to 1989 (%)
Year householder moved into unit - Moved in 1980 to 1989 (%) - White
Year householder moved into unit - Moved in 1980 to 1989 (%) - Black or African American
Year householder moved into unit - Moved in 1980 to 1989 (%) - Asian
Year householder moved into unit - Moved in 1980 to 1989 (%) - Hispanic or Latino
Year householder moved into unit - Moved in 1980 to 1989 (%) - American Indian and Alaska Native
Year householder moved into unit - Moved in 1980 to 1989 (%) - Multirace
Year householder moved into unit - Moved in 1980 to 1989 (%) - Other Race
Year householder moved into unit - Moved in 1970 to 1979 (%)
Year householder moved into unit - Moved in 1970 to 1979 (%) - White
Year householder moved into unit - Moved in 1970 to 1979 (%) - Black or African American
Year householder moved into unit - Moved in 1970 to 1979 (%) - Asian
Year householder moved into unit - Moved in 1970 to 1979 (%) - Hispanic or Latino
Year householder moved into unit - Moved in 1970 to 1979 (%) - American Indian and Alaska Native
Year householder moved into unit - Moved in 1970 to 1979 (%) - Multirace
Year householder moved into unit - Moved in 1970 to 1979 (%) - Other Race
Year householder moved into unit - Moved in 1969 or earlier (%)
Year householder moved into unit - Moved in 1969 or earlier (%) - White
Year householder moved into unit - Moved in 1969 or earlier (%) - Black or African American
Year householder moved into unit - Moved in 1969 or earlier (%) - Asian
Year householder moved into unit - Moved in 1969 or earlier (%) - Hispanic or Latino
Year householder moved into unit - Moved in 1969 or earlier (%) - American Indian and Alaska Native
Year householder moved into unit - Moved in 1969 or earlier (%) - Multirace
Year householder moved into unit - Moved in 1969 or earlier (%) - Other Race
Housing units lacking complete plumbing facilities (%)
Housing units lacking complete kitchen facilities (%)
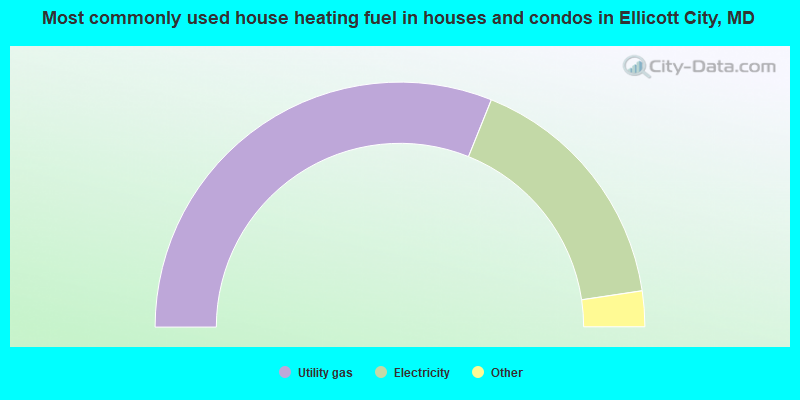
House heating fuel used in houses and condos - Utility gas (%)
House heating fuel used in houses and condos - Bottled, tank, or LP gas (%)
House heating fuel used in houses and condos - Electricity (%)
House heating fuel used in houses and condos - Fuel oil, kerosene, etc. (%)
House heating fuel used in houses and condos - Coal or coke (%)
House heating fuel used in houses and condos - Wood (%)
House heating fuel used in houses and condos - Solar energy (%)
House heating fuel used in houses and condos - Other fuel (%)
House heating fuel used in houses and condos - No fuel used (%)
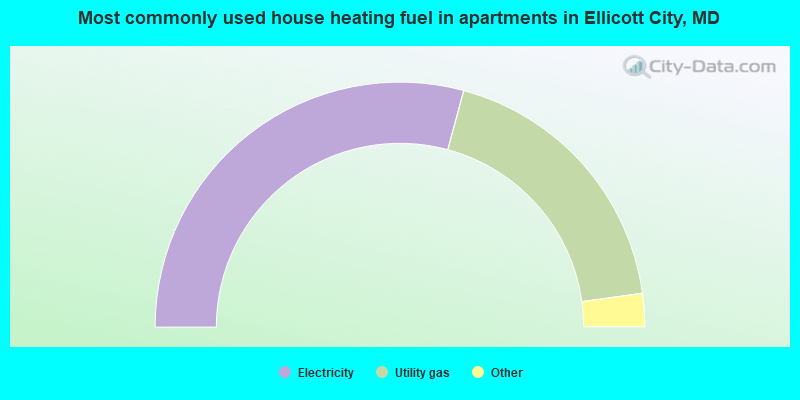
House heating fuel used in apartments - Utility gas (%)
House heating fuel used in apartments - Bottled, tank, or LP gas (%)
House heating fuel used in apartments - Electricity (%)
House heating fuel used in apartments - Fuel oil, kerosene, etc. (%)
House heating fuel used in apartments - Coal or coke (%)
House heating fuel used in apartments - Wood (%)
House heating fuel used in apartments - Solar energy (%)
House heating fuel used in apartments - Other fuel (%)
House heating fuel used in apartments - No fuel used (%)
Median year house/condo built: 1992Median year apartment built: 1995Household type by relationship:
Households: 73,239
Male householders: 14,891 (1,836 living alone ), Female householders: 11,247 (2,738 living alone )16,870 spouses (16,646 opposite-sex spouses ), 1,250 unmarried partners , (1,250 opposite-sex unmarried partners ), 25,176 children (24,633 natural , 0 adopted , 543 stepchildren ), 657 grandchildren , 289 brothers or sisters , 1,099 parents , 0 foster children , 179 other relatives , 934 non-relatives In group quarters: 647
Size of family households: 7,894 2-persons , 4,343 3-persons , 6,153 4-persons , 1,536 5-persons , 516 6-persons , 54 7-or-more-persons .
Size of nonfamily households: 4,574 1-person , 809 2-persons , 259 3-persons .
14,142 married couples with children. single-parent households (1,897 men , 1,922 women ).
66.5% of residents of Ellicott City speak English at home. of residents speak Spanish at home (75% speak English very well , 8% speak English well , 7% speak English not well , 10% don't speak English at all ).of residents speak other Indo-European language at home (80% speak English very well , 13% speak English well , 6% speak English not well ).of residents speak Asian or Pacific Island language at home (63% speak English very well , 19% speak English well , 17% speak English not well , 1% don't speak English at all ).of residents speak other language at home (90% speak English very well , 9% speak English well , 1% speak English not well ).
Foreign born population: 19,382 (26.5%)of them are naturalized citizens )
Median number of rooms in houses and condos:
Median number of rooms in apartments
Owner-occupied Renter-occupied
Rooms in owner-occupied houses in Ellicott City, Maryland
0 1 room 0 2 rooms 231 3 rooms 1,058 4 rooms 1,899 5 rooms 1,721 6 rooms 2,310 7 rooms 2,772 8 rooms 9,455 9+ rooms
Rooms in renter-occupied apartments in Ellicott City, Maryland
63 1 room 583 2 rooms 759 3 rooms 1,939 4 rooms 1,415 5 rooms 1,280 6 rooms 166 7 rooms 39 8 rooms 448 9+ rooms
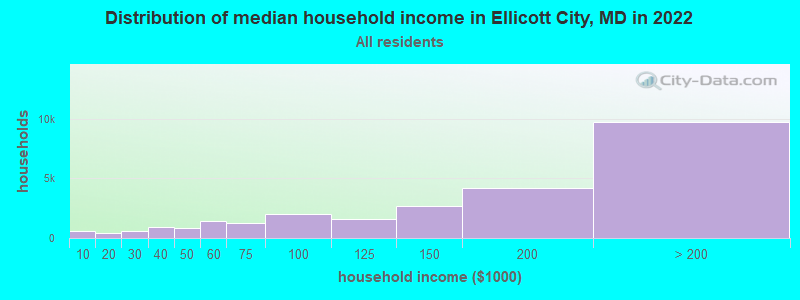
Ellicott City, MD household income distribution 598 Less than $10,000426 $10,000 to $19,999580 $20,000 to $29,999882 $30,000 to $39,999798 $40,000 to $49,9991,390 $50,000 to $59,9991,253 $60,000 to $74,9991,996 $75,000 to $99,9991,588 $100,000 to $124,9992,710 $125,000 to $149,9994,193 $150,000 to $199,9999,724 $200,000 or more
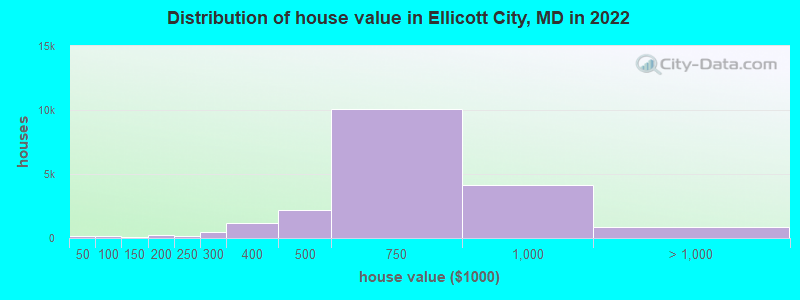
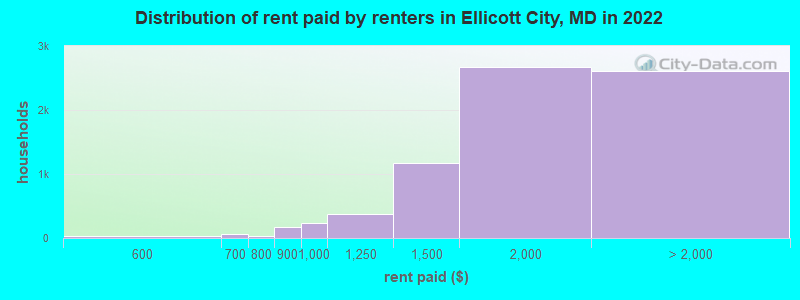
Home value of owner - occupied houses in 2022 in Ellicott City, MD 92 Less than $10,00016 $10,000 to $14,9993 $20,000 to $24,99920 $25,000 to $29,99930 $40,000 to $49,99921 $50,000 to $59,99933 $60,000 to $69,99948 $70,000 to $79,99931 $80,000 to $89,99932 $100,000 to $124,99911 $125,000 to $149,99913 $150,000 to $174,999211 $175,000 to $199,999170 $200,000 to $249,999436 $250,000 to $299,9991,139 $300,000 to $399,9992,200 $400,000 to $499,99910,062 $500,000 to $749,9994,144 $750,000 to $999,999654 $1,000,000 to $1,499,99940 $1,500,000 to $1,999,999156 $2,000,000 or moreRent paid by renters in 2022 in Ellicott City, MD 23 Less than $10033 $550 to $59942 $600 to $64925 $650 to $69934 $750 to $799166 $800 to $899237 $900 to $999374 $1,000 to $1,2491,171 $1,250 to $1,4992,665 $1,500 to $1,9991,103 $2,000 to $2,499668 $2,500 to $2,999217 $3,000 to $3,499349 $3,500 or more269 No cash rent
Percentage of workers working in this county: 52.4%Number of people working at home: 9,608 (25.3% of all workers )
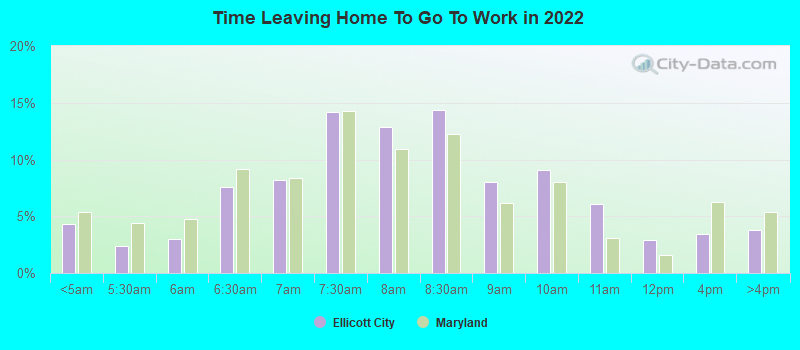
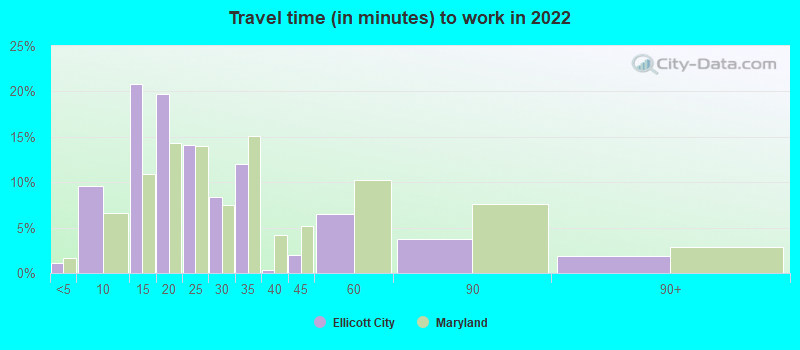
Travel time to work (commute)
Less than 5 minutes: 805 to 9 minutes: 1,48110 to 14 minutes: 2,29915 to 19 minutes: 3,80920 to 24 minutes: 5,26525 to 29 minutes: 3,45330 to 34 minutes: 3,89735 to 39 minutes: 1,77440 to 44 minutes: 1,22845 to 59 minutes: 3,72960 to 89 minutes: 1,54190 or more minutes: 774
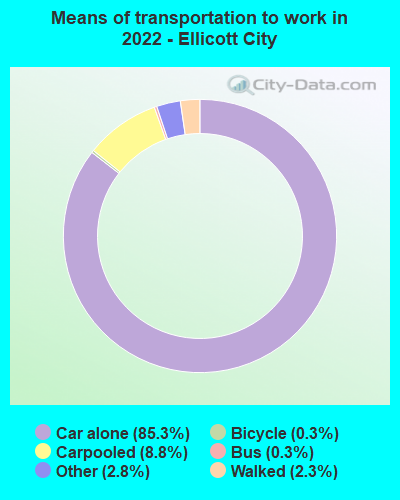
Means of transportation to work:
Drove a car alone: 15,710 (57.7%)Carpooled: 1,857 (6.8%)Bus : 50 (0.2%)Long-distance train or commuter rail : 13 (0.0%)Taxi: 483 (1.8%)Bicycle: 61 (0.2%)Walked: 343 (1.3%)Worked at home: 9,608 (35.3%)
Unemployment by race in 2022
Unemployment rate for White non-Hispanic residents 1.0% Males5.0% FemalesUnemployment rate for Black residents 4.6% Males5.1% FemalesUnemployment rate for Asian residents 1.0% MalesUnemployment rate for other race residents 7.6% Males9.8% FemalesUnemployment rate for two or more race residents 7.8% FemalesUnemployment rate for Hispanic or Latino residents 2.8% Males1.5% Females
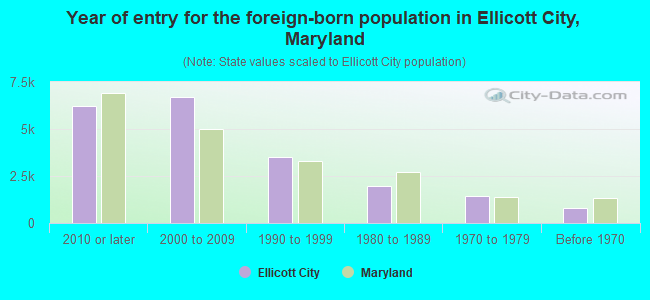
Year of entry for the foreign-born population in Ellicott City, Maryland
6,210 2010 or later 6,697 2000 to 2009 3,504 1990 to 1999 1,986 1980 to 1989 1,450 1970 to 1979 816 Before 1970
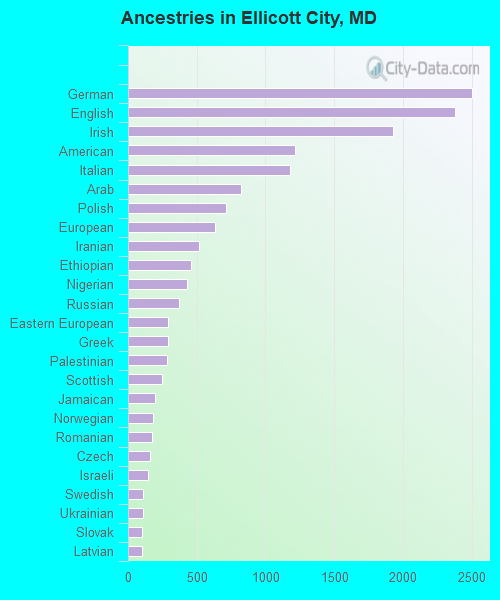
First ancestries reported:
German: 2,502 (6.3%)
English: 2,378 (5.9%)
Irish: 1,932 (4.8%)
American: 1,217 (3.0%)
Italian: 1,178 (2.9%)
Arab: 825 (2.1%)
Polish: 712 (1.8%)
European: 632 (1.6%)
Iranian: 515 (1.3%)
Ethiopian: 461 (1.2%)
Nigerian: 432 (1.1%)
Russian: 372 (0.9%)
Eastern European: 294 (0.7%)
Greek: 289 (0.7%)
Palestinian: 284 (0.7%)
Scottish: 247 (0.6%)
Jamaican: 199 (0.5%)
Norwegian: 182 (0.5%)
Romanian: 172 (0.4%)
Czech: 162 (0.4%)
Israeli: 145 (0.4%)
Swedish: 109 (0.3%)
Ukrainian: 107 (0.3%)
Slovak: 101 (0.3%)
Latvian: 99 (0.2%)
Turkish: 96 (0.2%)
British: 94 (0.2%)
Scotch-Irish: 87 (0.2%)
African: 80 (0.2%)
Finnish: 66 (0.2%)
Czechoslovakian: 63 (0.2%)
Hungarian: 62 (0.2%)
French: 62 (0.2%)
Haitian: 61 (0.2%)
Kenyan: 59 (0.1%)
Cape Verdean: 53 (0.1%)
Ghanaian: 52 (0.1%)
Lebanese: 51 (0.1%)
Swiss: 47 (0.1%)
Jordanian: 46 (0.1%)
British West Indian: 44 (0.1%)
Scandinavian: 42 (0.1%)
Portuguese: 42 (0.1%)
French Canadian: 38 (0.09%)
Austrian: 35 (0.09%)
Moroccan: 32 (0.08%)
Dutch: 32 (0.08%)
Croatian: 29 (0.07%)
Egyptian: 25 (0.06%)
Northern European: 23 (0.06%)
Slavic: 22 (0.05%)
Lithuanian: 22 (0.05%)
Trinidadian and Tobagonian: 20 (0.05%)
Brazilian: 17 (0.04%)
Welsh: 15 (0.04%)
Syrian: 15 (0.04%)
Estonian: 13 (0.03%)
Sierra Leonean: 13 (0.03%)
Yugoslavian: 12 (0.03%)
Serbian: 11 (0.03%)
Bulgarian: 10 (0.02%)
South African: 9 (0.02%)
Australian: 5 (0.01%)
Most common places of birth for foreign-born residents (%): India Ellicott City:
27.6% (5,798)Maryland:
6.4% (61,725)
Korea Ellicott City:
18.6% (3,897)Maryland:
3.4% (32,635)
China, excluding Hong Kong and Taiwan Ellicott City:
12.8% (2,677)Maryland:
4.6% (44,742)
Nepal Ellicott City:
2.7% (557)Maryland:
1.1% (10,205)
Israel Ellicott City:
2.4% (505)Maryland:
0.4% (3,756)
Nigeria Ellicott City:
2.3% (482)Maryland:
4.6% (44,825)
Honduras Ellicott City:
2.1% (451)Maryland:
2.5% (24,026)
Jordan Ellicott City:
1.8% (383)Maryland:
0.1% (1,277)
El Salvador Ellicott City:
1.7% (348)Maryland:
12.0% (115,412)
Iran Ellicott City:
1.6% (330)Maryland:
1.3% (12,074)
Place of birth for U.S.-born residents:
This state: 30,845Other state: 21,589Northeast: 8,594Midwest: 2,434South: 7,828West: 2,733 87.8% of Ellicott City residents lived in the same house 1 years ago.
Out of people who lived in different houses, 24.0% lived in this county.
Out of people who lived in different counties, 58.2% lived in Maryland.
Ellicott City:
87.8%State average:
88.5%
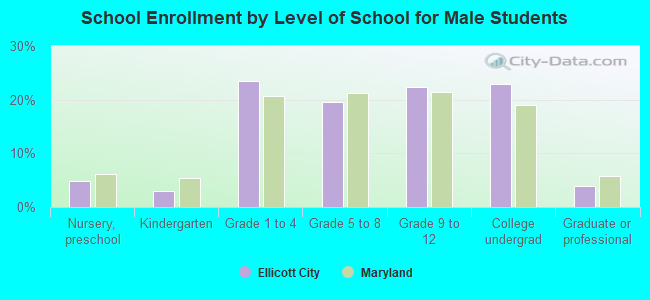
Education attainment for males 25 years and older:
No schooling: 296Nursery to 4th grade: 585th and 6th grade: 597th and 8th grade: 1159th grade: 010th grade: 011th grade: 012th grade, no diploma: 261High school graduate (or equivalency): 1,979Less than 1 year of college: 612Some college more than 1 year, no degree: 1,445Associate degree: 1,665Bachelor's degree: 7,788Master's degree: 5,315Professional school degree: 1,408Doctorate degree: 1,936
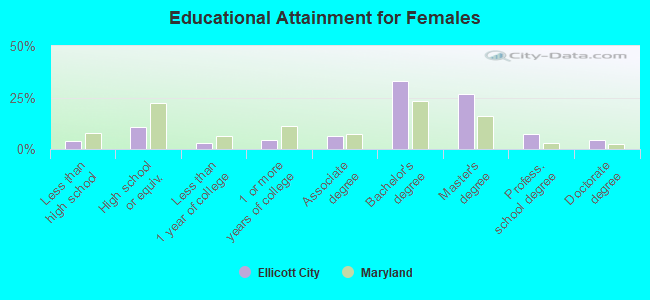
Education attainment for females 25 years and older:
No schooling: 185Nursery to 4th grade: 05th and 6th grade: 2017th and 8th grade: 519th grade: 25410th grade: 911th grade: 3612th grade, no diploma: 184High school graduate (or equivalency): 2,677Less than 1 year of college: 792Some college more than 1 year, no degree: 1,145Associate degree: 1,646Bachelor's degree: 8,337Master's degree: 6,779Professional school degree: 1,803Doctorate degree: 1,134
Housing units in structures:
One, detached: 15,382One, attached: 5,329Two: 1823 or 4: 1475 to 9: 2,69210 to 19: 2,03820 to 49: 67750 or more: 612House/condo owner moved in on average 12 years ago
Renter moved in on average 0 years ago
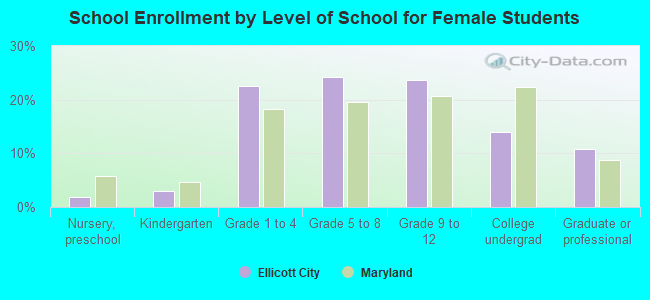
Private vs. public school enrollment:
Students in private schools in grades 1 to 8 (elementary and middle school): 1,173 Students in private schools in grades 9 to 12 (high school): 709 Students in private undergraduate colleges: 630