Englewood, TN (Tennessee) Houses and Residents
| Englewood: | $116,448 |
| Tennessee: | $284,800 |
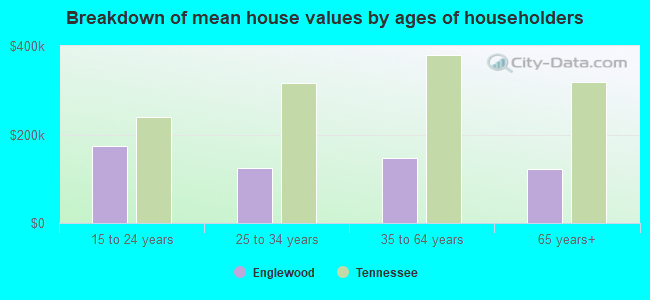
Mean price in 2022:
Detached houses: $158,790
Here: $158,790 State: $374,382 Mobile homes: $70,447
Here: $70,447 State: $101,421
Total population: 1,532 (Urban population: 0, Rural population: 1,587 (21 farm, 1,566 nonfarm))
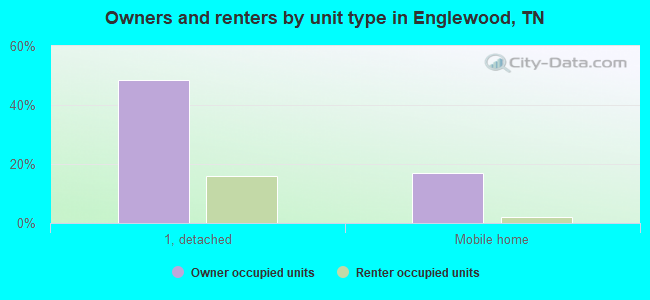
Houses: 801 (696 occupied: 466 owner occupied, 242 renter occupied)
| % of renters here: | 34% |
| State: | 33% |
Housing density: 471 houses/condos per square mile
Median price asked for vacant for-sale houses and condos in 2022: $112,038.
Median contract rent in 2022: $586 (lower quartile is $303, upper quartile is $673)
Median rent asked for vacant for-rent units in 2022: $1,920
Median gross rent in Englewood, TN in 2022: $734
Housing units in Englewood with a mortgage: 226 (21 second mortgage, 0 home equity loan, 13 both second mortgage and home equity loan)
Houses without a mortgage: 6
Median household income for houses/condos with a mortgage: $50,770
Median household income for apartments without a mortgage: $47,055
Median monthly housing costs: $672
Compare current foreclosures near Englewood, TN:
| Photo | Address | Area | Beds / Baths | Price | Details |
|---|---|---|---|---|---|

|
#1
County Road 571
Englewood, TN 37329
|
640 sq. feet
|
1 baths - beds |
show details | |

|
#2
Buck Brown St
Englewood, TN 37329
|
1,092 sq. feet
|
1 baths - beds |
show details | |

|
#3
Sunset Ave
Englewood, TN 37329
|
1,060 sq. feet
|
1 baths - beds |
show details | |

|
#4
County Road 464
Englewood, TN 37329
|
- sq. feet
|
- baths - beds |
show details | |

|
#5
County Road 480
Englewood, TN 37329
|
700 sq. feet
|
- baths - beds |
show details | |

|
#6
County Road 520
Englewood, TN 37329
|
- sq. feet
|
- baths - beds |
show details | |

|
#7
County Road 480
Englewood, TN 37329
|
- sq. feet
|
- baths - beds |
show details | |

|
#8
Chestuee St
Englewood, TN 37329
|
720 sq. feet
|
- baths - beds |
show details | |

|
#9
W Athens St
Englewood, TN 37329
|
- sq. feet
|
- baths - beds |
show details | |

|
#10
Harris Rd
Englewood, TN 37329
|
- sq. feet
|
- baths - beds |
show details |
| Photo | Address | Area | Beds / Baths | Price | Details |
|---|---|---|---|---|---|

|
#11
County Road 461
Englewood, TN 37329
|
- sq. feet
|
- baths - beds |
show details | |

|
#12
County Road 470
Englewood, TN 37329
|
1,280 sq. feet
|
- baths - beds |
show details | |

|
#13
Star Mountain Rd
Englewood, TN 37329
|
- sq. feet
|
- baths - beds |
show details | |

|
#14
County Road 110
Athens, TN 37303
|
3,014 sq. feet
|
2 baths 4 beds |
show details | |

|
#15
Dunn St
Etowah, TN 37331
|
1,398 sq. feet
|
1 baths 3 beds |
show details | |

|
#16
Edgemon Rd
Sweetwater, TN 37874
|
- sq. feet
|
3 baths 5 beds |
show details | |

|
#17
County Road 750
Athens, TN 37303
|
1,480 sq. feet
|
2 baths 3 beds |
show details | |

|
#18
Monroe Cir
Madisonville, TN 37354
|
1,008 sq. feet
|
1 baths - beds |
show details | |

|
#19
Price Rd
Reliance, TN 37369
|
952 sq. feet
|
1 baths - beds |
show details | |

|
#20
County Road 265
Niota, TN 37826
|
1,176 sq. feet
|
1 baths - beds |
show details |
| Photo | Address | Area | Beds / Baths | Price | Details |
|---|---|---|---|---|---|

|
#21
County Road 609
Etowah, TN 37331
|
1,320 sq. feet
|
2 baths - beds |
show details | |

|
#22
Towee Falls Rd
Tellico Plains, TN 37385
|
1,372 sq. feet
|
1 baths - beds |
show details | |

|
#23
Gaut Ave
Sweetwater, TN 37874
|
1,605 sq. feet
|
2 baths - beds |
show details | |

|
#24
Carroll St
Etowah, TN 37331
|
1,209 sq. feet
|
2 baths - beds |
show details | |

|
#25
County Road 347
Sweetwater, TN 37874
|
1,377 sq. feet
|
2 baths - beds |
show details | |

|
#26
Hill Loop
Madisonville, TN 37354
|
1,025 sq. feet
|
1 baths - beds |
show details | |

|
#27
Virgil Crump Rd
Delano, TN 37325
|
1,300 sq. feet
|
1 baths - beds |
show details | |

|
#28
Stephens Dr
Madisonville, TN 37354
|
1,138 sq. feet
|
2 baths - beds |
show details | |

|
#29
Forkners Chapel Rd
Sweetwater, TN 37874
|
1,248 sq. feet
|
2 baths - beds |
show details | |

|
#30
County Road 756
Riceville, TN 37370
|
1,256 sq. feet
|
1 baths - beds |
show details |
| Photo | Address | Area | Beds / Baths | Price | Details |
|---|---|---|---|---|---|

|
#31
County Road 609
Etowah, TN 37331
|
1,674 sq. feet
|
2 baths - beds |
show details | |

|
#32
Underwood Rd
Sweetwater, TN 37874
|
1,920 sq. feet
|
1 baths - beds |
show details | |

|
#33
Locke Ln
Benton, TN 37307
|
1,792 sq. feet
|
4 baths - beds |
show details | |

|
#34
Roberts Ln
Tellico Plains, TN 37385
|
1,664 sq. feet
|
2 baths - beds |
show details | |

|
#35
Highway 11 S
Riceville, TN 37370
|
2,046 sq. feet
|
2 baths - beds |
show details | |

|
#36
Warren St
Athens, TN 37303
|
1,129 sq. feet
|
1 baths - beds |
show details | |

|
#37
Sharp Rd
Athens, TN 37303
|
1,084 sq. feet
|
2 baths - beds |
show details | |

|
#38
Ridgeway Cir
Athens, TN 37303
|
1,650 sq. feet
|
1 baths - beds |
show details | |

|
#39
Williams St
Athens, TN 37303
|
850 sq. feet
|
1 baths - beds |
show details | |

|
#40
Bryson St
Athens, TN 37303
|
950 sq. feet
|
1 baths - beds |
show details |
| Photo | Address | Area | Beds / Baths | Price | Details |
|---|---|---|---|---|---|

|
#41
Glenlock Rd
Sweetwater, TN 37874
|
1,144 sq. feet
|
3 baths - beds |
show details | |

|
#42
Hitchcock Ave
Etowah, TN 37331
|
1,044 sq. feet
|
1 baths - beds |
show details | |

|
#43
Warren St
Athens, TN 37303
|
960 sq. feet
|
1 baths - beds |
show details | |

|
#44
Katie St
Madisonville, TN 37354
|
1,144 sq. feet
|
2 baths - beds |
show details | |

|
#45
Perimeter Rd
Benton, TN 37307
|
2,236 sq. feet
|
1 baths - beds |
show details | |

|
#46
Linsdale Rd
Delano, TN 37325
|
1,680 sq. feet
|
2 baths - beds |
show details | |

|
#47
Brentwood Dr
Athens, TN 37303
|
3,048 sq. feet
|
2 baths - beds |
show details | |

|
#48
County Road 250
Niota, TN 37826
|
1,920 sq. feet
|
2 baths - beds |
show details | |

|
#49
County Road 634
Athens, TN 37303
|
944 sq. feet
|
1 baths - beds |
show details | |

|
Check over 1 million property listings on Foreclosure.com!
|
browse all offers | |||

Latest news about housing in Englewood, TN collected exclusively by city-data.com from local newspapers, TV, and radio stations

 | Info on Englewood, TN? (0 replies) |
| Athens, Etowah, Engleside, Cleveland??????? (5 replies) |
| What do you LIKE and DISLIKE about living in Knoxville? (191 replies) |
| Whats the scoop on Englewood, TN? (2 replies) |
| Looking for a small safe town in Tennessee to raise our kids (13 replies) |
| A few different areas (12 replies) |

Median year apartment built: 1966
Household type by relationship:
Households: 1,675- Male householders: 262 (44 living alone), Female householders: 425 (144 living alone)
340 spouses (332 opposite-sex spouses), 13 unmarried partners, (13 opposite-sex unmarried partners), 447 children (370 natural, 29 adopted, 46 stepchildren), 69 grandchildren, 19 brothers or sisters, 15 parents, 14 foster children, 50 other relatives, 17 non-relatives
Size of family households: 214 2-persons, 144 3-persons, 108 4-persons, 34 5-persons, 3 6-persons, 10 7-or-more-persons.
Size of nonfamily households: 192 1-person.
241 married couples with children.
95 single-parent households (24 men, 71 women).
97.2% of residents of Englewood speak English at home.
2.3% of residents speak Spanish at home (100% speak English very well).
0.3% of residents speak other Indo-European language at home (100% speak English very well).
Foreign born population: 21 (1.3%)
(33.3% of them are naturalized citizens)
| Here: | 5.6 |
| State: | 6.5 |
| Here: | 4.5 |
| State: | 4.4 |
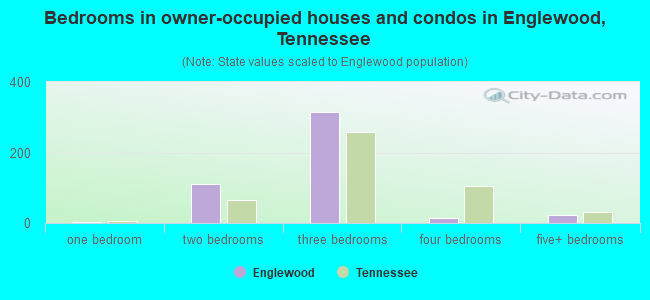
- Bedrooms in owner-occupied houses and condos in Englewood, Tennessee
- 0no bedroom
- 21 bedroom
- 1102 bedrooms
- 3163 bedrooms
- 154 bedrooms
- 245+ bedrooms
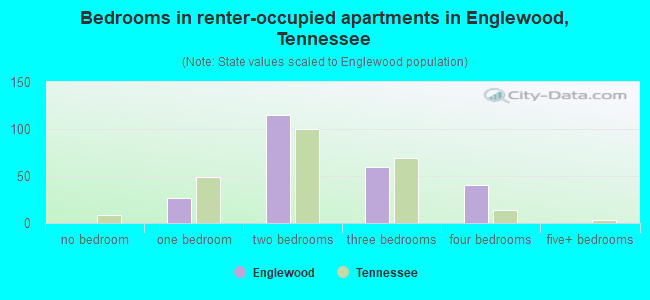
- Bedrooms in renter-occupied apartments in Englewood, Tennessee
- 0no bedroom
- 271 bedroom
- 1152 bedrooms
- 603 bedrooms
- 404 bedrooms
- 05+ bedrooms
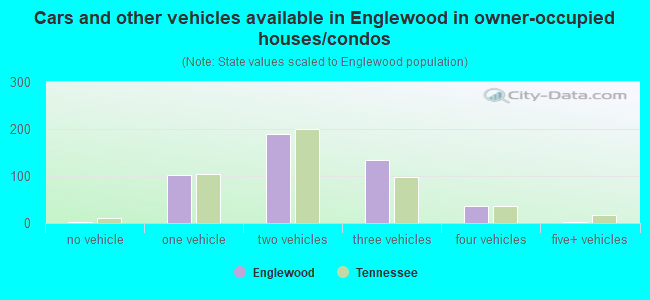
- Cars and other vehicles available in Englewood in owner-occupied houses/condos
- 3no vehicle
- 1021 vehicle
- 1902 vehicles
- 1333 vehicles
- 364 vehicles
- 35+ vehicles
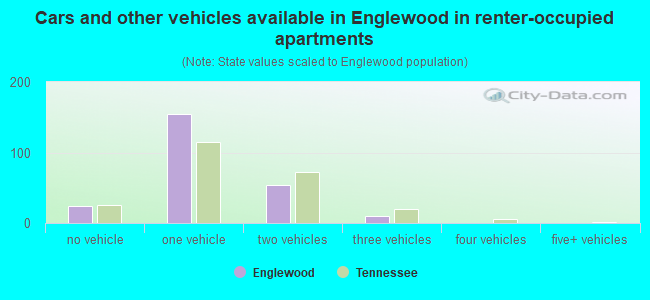
- Cars and other vehicles available in Englewood in renter-occupied apartments
- 24no vehicle
- 1541 vehicle
- 542 vehicles
- 103 vehicles
- 04 vehicles
- 05+ vehicles
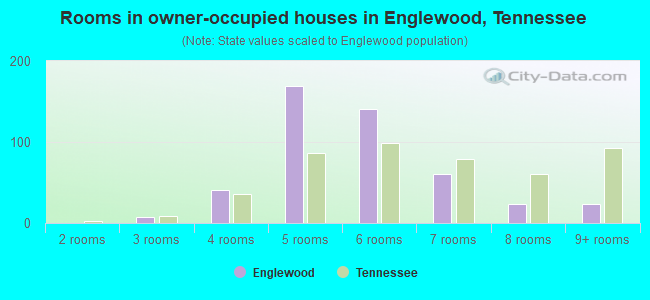
- Rooms in owner-occupied houses in Englewood, Tennessee
- 01 room
- 02 rooms
- 83 rooms
- 414 rooms
- 1695 rooms
- 1416 rooms
- 617 rooms
- 238 rooms
- 249+ rooms
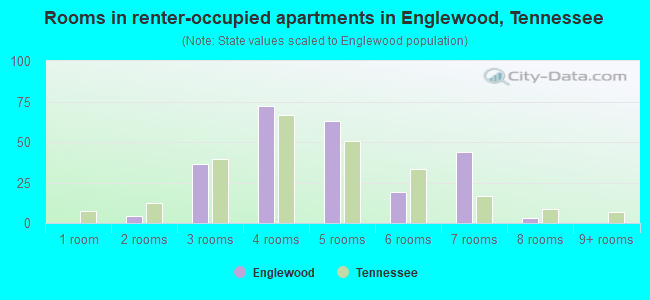
- Rooms in renter-occupied apartments in Englewood, Tennessee
- 01 room
- 42 rooms
- 373 rooms
- 724 rooms
- 635 rooms
- 196 rooms
- 447 rooms
- 38 rooms
- 09+ rooms
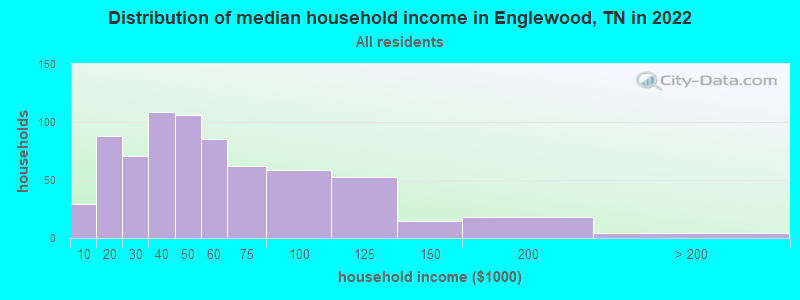
Englewood, TN household income distribution

- 29Less than $10,000
- 88$10,000 to $19,999
- 71$20,000 to $29,999
- 109$30,000 to $39,999
- 106$40,000 to $49,999
- 85$50,000 to $59,999
- 62$60,000 to $74,999
- 59$75,000 to $99,999
- 53$100,000 to $124,999
- 15$125,000 to $149,999
- 18$150,000 to $199,999
- 4$200,000 or more
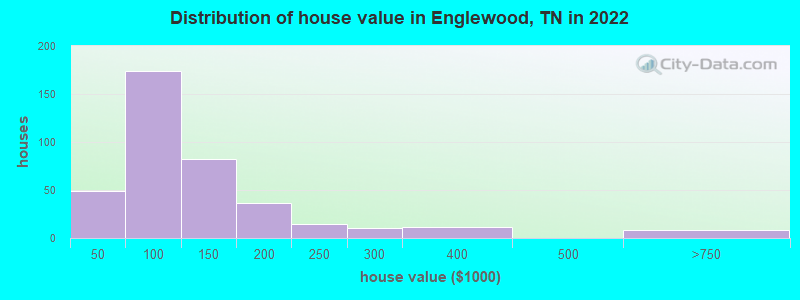
Home value of owner - occupied houses in 2022 in Englewood, TN
-
- 8Less than $10,000
- 10$20,000 to $24,999
- 6$35,000 to $39,999
- 24$40,000 to $49,999
- 3$50,000 to $59,999
- 12$60,000 to $69,999
- 54$70,000 to $79,999
- 51$80,000 to $89,999
- 26$90,000 to $99,999
- 46$100,000 to $124,999
- 34$125,000 to $149,999
- 12$150,000 to $174,999
- 23$175,000 to $199,999
- 14$200,000 to $249,999
- 9$250,000 to $299,999
- 11$300,000 to $399,999
- 4$500,000 to $749,999
- 2$1,000,000 to $1,499,999
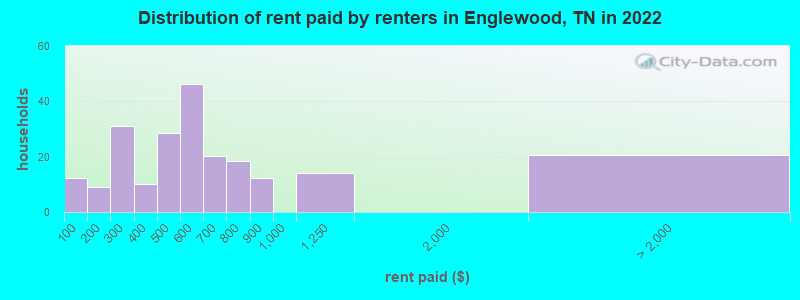
Rent paid by renters in 2022 in Englewood, TN
-
- 12Less than $100
- 9$100 to $149
- 27$200 to $249
- 3$250 to $299
- 10$300 to $349
- 26$400 to $449
- 2$450 to $499
- 19$500 to $549
- 26$550 to $599
- 20$600 to $649
- 8$700 to $749
- 9$750 to $799
- 12$800 to $899
- 14$1,000 to $1,249
- 20No cash rent
Percentage of workers working in this county: 71.5%
Number of people working at home: 27 (4.5% of all workers)
Travel time to work (commute)
- Less than 5 minutes: 38
- 5 to 9 minutes: 30
- 10 to 14 minutes: 82
- 15 to 19 minutes: 129
- 20 to 24 minutes: 69
- 25 to 29 minutes: 24
- 30 to 34 minutes: 97
- 35 to 39 minutes: 8
- 40 to 44 minutes: 6
- 45 to 59 minutes: 52
- 60 to 89 minutes: 14
- 90 or more minutes: 0
Means of transportation to work:
- Drove a car alone: 455 (81.0%)
- Carpooled: 89 (15.8%)
- Bus or trolley bus: 5 (0.9%)
- Walked: 5 (0.9%)
- Other means: 3 (0.5%)
- Worked at home: 5 (0.9%)
- Unemployment by race in 2022
- Unemployment rate for White non-Hispanic residents
- 12.6%Males
- 2.3%Females
- Unemployment rate for two or more race residents
- 88.1%Females
- Unemployment rate for Hispanic or Latino residents
- 78.3%Females
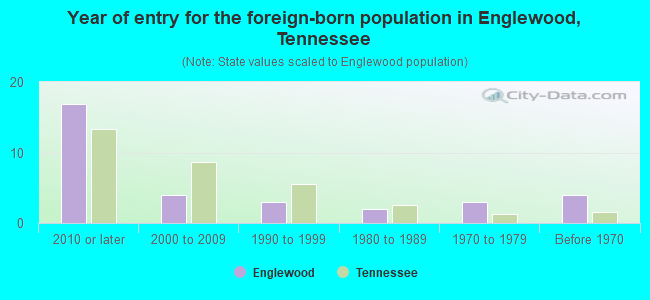
- Year of entry for the foreign-born population in Englewood, Tennessee
- 172010 or later
- 42000 to 2009
- 31990 to 1999
- 21980 to 1989
- 31970 to 1979
- 4Before 1970
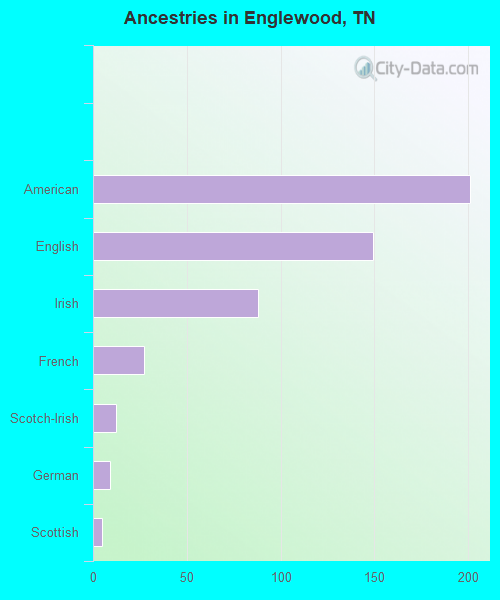
First ancestries reported:
- American: 201 (29.4%)
- English: 149 (21.8%)
- Irish: 88 (12.9%)
- French: 27 (3.9%)
- Scotch-Irish: 12 (1.8%)
- German: 9 (1.3%)
- Scottish: 5 (0.7%)
- Czechoslovakian: 1 (0.1%)
- Italian: 1 (0.1%)
Most common places of birth for foreign-born residents (%):
| Englewood: | 95.2% (20) |
| Tennessee: | 4.6% (17,433) |
| Englewood: | 28.6% (6) |
| Tennessee: | 6.1% (23,079) |
Place of birth for U.S.-born residents:
- This state: 1,191
- Other state: 450
- Northeast: 56
- Midwest: 109
- South: 251
- West: 32
92.5% of Englewood residents lived in the same house 1 years ago.
Out of people who lived in different houses, 39.2% lived in this county.
Out of people who lived in different counties, 82.4% lived in Tennessee.
| Englewood: | 92.5% |
| State average: | 87.0% |
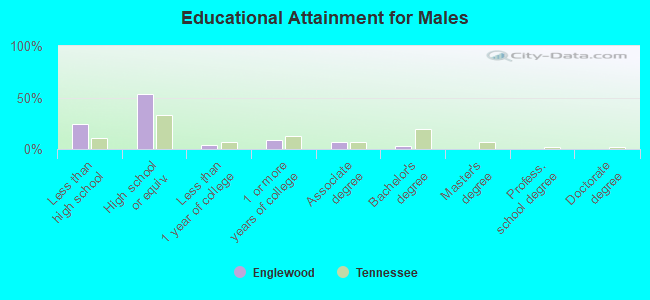
Education attainment for males 25 years and older:
- No schooling: 8
- Nursery to 4th grade: 0
- 5th and 6th grade: 0
- 7th and 8th grade: 12
- 9th grade: 9
- 10th grade: 12
- 11th grade: 26
- 12th grade, no diploma: 36
- High school graduate (or equivalency): 232
- Less than 1 year of college: 17
- Some college more than 1 year, no degree: 38
- Associate degree: 28
- Bachelor's degree: 13
- Master's degree: 0
- Professional school degree: 2
- Doctorate degree: 0
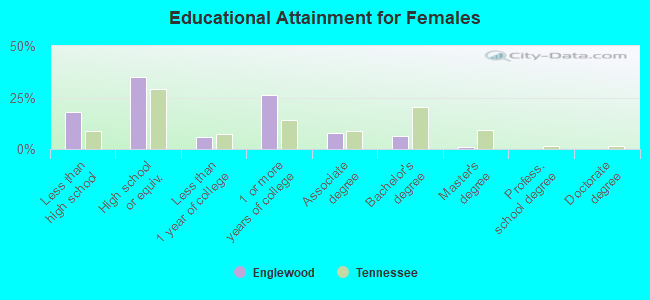
Education attainment for females 25 years and older:
- No schooling: 16
- Nursery to 4th grade: 14
- 5th and 6th grade: 16
- 7th and 8th grade: 17
- 9th grade: 6
- 10th grade: 23
- 11th grade: 19
- 12th grade, no diploma: 3
- High school graduate (or equivalency): 221
- Less than 1 year of college: 36
- Some college more than 1 year, no degree: 164
- Associate degree: 50
- Bachelor's degree: 39
- Master's degree: 5
- Professional school degree: 0
- Doctorate degree: 0


Housing units in structures:
- One, detached: 542
- Two: 46
- 3 or 4: 15
- 5 to 9: 35
- 10 to 19: 4
- 20 to 49: 7
- Mobile homes: 151
Median worth of mobile homes: $83,025
Housing units lacking complete kitchen facilities in 2022: 2.6%
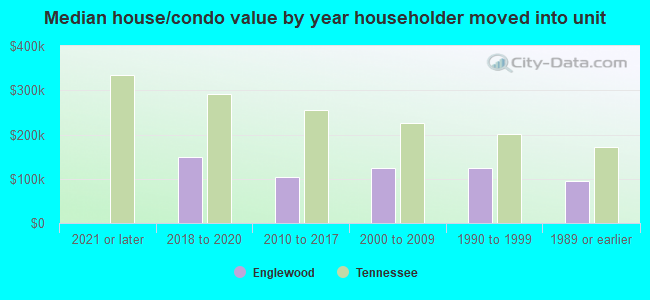
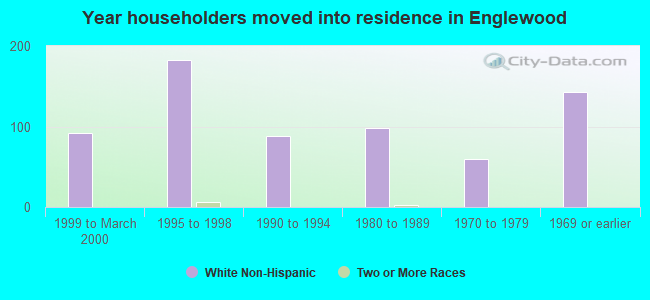
House/condo owner moved in on average 15 years ago
Renter moved in on average 6 years ago
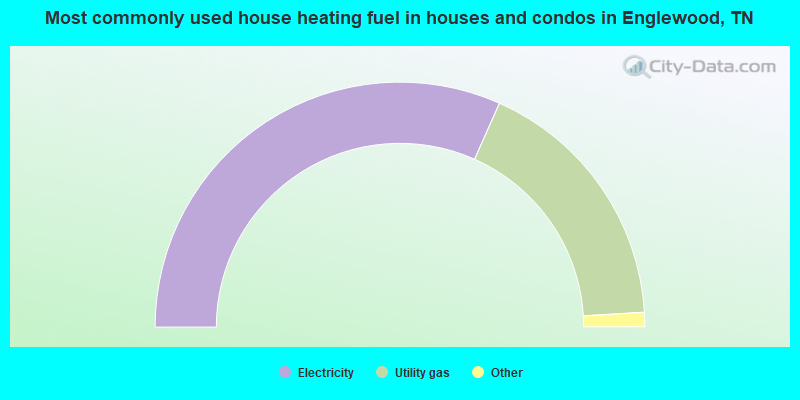
- 63.4%Electricity
- 34.8%Utility gas
- 1.1%Bottled, tank, or LP gas
- 0.7%Wood
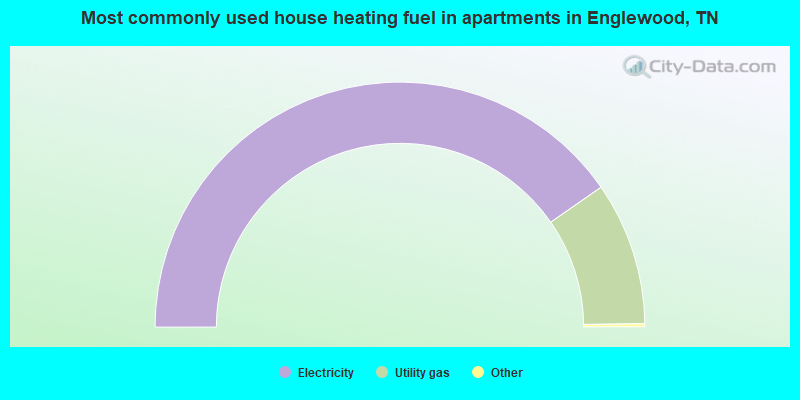
- 81.0%Electricity
- 19.0%Utility gas
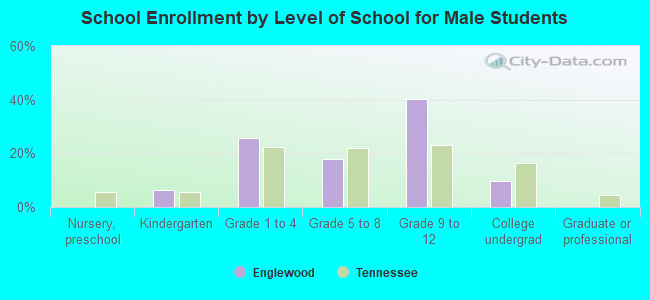
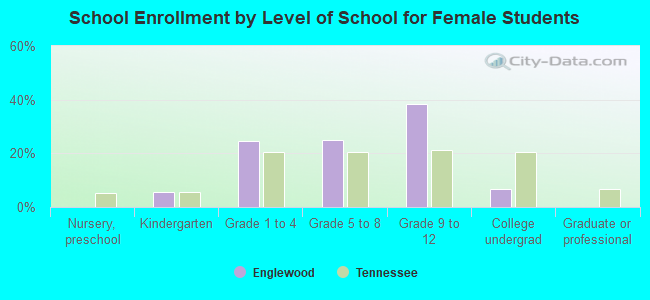
Private vs. public school enrollment:
| Here: | 3.6% |
| Tennessee: | 15.0% |
| Here: | 0.0% |
| Tennessee: | 16.2% |
| Here: | 0.0% |
| Tennessee: | 23.5% |