Estero, FL (Florida) Houses and Residents
Estimated median house or condo value in 2022: $487,374 (it was $118,900 in 2000 )
Estero:
$487,374Florida:
$354,100
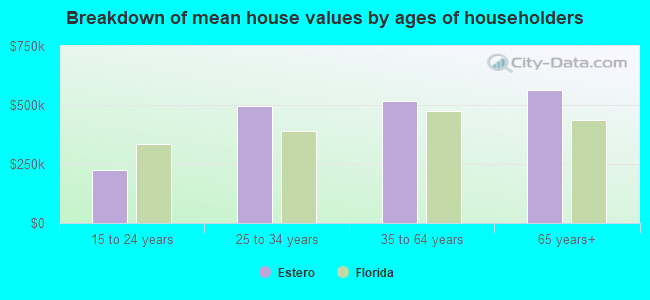
Lower value quartile - upper value quartile: $347,281 - $722,593Mean price in 2022: Detached houses: $688,013 Here:
$688,013State:
$500,941
Townhouses or other attached units: $424,093 Here:
$424,093State:
$370,869
In 2-unit structures: $378,236 Here:
$378,236State:
$423,188
In 3-to-4-unit structures: $454,101 Here:
$454,101State:
$309,944
In 5-or-more-unit structures: $413,091 Here:
$413,091State:
$447,145
Mobile homes: $143,813 Here:
$143,813State:
$113,202
Occupied boats, RVs, vans, etc.: $193,384 Here:
$193,384State:
$73,933
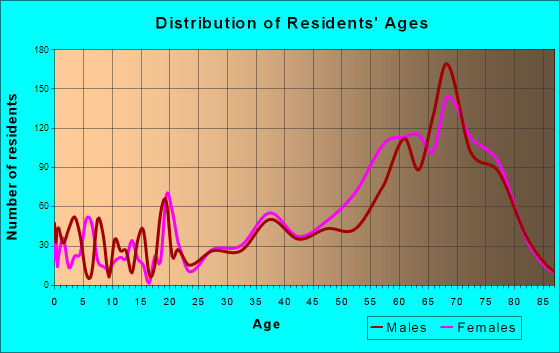
Total population: 22,612 (Urban population: 8,181, Rural population: 1,360 (all nonfarm) )
Houses: 27,521 (18,687 occupied: 16,122 owner occupied, 3,219 renter occupied )
% of renters here:
17%State:
33%
Housing density: 1,305 houses/condos per square mile
Median price asked for vacant for-sale houses and condos in 2022: $281,563.
Median contract rent in 2022: $1,996 (lower quartile is $1,523, upper quartile is over $2,000)
Median rent asked for vacant for-rent units in 2022: $2,427
Median gross rent in Estero, FL in 2022: over $2,000
Housing units in Estero with a mortgage: 6,918 (522 second mortgage, 77 home equity loan, 419 both second mortgage and home equity loan )Houses without a mortgage: 296
Median household income for houses/condos with a mortgage: $118,937
Median household income for apartments without a mortgage: $88,189
Median monthly housing costs: $1,504
Data:
Median house or condo value ($)
Median house or condo value ($ change since 2000)
Median house or condo value ($) - White
Median house or condo value ($) - Black or African American
Median house or condo value ($) - Asian
Median house or condo value ($) - Hispanic or Latino
Median house or condo value ($) - American Indian and Alaska Native
Median house or condo value ($) - Multirace
Median house or condo value ($) - Other Race
Median price asked for mobile homes ($)
Household density (households per square mile)
Mean house or condo value by units in structure - 1, detached ($)
Mean house or condo value by units in structure - 1, attached ($)
Mean house or condo value by units in structure - 2 ($)
Mean house or condo value by units in structure by units in structure - 3 or 4 ($)
Mean house or condo value by units in structure - 5 or more ($)
Mean house or condo value by units in structure - Boat, RV, van, etc. ($)
Mean house or condo value by units in structure - Mobile home ($)
Median contract rent ($)
Median contract rent - Lower quartile ($)
Median contract rent - Upper quartile ($)
Median gross rent ($)
Urban houses (%)
Rural houses (%)
Houses occupied (%)
Houses occupied (% change since 2000)
Houses owner occupied (%)
Houses owner occupied (% change since 2000)
Houses renter occupied (%)
Houses renter occupied (% change since 2000)
Vacant housing units - For rent (%)
Vacant housing units - For rent (% change since 2000)
Vacant housing units - For sale only (%)
Vacant housing units - For sale only (% change since 2000)
Vacant housing units - Rented or sold, not occupied (%)
Vacant housing units - Rented or sold, not occupied (% change since 2000)
Vacant housing units - For seasonal, recreational, or occasional use (%)
Vacant housing units - For seasonal, recreational, or occasional use (% change since 2000)
Vacant housing units - For migrant workers (%)
Vacant housing units - For migrant workers (% change since 2000)
Vacant housing units - Other vacant (%)
Vacant housing units - Other vacant (% change since 2000)
Median monthly housing costs ($)
Median household income for houses/condos with a mortgage ($)
Median household income for houses/condos without a mortgage ($)
Median household income ($)
Median household income ($) - White
Median household income ($) - Black or African American
Median household income ($) - Asian
Median household income ($) - Hispanic or Latino
Median household income ($) - American Indian and Alaska Native
Median household income ($) - Multirace
Median household income ($) - Other Race
Mortgage status - with mortgage (%)
Mortgage status - with second mortgage (%)
Mortgage status - with home equity loan (%)
Mortgage status - with both second mortgage and home equity loan (%)
Mortgage status - without a mortgage (%)
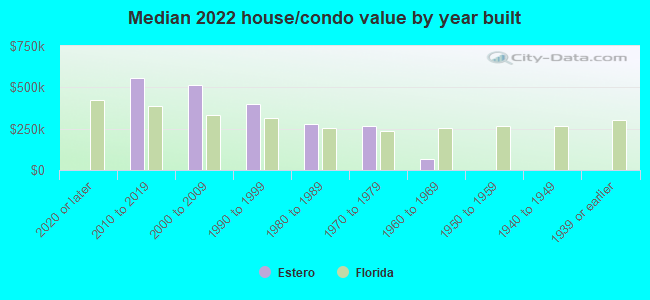
Median year house/condo built
Median year apartment built
Household type by relationship - Male householder living alone (%)
Household type by relationship - Male householder not living alone (%)
Household type by relationship - Female householder living alone (%)
Household type by relationship - Female householder not living alone (%)
Household type by relationship - Opposite-Sex spouse (%)
Household type by relationship - Same-Sex spouse (%)
Household type by relationship - Opposite-Sex unmarried partner (%)
Household type by relationship - Same-Sex unmarried partner (%)
Household type by relationship - In group quarters (%)
Size of family households - 2-person household (%)
Size of family households - 3-person household (%)
Size of family households - 4-person household (%)
Size of family households - 5-person household (%)
Size of family households - 6-person household (%)
Size of family households - 7-or-more-person household (%)
Size of nonfamily households - 1-person household (%)
Size of nonfamily households - 2-person household (%)
Size of nonfamily households - 3-person household (%)
Size of nonfamily households - 4-person household (%)
Size of nonfamily households - 5-person household (%)
Size of nonfamily households - 6-person household (%)
Size of nonfamily households - 7-or-moreperson household (%)
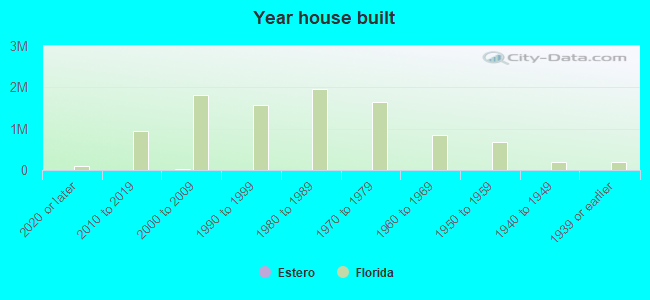
Year house built - Built 2010 or later (%)
Year house built - Built 2000 to 2009 (%)
Year house built - Built 1990 to 1999 (%)
Year house built - Built 1980 to 1989 (%)
Year house built - Built 1970 to 1979 (%)
Year house built - Built 1960 to 1969 (%)
Year house built - Built 1950 to 1959 (%)
Year house built - Built 1940 to 1949 (%)
Year house built - Built 1939 or earlier (%)
Median number of rooms in houses and condos
Median number of rooms in apartments
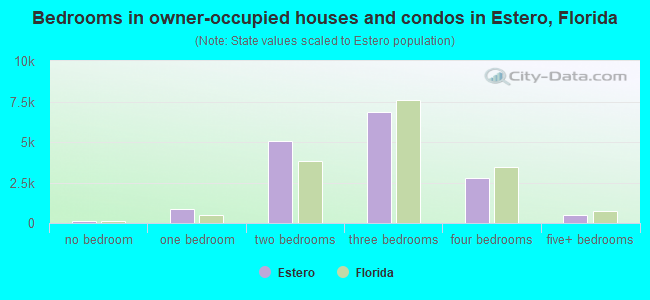
Median number of bedrooms in owner occupied houses
Mean number of bedrooms in owner occupied houses
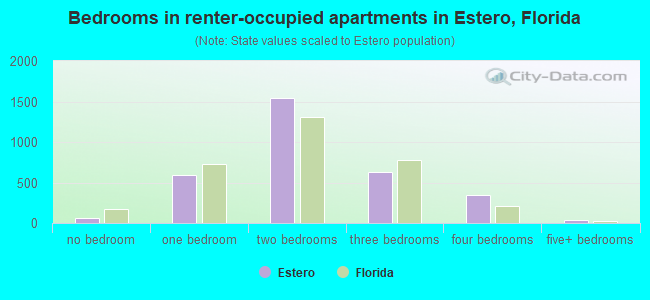
Median number of bedrooms in renter occupied houses
Mean number of bedrooms in renter occupied houses
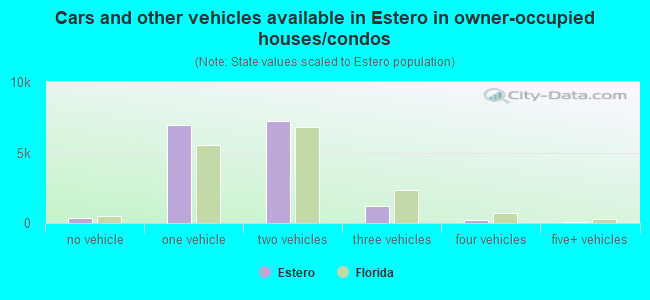
Median number of vehichles in owner occupied houses
Mean number of vehichles in owner occupied houses
Median number of vehichles in renter occupied houses
Mean number of vehichles in renter occupied houses
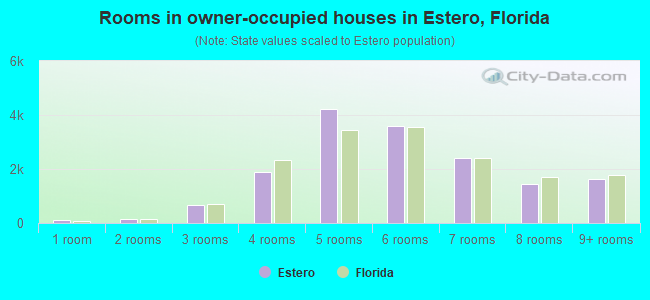
Rooms in owner-occupied houses - 1 room (%)
Rooms in owner-occupied houses - 2 rooms (%)
Rooms in owner-occupied houses - 3 rooms (%)
Rooms in owner-occupied houses - 4 rooms (%)
Rooms in owner-occupied houses - 5 rooms (%)
Rooms in owner-occupied houses - 6 rooms (%)
Rooms in owner-occupied houses - 7 rooms (%)
Rooms in owner-occupied houses - 8 rooms (%)
Rooms in owner-occupied houses - 9+ rooms (%)
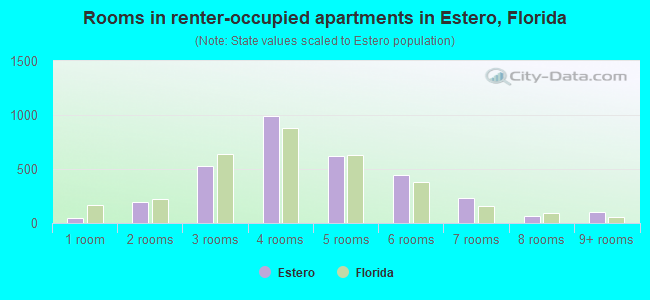
Rooms in renter-occupied houses - 1 room (%)
Rooms in renter-occupied houses - 2 rooms (%)
Rooms in renter-occupied houses - 3 rooms (%)
Rooms in renter-occupied houses - 4 rooms (%)
Rooms in renter-occupied houses - 5 rooms (%)
Rooms in renter-occupied houses - 6 rooms (%)
Rooms in renter-occupied houses - 7 rooms (%)
Rooms in renter-occupied houses - 8 rooms (%)
Rooms in renter-occupied houses - 9+ rooms (%)
Bedrooms in owner-occupied houses - no bedrooms (%)
Bedrooms in owner-occupied houses - 1 bedroom (%)
Bedrooms in owner-occupied houses - 2 bedrooms (%)
Bedrooms in owner-occupied houses - 3 bedrooms (%)
Bedrooms in owner-occupied houses - 4 bedrooms (%)
Bedrooms in owner-occupied houses - 5+ bedrooms (%)
Bedrooms in renter-occupied houses - no bedrooms (%)
Bedrooms in renter-occupied houses - 1 bedroom (%)
Bedrooms in renter-occupied houses - 2 bedrooms (%)
Bedrooms in renter-occupied houses - 3 bedrooms (%)
Bedrooms in renter-occupied houses - 4 bedrooms (%)
Bedrooms in renter-occupied houses - 5+ bedrooms (%)
Vehicles available in owner-occupied houses - no vehicle available (%)
Vehicles available in owner-occupied houses - 1 vehicle available(%)
Vehicles available in owner-occupied houses - 2 Vehicles available (%)
Vehicles available in owner-occupied houses - 3 Vehicles available (%)
Vehicles available in owner-occupied houses - 4 Vehicles available (%)
Vehicles available in owner-occupied houses - 5+ Vehicles available (%)
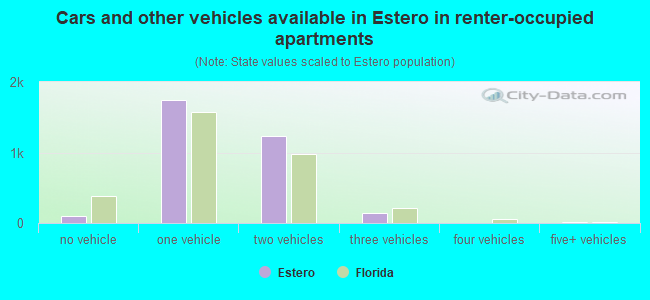
Vehicles available in renter-occupied houses - no vehicle available (%)
Vehicles available in renter-occupied houses - 1 vehicle available (%)
Vehicles available in renter-occupied houses - 2 Vehicles available (%)
Vehicles available in renter-occupied houses - 3 Vehicles available (%)
Vehicles available in renter-occupied houses - 4 Vehicles available (%)
Vehicles available in renter-occupied houses - 5+ Vehicles available (%)
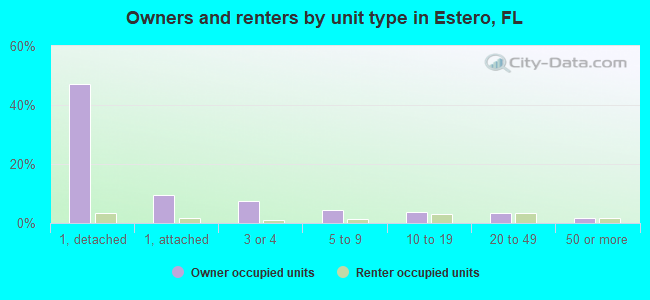
Housing units in structures - 1, detached (%)
Housing units in structures - 1, attached (%)
Housing units in structures - 2 (%)
Housing units in structures - 3 or 4 (%)
Housing units in structures - 5 to 9 (%)
Housing units in structures - 10 to 19 (%)
Housing units in structures - 20 to 49 (%)
Housing units in structures - 50 or more (%)
Housing units in structures - Mobile home (%)
Housing units in structures - Boat, RV, van, etc. (%)
Housing units in structures - Owners - 1, detached (%)
Housing units in structures - Owners - 1, attached (%)
Housing units in structures - Owners - 2 (%)
Housing units in structures - Owners - 3 or 4 (%)
Housing units in structures - Owners - 5 to 9 (%)
Housing units in structures - Owners - 10 to 19 (%)
Housing units in structures - Owners - 20 to 49 (%)
Housing units in structures - Owners - 50 or more (%)
Housing units in structures - Owners - Mobile home (%)
Housing units in structures - Owners - Boat, RV, van, etc. (%)
Housing units in structures - Renters - 1, detached (%)
Housing units in structures - Renters - 1, attached (%)
Housing units in structures - Renters - 2 (%)
Housing units in structures - Renters - 3 or 4 (%)
Housing units in structures - Renters - 5 to 9 (%)
Housing units in structures - Renters - 10 to 19 (%)
Housing units in structures - Renters - 20 to 49 (%)
Housing units in structures - Renters - 50 or more (%)
Housing units in structures - Renters - Mobile home (%)
Housing units in structures - Renters - Boat, RV, van, etc. (%)
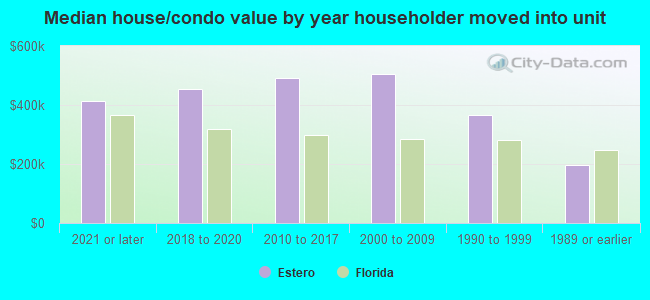
House/condo owner moved in on average (years ago)
Renter moved in on average (years ago)
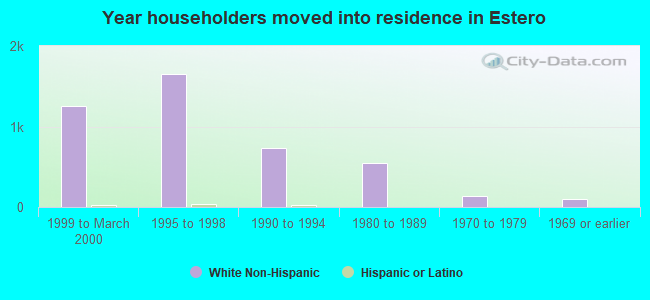
Year householder moved into unit - Moved in 1999 to March 2000 (%)
Year householder moved into unit - Moved in 1999 to March 2000 (%) - White
Year householder moved into unit - Moved in 1999 to March 2000 (%) - Black or African American
Year householder moved into unit - Moved in 1999 to March 2000 (%) - Asian
Year householder moved into unit - Moved in 1999 to March 2000 (%) - Hispanic or Latino
Year householder moved into unit - Moved in 1999 to March 2000 (%) - American Indian and Alaska Native
Year householder moved into unit - Moved in 1999 to March 2000 (%) - Multirace
Year householder moved into unit - Moved in 1999 to March 2000 (%) - Other Race
Year householder moved into unit - Moved in 1995 to 1998 (%)
Year householder moved into unit - Moved in 1995 to 1998 (%) - White
Year householder moved into unit - Moved in 1995 to 1998 (%) - Black or African American
Year householder moved into unit - Moved in 1995 to 1998 (%) - Asian
Year householder moved into unit - Moved in 1995 to 1998 (%) - Hispanic or Latino
Year householder moved into unit - Moved in 1995 to 1998 (%) - American Indian and Alaska Native
Year householder moved into unit - Moved in 1995 to 1998 (%) - Multirace
Year householder moved into unit - Moved in 1995 to 1998 (%) - Other Race
Year householder moved into unit - Moved in 1990 to 1994 (%)
Year householder moved into unit - Moved in 1990 to 1994 (%) - White
Year householder moved into unit - Moved in 1990 to 1994 (%) - Black or African American
Year householder moved into unit - Moved in 1990 to 1994 (%) - Asian
Year householder moved into unit - Moved in 1990 to 1994 (%) - Hispanic or Latino
Year householder moved into unit - Moved in 1990 to 1994 (%) - American Indian and Alaska Native
Year householder moved into unit - Moved in 1990 to 1994 (%) - Multirace
Year householder moved into unit - Moved in 1990 to 1994 (%) - Other Race
Year householder moved into unit - Moved in 1980 to 1989 (%)
Year householder moved into unit - Moved in 1980 to 1989 (%) - White
Year householder moved into unit - Moved in 1980 to 1989 (%) - Black or African American
Year householder moved into unit - Moved in 1980 to 1989 (%) - Asian
Year householder moved into unit - Moved in 1980 to 1989 (%) - Hispanic or Latino
Year householder moved into unit - Moved in 1980 to 1989 (%) - American Indian and Alaska Native
Year householder moved into unit - Moved in 1980 to 1989 (%) - Multirace
Year householder moved into unit - Moved in 1980 to 1989 (%) - Other Race
Year householder moved into unit - Moved in 1970 to 1979 (%)
Year householder moved into unit - Moved in 1970 to 1979 (%) - White
Year householder moved into unit - Moved in 1970 to 1979 (%) - Black or African American
Year householder moved into unit - Moved in 1970 to 1979 (%) - Asian
Year householder moved into unit - Moved in 1970 to 1979 (%) - Hispanic or Latino
Year householder moved into unit - Moved in 1970 to 1979 (%) - American Indian and Alaska Native
Year householder moved into unit - Moved in 1970 to 1979 (%) - Multirace
Year householder moved into unit - Moved in 1970 to 1979 (%) - Other Race
Year householder moved into unit - Moved in 1969 or earlier (%)
Year householder moved into unit - Moved in 1969 or earlier (%) - White
Year householder moved into unit - Moved in 1969 or earlier (%) - Black or African American
Year householder moved into unit - Moved in 1969 or earlier (%) - Asian
Year householder moved into unit - Moved in 1969 or earlier (%) - Hispanic or Latino
Year householder moved into unit - Moved in 1969 or earlier (%) - American Indian and Alaska Native
Year householder moved into unit - Moved in 1969 or earlier (%) - Multirace
Year householder moved into unit - Moved in 1969 or earlier (%) - Other Race
Housing units lacking complete plumbing facilities (%)
Housing units lacking complete kitchen facilities (%)
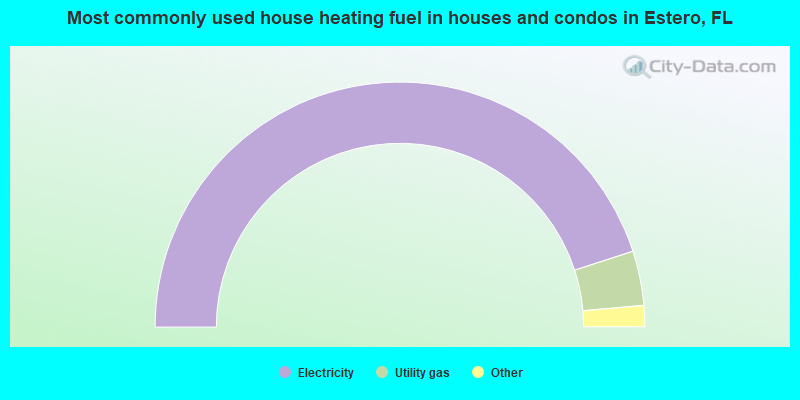
House heating fuel used in houses and condos - Utility gas (%)
House heating fuel used in houses and condos - Bottled, tank, or LP gas (%)
House heating fuel used in houses and condos - Electricity (%)
House heating fuel used in houses and condos - Fuel oil, kerosene, etc. (%)
House heating fuel used in houses and condos - Coal or coke (%)
House heating fuel used in houses and condos - Wood (%)
House heating fuel used in houses and condos - Solar energy (%)
House heating fuel used in houses and condos - Other fuel (%)
House heating fuel used in houses and condos - No fuel used (%)
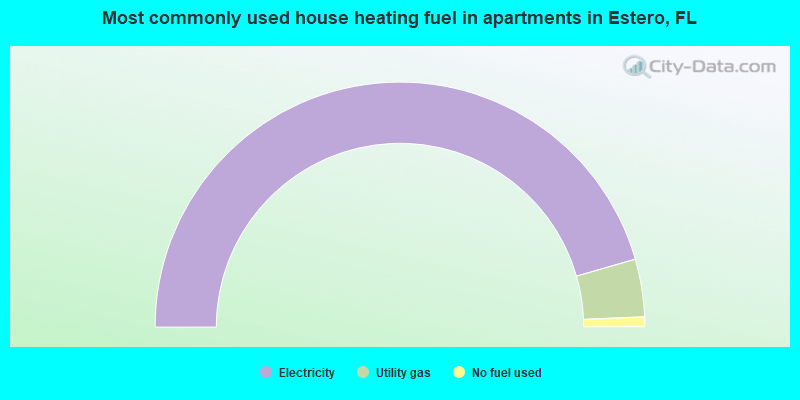
House heating fuel used in apartments - Utility gas (%)
House heating fuel used in apartments - Bottled, tank, or LP gas (%)
House heating fuel used in apartments - Electricity (%)
House heating fuel used in apartments - Fuel oil, kerosene, etc. (%)
House heating fuel used in apartments - Coal or coke (%)
House heating fuel used in apartments - Wood (%)
House heating fuel used in apartments - Solar energy (%)
House heating fuel used in apartments - Other fuel (%)
House heating fuel used in apartments - No fuel used (%)
Latest news about housing in Estero, FL collected exclusively by city-data.com from local newspapers, TV, and radio stations
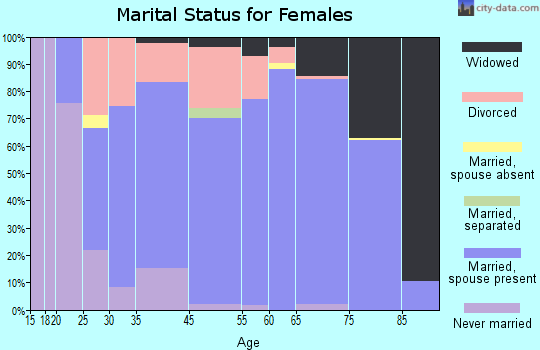
Median year house/condo built: 2004Median year apartment built: 2007Household type by relationship:
Households: 39,036
Male householders: 10,670 (1,884 living alone ), Female householders: 8,218 (3,021 living alone )11,404 spouses (11,235 opposite-sex spouses ), 1,355 unmarried partners , (1,342 opposite-sex unmarried partners ), 5,350 children (4,941 natural , 114 adopted , 293 stepchildren ), 332 grandchildren , 222 brothers or sisters , 537 parents , 24 foster children , 202 other relatives , 676 non-relatives In group quarters: 42
Size of family households: 10,590 2-persons , 1,302 3-persons , 796 4-persons , 387 5-persons , 65 6-persons , 35 7-or-more-persons .
Size of nonfamily households: 4,767 1-person , 1,522 2-persons , 19 4-persons .
2,681 married couples with children. single-parent households (334 men , 576 women ).
89.4% of residents of Estero speak English at home. of residents speak Spanish at home (75% speak English very well , 13% speak English well , 7% speak English not well , 5% don't speak English at all ).of residents speak other Indo-European language at home (66% speak English very well , 22% speak English well , 7% speak English not well , 5% don't speak English at all ).of residents speak Asian or Pacific Island language at home (51% speak English very well , 27% speak English well , 10% speak English not well , 12% don't speak English at all ).of residents speak other language at home (73% speak English very well , 5% speak English well , 22% speak English not well ).
Foreign born population: 4,600 (11.8%)of them are naturalized citizens )
Median number of rooms in houses and condos:
Median number of rooms in apartments
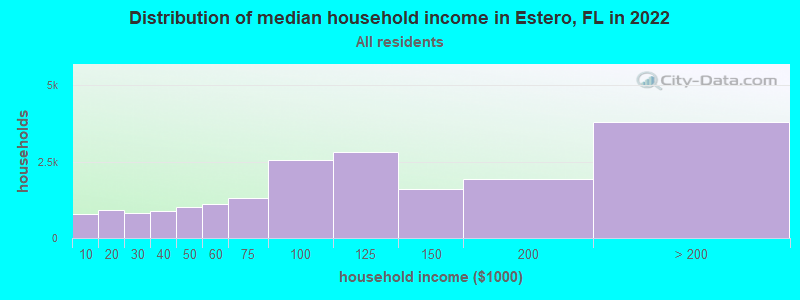
Estero, FL household income distribution 792 Less than $10,000925 $10,000 to $19,999815 $20,000 to $29,999879 $30,000 to $39,9991,009 $40,000 to $49,9991,122 $50,000 to $59,9991,319 $60,000 to $74,9992,571 $75,000 to $99,9992,801 $100,000 to $124,9991,592 $125,000 to $149,9991,928 $150,000 to $199,9993,800 $200,000 or more
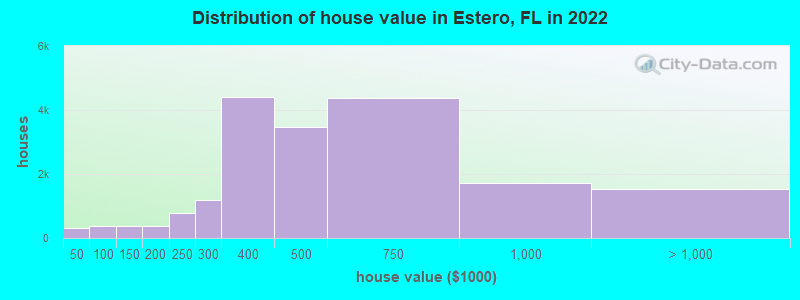
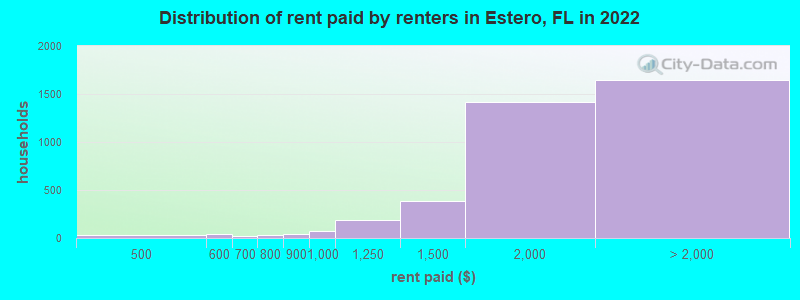
Home value of owner - occupied houses in 2022 in Estero, FL 157 Less than $10,00011 $10,000 to $14,9999 $15,000 to $19,99938 $20,000 to $24,99951 $25,000 to $29,99939 $30,000 to $34,99912 $40,000 to $49,99987 $50,000 to $59,99926 $60,000 to $69,99983 $70,000 to $79,999119 $80,000 to $89,99957 $90,000 to $99,999288 $100,000 to $124,99999 $125,000 to $149,999187 $150,000 to $174,999201 $175,000 to $199,999767 $200,000 to $249,9991,172 $250,000 to $299,9994,391 $300,000 to $399,9993,456 $400,000 to $499,9994,365 $500,000 to $749,9991,730 $750,000 to $999,9991,059 $1,000,000 to $1,499,999265 $1,500,000 to $1,999,999212 $2,000,000 or moreRent paid by renters in 2022 in Estero, FL 26 $400 to $44933 $500 to $5494 $550 to $59920 $600 to $6495 $700 to $74926 $750 to $79944 $800 to $89970 $900 to $999185 $1,000 to $1,249389 $1,250 to $1,4991,416 $1,500 to $1,999895 $2,000 to $2,499386 $2,500 to $2,99968 $3,000 to $3,499222 $3,500 or more68 No cash rent
Percentage of workers working in this county: 76.8%Number of people working at home: 3,329 (23.9% of all workers )
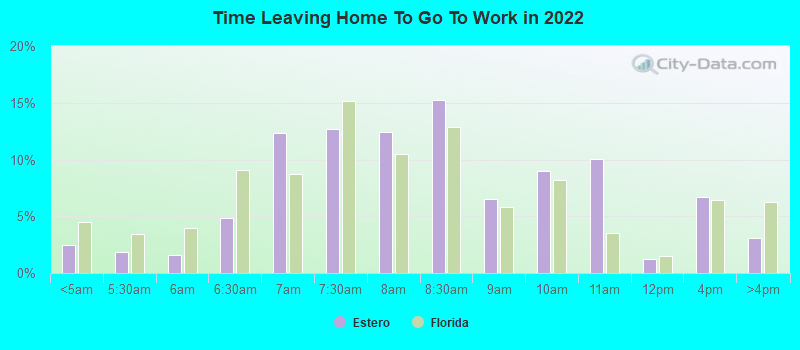
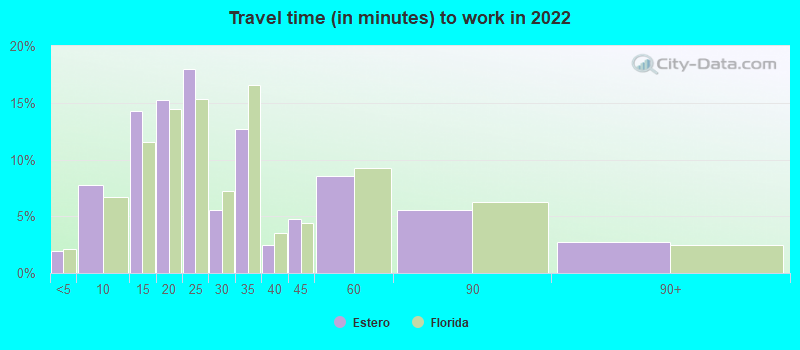
Travel time to work (commute)
Less than 5 minutes: 2505 to 9 minutes: 68610 to 14 minutes: 1,10615 to 19 minutes: 1,65420 to 24 minutes: 2,22025 to 29 minutes: 60730 to 34 minutes: 1,80935 to 39 minutes: 82640 to 44 minutes: 61145 to 59 minutes: 51460 to 89 minutes: 22990 or more minutes: 360
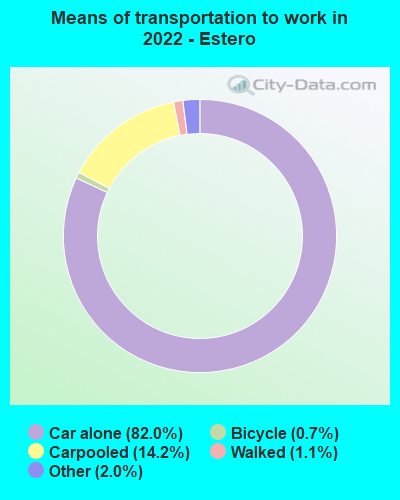
Means of transportation to work:
Drove a car alone: 10,712 (65.2%)Carpooled: 2,268 (13.8%)Taxi: 178 (1.1%)Bicycle: 54 (0.3%)Walked: 157 (1.0%)Worked at home: 3,329 (20.3%)
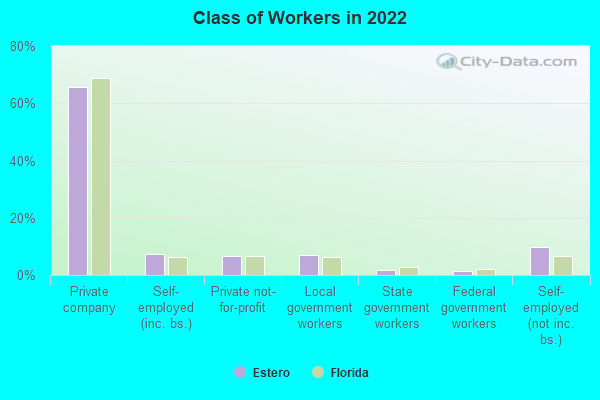
Unemployment by race in 2022
Unemployment rate for White non-Hispanic residents 3.5% Males1.8% FemalesUnemployment rate for Black residents 22.6% MalesUnemployment rate for two or more race residents 4.0% MalesUnemployment rate for Hispanic or Latino residents 3.6% Males2.2% Females
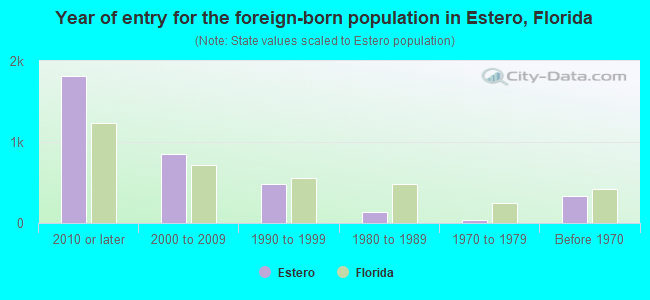
Year of entry for the foreign-born population in Estero, Florida
1,815 2010 or later 858 2000 to 2009 476 1990 to 1999 131 1980 to 1989 37 1970 to 1979 328 Before 1970
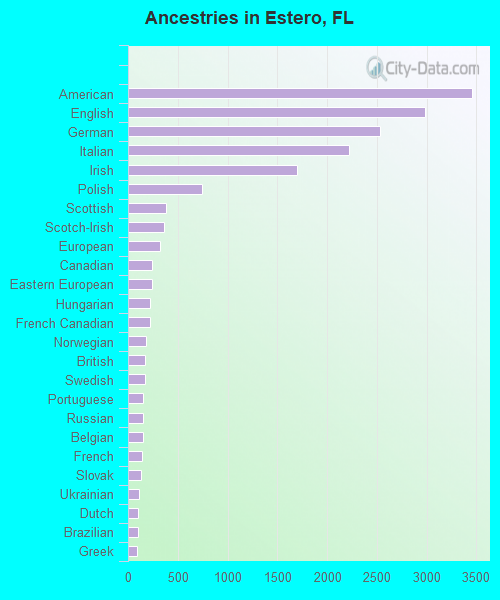
First ancestries reported:
American: 3,453 (16.5%)
English: 2,983 (14.2%)
German: 2,528 (12.1%)
Italian: 2,224 (10.6%)
Irish: 1,697 (8.1%)
Polish: 743 (3.5%)
Scottish: 386 (1.8%)
Scotch-Irish: 358 (1.7%)
European: 326 (1.6%)
Canadian: 243 (1.2%)
Eastern European: 241 (1.1%)
Hungarian: 224 (1.1%)
French Canadian: 224 (1.1%)
Norwegian: 184 (0.9%)
British: 175 (0.8%)
Swedish: 173 (0.8%)
Portuguese: 149 (0.7%)
Russian: 147 (0.7%)
Belgian: 146 (0.7%)
French: 144 (0.7%)
Slovak: 133 (0.6%)
Ukrainian: 107 (0.5%)
Dutch: 104 (0.5%)
Brazilian: 99 (0.5%)
Greek: 87 (0.4%)
Finnish: 65 (0.3%)
Welsh: 63 (0.3%)
Croatian: 59 (0.3%)
Albanian: 58 (0.3%)
Austrian: 53 (0.3%)
Scandinavian: 49 (0.2%)
Celtic: 49 (0.2%)
Turkish: 47 (0.2%)
Egyptian: 41 (0.2%)
Macedonian: 38 (0.2%)
Australian: 37 (0.2%)
Iranian: 37 (0.2%)
Czechoslovakian: 34 (0.2%)
Czech: 29 (0.1%)
South African: 23 (0.1%)
Armenian: 20 (0.10%)
Slovene: 16 (0.08%)
Jamaican: 15 (0.07%)
Lithuanian: 11 (0.05%)
Belizean: 10 (0.05%)
Danish: 9 (0.04%)
Yugoslavian: 9 (0.04%)
Lebanese: 6 (0.03%)
Romanian: 6 (0.03%)
Jordanian: 6 (0.03%)
Icelander: 6 (0.03%)
Estonian: 6 (0.03%)
Latvian: 4 (0.02%)
Most common places of birth for foreign-born residents (%): Canada Estero:
23.1% (967)Florida:
2.4% (109,132)
China, excluding Hong Kong and Taiwan Estero:
9.4% (393)Florida:
1.2% (56,071)
Germany Estero:
6.4% (269)Florida:
1.2% (54,272)
Mexico Estero:
5.0% (211)Florida:
5.6% (257,152)
Cuba Estero:
4.8% (201)Florida:
22.0% (1,006,576)
Brazil Estero:
4.4% (184)Florida:
2.7% (122,906)
Philippines Estero:
3.5% (146)Florida:
1.8% (84,403)
Colombia Estero:
2.9% (122)Florida:
6.5% (298,669)
Trinidad and Tobago Estero:
2.8% (117)Florida:
1.0% (43,642)
India Estero:
2.6% (107)Florida:
2.1% (94,349)
England Estero:
2.4% (101)Florida:
0.8% (37,723)
United Kingdom, excluding England and Scotland Estero:
2.4% (99)Florida:
0.7% (34,227)
Panama Estero:
1.9% (79)Florida:
0.5% (22,972)
Venezuela Estero:
1.9% (79)Florida:
5.7% (262,042)
Vietnam Estero:
1.7% (73)Florida:
1.3% (60,604)
South Africa Estero:
1.6% (67)Florida:
0.2% (11,243)
Place of birth for U.S.-born residents:
This state: 4,603Other state: 29,069Northeast: 11,705Midwest: 12,135South: 4,091West: 1,066 88.5% of Estero residents lived in the same house 1 years ago.
Out of people who lived in different houses, 23.2% lived in this county.
Out of people who lived in different counties, 21.6% lived in Florida.
Estero:
88.5%State average:
86.3%
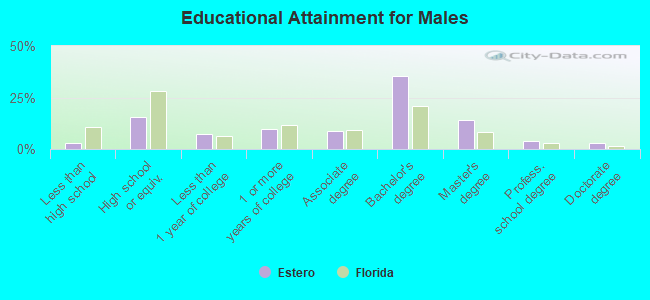
Education attainment for males 25 years and older:
No schooling: 55Nursery to 4th grade: 655th and 6th grade: 07th and 8th grade: 19th grade: 2610th grade: 6711th grade: 9112th grade, no diploma: 147High school graduate (or equivalency): 2,568Less than 1 year of college: 1,245Some college more than 1 year, no degree: 1,633Associate degree: 1,441Bachelor's degree: 5,890Master's degree: 2,366Professional school degree: 641Doctorate degree: 485
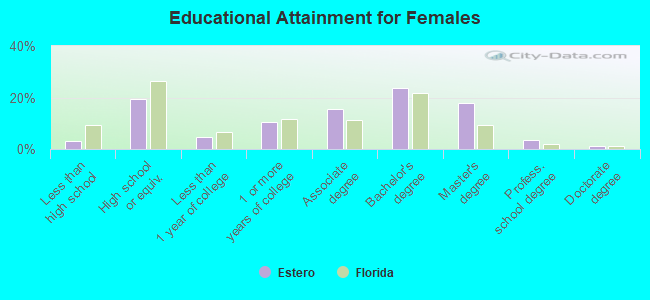
Education attainment for females 25 years and older:
No schooling: 35Nursery to 4th grade: 05th and 6th grade: 747th and 8th grade: 729th grade: 9210th grade: 811th grade: 4212th grade, no diploma: 247High school graduate (or equivalency): 3,503Less than 1 year of college: 824Some college more than 1 year, no degree: 1,897Associate degree: 2,797Bachelor's degree: 4,260Master's degree: 3,223Professional school degree: 603Doctorate degree: 208
Housing units in structures:
One, detached: 12,536One, attached: 3,053Two: 6203 or 4: 2,3515 to 9: 1,75210 to 19: 1,89920 to 49: 1,70450 or more: 853Mobile homes: 2,690Boats, RVs, vans, etc.: 58Median worth of mobile homes: $125,492
Housing units lacking complete plumbing facilities in 2022: 0.7%Housing units lacking complete kitchen facilities in 2022: 0.4%House/condo owner moved in on average 9 years ago
Renter moved in on average 3 years ago
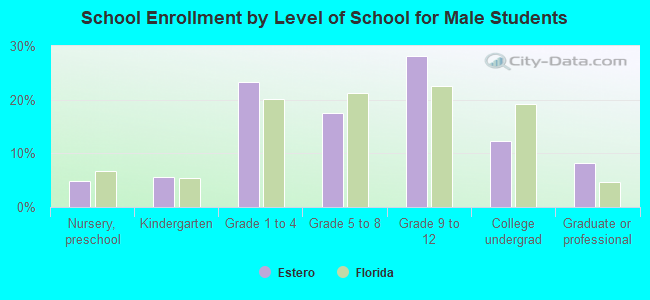
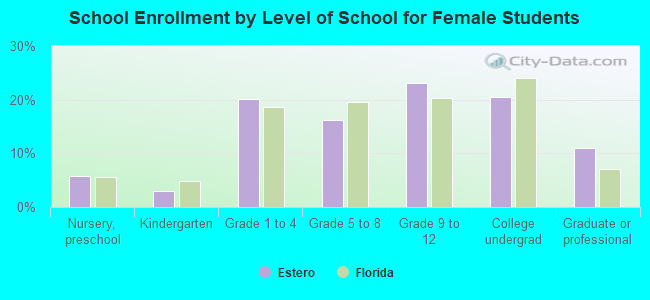
Private vs. public school enrollment:
Students in private schools in grades 1 to 8 (elementary and middle school): 338 Students in private schools in grades 9 to 12 (high school): 73 Students in private undergraduate colleges: 108