Eureka, CA (California) Houses and Residents
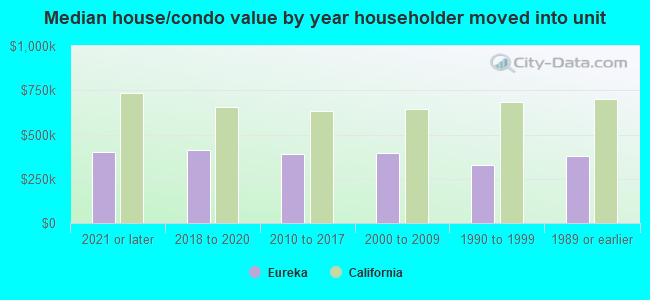
| Eureka: | $388,219 |
| California: | $715,900 |
Total population: 26,925 (Urban population: 25,929 (all inside urban clusters), Rural population: 0)
Houses: 12,089 (10,993 occupied: 5,515 owner occupied, 5,847 renter occupied)
| % of renters here: | 51% |
| State: | 44% |
Housing density: 1,279 houses/condos per square mile
Median price asked for vacant for-sale houses and condos in 2022: $978,961.
Median contract rent in 2022: $942 (lower quartile is $757, upper quartile is $1,206)
Median rent asked for vacant for-rent units in 2022: $730
Median gross rent in Eureka, CA in 2022: $1,063
Housing units in Eureka with a mortgage: 3,292 (469 second mortgage, 0 home equity loan, 322 both second mortgage and home equity loan)
Houses without a mortgage: 21
Median household income for houses/condos with a mortgage: $84,488
Median household income for apartments without a mortgage: $48,595
Median monthly housing costs: $1,076
Compare current foreclosures near Eureka, CA:
| Photo | Address | Area | Beds / Baths | Price | Details |
|---|---|---|---|---|---|

|
#1
Russ St
Eureka, CA 95501
|
1,297 sq. feet
|
2 baths 3 beds |
$353,000
|
show details |

|
#2
Myrtle Ave
Eureka, CA 95501
|
2,817 sq. feet
|
3 baths 4 beds |
show details | |

|
#3
Lincoln St
Eureka, CA 95501
|
875 sq. feet
|
1 baths 3 beds |
show details | |

|
#4
Union St
Eureka, CA 95503
|
- sq. feet
|
2 baths 3 beds |
show details | |

|
#5
Little Fairfield St
Eureka, CA 95503
|
- sq. feet
|
2 baths 3 beds |
show details | |

|
#6
Golden West Ct Apt C
Eureka, CA 95503
|
- sq. feet
|
- baths - beds |
show details | |

|
#7
Dean St Apt 11
Eureka, CA 95501
|
- sq. feet
|
- baths - beds |
show details | |

|
#8
8th St # 128
Eureka, CA 95501
|
- sq. feet
|
- baths - beds |
show details | |

|
#9
Beechwood Dr
Eureka, CA 95503
|
- sq. feet
|
- baths - beds |
show details | |

|
#10
California St
Eureka, CA 95501
|
- sq. feet
|
- baths - beds |
show details |
| Photo | Address | Area | Beds / Baths | Price | Details |
|---|---|---|---|---|---|

|
#11
Highland Ave
Eureka, CA 95503
|
- sq. feet
|
- baths - beds |
show details | |

|
#12
Lincoln St
Eureka, CA 95501
|
- sq. feet
|
- baths - beds |
show details | |

|
#13
J St
Eureka, CA 95501
|
- sq. feet
|
- baths - beds |
show details | |

|
#14
16th St
Eureka, CA 95501
|
- sq. feet
|
- baths - beds |
show details | |

|
#15
C St
Eureka, CA 95501
|
- sq. feet
|
- baths - beds |
show details | |

|
#16
H St
Eureka, CA 95501
|
- sq. feet
|
- baths - beds |
show details | |

|
#17
Mcfarlan St
Eureka, CA 95501
|
- sq. feet
|
- baths - beds |
show details | |

|
#18
D St
Eureka, CA 95503
|
- sq. feet
|
- baths - beds |
show details | |

|
#19
Myrtle Ave
Eureka, CA 95503
|
- sq. feet
|
- baths - beds |
show details | |

|
#20
Hodgson St
Eureka, CA 95503
|
- sq. feet
|
- baths - beds |
show details |
| Photo | Address | Area | Beds / Baths | Price | Details |
|---|---|---|---|---|---|

|
#21
Northridge Rd
Eureka, CA 95503
|
- sq. feet
|
- baths - beds |
show details | |

|
#22
Myrtle Ave
Eureka, CA 95503
|
- sq. feet
|
- baths - beds |
show details | |

|
#23
15th St
Eureka, CA 95501
|
- sq. feet
|
- baths - beds |
show details | |

|
#24
Paradise Ln
Eureka, CA 95503
|
- sq. feet
|
- baths - beds |
show details | |

|
#25
Myrtle Ave Spc 22
Eureka, CA 95503
|
- sq. feet
|
- baths - beds |
show details | |

|
#26
Wrigley Rd
Eureka, CA 95503
|
- sq. feet
|
- baths - beds |
show details | |

|
#27
Cedar St
Eureka, CA 95503
|
- sq. feet
|
- baths - beds |
show details | |

|
#28
Mcfarlan St
Eureka, CA 95501
|
- sq. feet
|
- baths - beds |
show details | |

|
#29
Darin Dr
Arcata, CA 95521
|
720 sq. feet
|
1 baths 2 beds |
show details | |

|
#30
Tami Dr
Fortuna, CA 95540
|
1,254 sq. feet
|
2 baths 4 beds |
show details |
| Photo | Address | Area | Beds / Baths | Price | Details |
|---|---|---|---|---|---|

|
#31
Mckinleyville Ave
Mckinleyville, CA 95519
|
- sq. feet
|
2 baths 4 beds |
show details | |

|
#32
N St
Fortuna, CA 95540
|
- sq. feet
|
- baths - beds |
show details | |

|
#33
Riverwalk Dr # 1
Fortuna, CA 95540
|
- sq. feet
|
- baths - beds |
show details | |

|
#34
Crissy Way
Fortuna, CA 95540
|
- sq. feet
|
- baths - beds |
show details | |

|
#35
Shay Ct
Fortuna, CA 95540
|
- sq. feet
|
- baths - beds |
show details | |

|
#36
Stockton Ct Apt D
Fortuna, CA 95540
|
- sq. feet
|
- baths - beds |
show details | |

|
#37
Main St
Ferndale, CA 95536
|
- sq. feet
|
- baths - beds |
show details | |

|
#38
Larissa Cir
Mckinleyville, CA 95519
|
- sq. feet
|
- baths - beds |
show details | |

|
#39
Windy Rd
Mckinleyville, CA 95519
|
- sq. feet
|
- baths - beds |
show details | |

|
#40
Spear Ave
Arcata, CA 95521
|
- sq. feet
|
- baths - beds |
show details |
| Photo | Address | Area | Beds / Baths | Price | Details |
|---|---|---|---|---|---|

|
#41
18th St # D
Arcata, CA 95521
|
- sq. feet
|
- baths - beds |
show details | |

|
#42
Fieldbrook Rd
Mckinleyville, CA 95519
|
- sq. feet
|
- baths - beds |
show details | |

|
#43
10th St
Fortuna, CA 95540
|
- sq. feet
|
- baths - beds |
show details | |

|
#44
6th St
Fortuna, CA 95540
|
- sq. feet
|
- baths - beds |
show details | |

|
#45
Catherine Ct
Mckinleyville, CA 95519
|
- sq. feet
|
- baths - beds |
show details | |

|
#46
Columbus Ave
Mckinleyville, CA 95519
|
- sq. feet
|
- baths - beds |
show details | |

|
#47
Escarda Ct
Arcata, CA 95521
|
- sq. feet
|
- baths - beds |
show details | |

|
#48
Ronald Ave
Fortuna, CA 95540
|
- sq. feet
|
- baths - beds |
show details | |

|
#49
Main St
Ferndale, CA 95536
|
- sq. feet
|
- baths - beds |
show details | |

|
Check over 1 million property listings on Foreclosure.com!
|
browse all offers | |||

Latest news about housing in Eureka, CA collected exclusively by city-data.com from local newspapers, TV, and radio stations

 | Apartments in Eureka/Arcata (2 replies) |
| California homelessness? (419 replies) |
| CA Cities, Counties and Metro Areas by Number of Affluent Households, 2005-2009 (22 replies) |
| Is Eureka, Ca better than Boston, Ma? (65 replies) |
| "Humboldt hack" and winter climate in Eureka area (55 replies) |
| Eureka, CA (33 replies) |

Median year apartment built: 1958
Household type by relationship:
Households: 26,300- Male householders: 4,963 (1,768 living alone), Female householders: 5,851 (2,023 living alone)
3,602 spouses (3,554 opposite-sex spouses), 1,543 unmarried partners, (1,464 opposite-sex unmarried partners), 6,111 children (5,671 natural, 126 adopted, 312 stepchildren), 156 grandchildren, 181 brothers or sisters, 159 parents, 5 foster children, 434 other relatives, 1,905 non-relatives
- In group quarters: 1,385
Size of family households: 2,896 2-persons, 1,258 3-persons, 846 4-persons, 311 5-persons, 239 6-persons, 80 7-or-more-persons.
Size of nonfamily households: 3,941 1-person, 1,583 2-persons, 95 3-persons, 4 4-persons, 101 5-persons, 34 6-persons.
2,203 married couples with children.
1,565 single-parent households (469 men, 1,096 women).
85.4% of residents of Eureka speak English at home.
8.3% of residents speak Spanish at home (49% speak English very well, 24% speak English well, 16% speak English not well, 10% don't speak English at all).
1.2% of residents speak other Indo-European language at home (89% speak English very well, 3% speak English well, 8% speak English not well).
4.0% of residents speak Asian or Pacific Island language at home (37% speak English very well, 50% speak English well, 13% speak English not well, 1% don't speak English at all).
0.5% of residents speak other language at home (90% speak English very well, 10% speak English well).
Foreign born population: 2,182 (8.3%)
(58.6% of them are naturalized citizens)
| Here: | 6.0 |
| State: | 6.0 |
| Here: | 4.1 |
| State: | 3.9 |
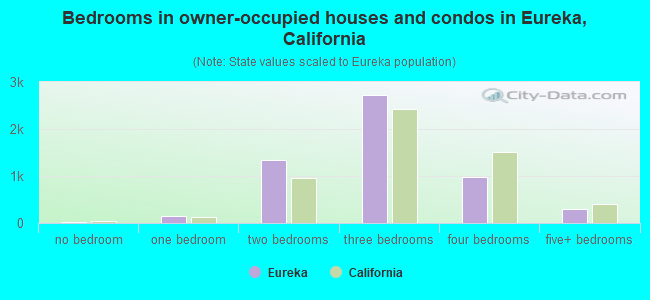
- Bedrooms in owner-occupied houses and condos in Eureka, California
- 18no bedroom
- 1551 bedroom
- 1,3502 bedrooms
- 2,7283 bedrooms
- 9724 bedrooms
- 2925+ bedrooms
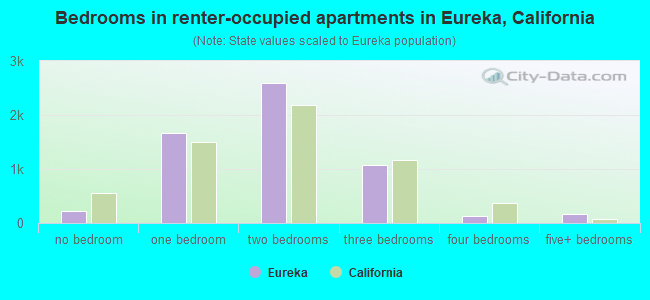
- Bedrooms in renter-occupied apartments in Eureka, California
- 215no bedroom
- 1,6691 bedroom
- 2,5882 bedrooms
- 1,0783 bedrooms
- 1244 bedrooms
- 1735+ bedrooms
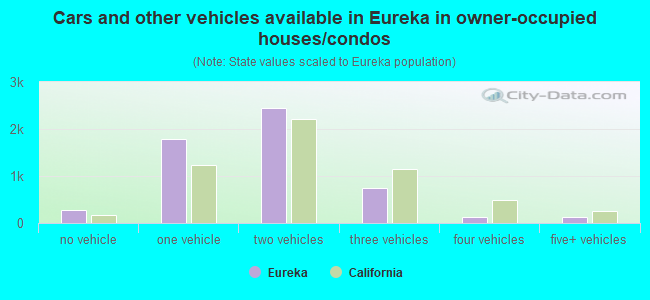
- Cars and other vehicles available in Eureka in owner-occupied houses/condos
- 270no vehicle
- 1,7931 vehicle
- 2,4472 vehicles
- 7353 vehicles
- 1374 vehicles
- 1345+ vehicles
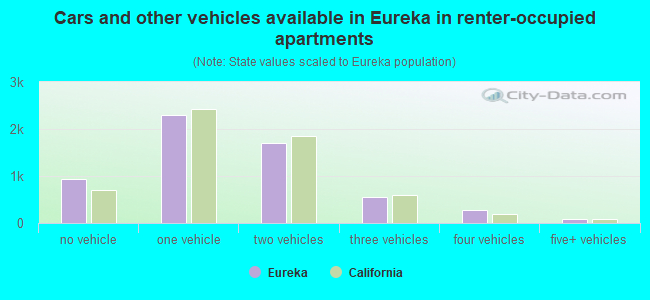
- Cars and other vehicles available in Eureka in renter-occupied apartments
- 938no vehicle
- 2,3081 vehicle
- 1,6922 vehicles
- 5453 vehicles
- 2714 vehicles
- 945+ vehicles
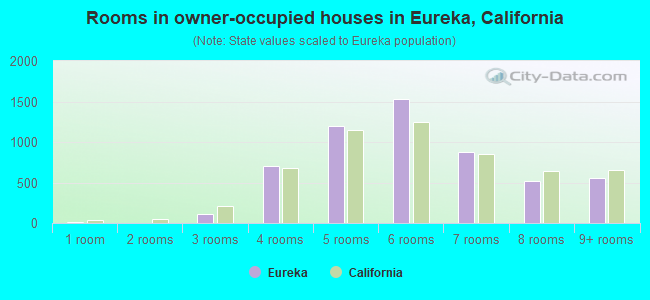
- Rooms in owner-occupied houses in Eureka, California
- 181 room
- 02 rooms
- 1173 rooms
- 6984 rooms
- 1,1995 rooms
- 1,5296 rooms
- 8747 rooms
- 5218 rooms
- 5609+ rooms
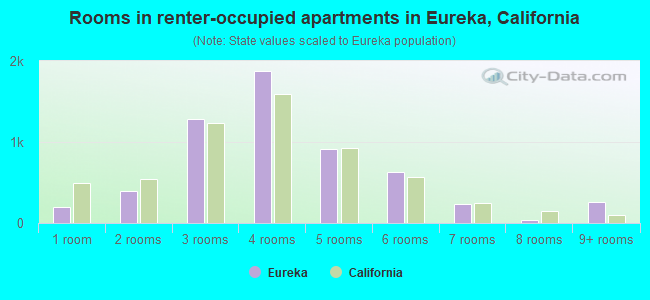
- Rooms in renter-occupied apartments in Eureka, California
- 1971 room
- 4012 rooms
- 1,2883 rooms
- 1,8794 rooms
- 9135 rooms
- 6286 rooms
- 2377 rooms
- 428 rooms
- 2649+ rooms
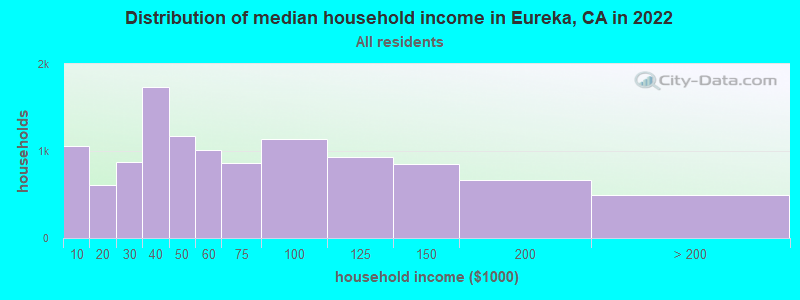
Eureka, CA household income distribution

- 1,060Less than $10,000
- 612$10,000 to $19,999
- 875$20,000 to $29,999
- 1,739$30,000 to $39,999
- 1,178$40,000 to $49,999
- 1,006$50,000 to $59,999
- 862$60,000 to $74,999
- 1,134$75,000 to $99,999
- 927$100,000 to $124,999
- 849$125,000 to $149,999
- 662$150,000 to $199,999
- 494$200,000 or more
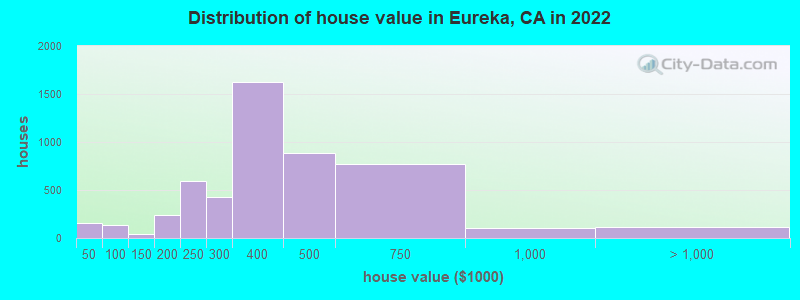
Home value of owner - occupied houses in 2022 in Eureka, CA
-
- 20Less than $10,000
- 18$10,000 to $14,999
- 11$25,000 to $29,999
- 18$30,000 to $34,999
- 85$40,000 to $49,999
- 51$60,000 to $69,999
- 12$100,000 to $124,999
- 27$125,000 to $149,999
- 168$150,000 to $174,999
- 68$175,000 to $199,999
- 591$200,000 to $249,999
- 428$250,000 to $299,999
- 1,620$300,000 to $399,999
- 886$400,000 to $499,999
- 766$500,000 to $749,999
- 103$750,000 to $999,999
- 67$1,000,000 to $1,499,999
- 35$1,500,000 to $1,999,999
- 8$2,000,000 or more
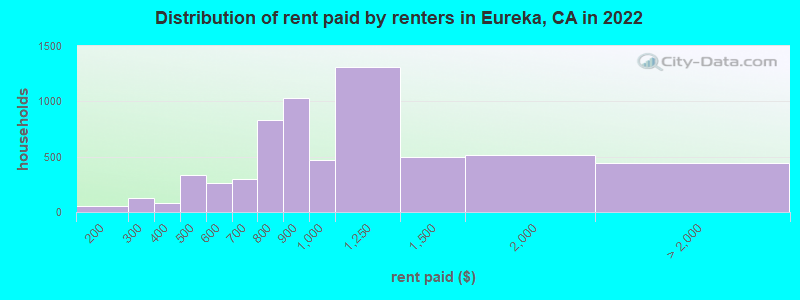
Rent paid by renters in 2022 in Eureka, CA
-
- 10Less than $100
- 43$100 to $149
- 7$150 to $199
- 93$200 to $249
- 28$250 to $299
- 38$300 to $349
- 43$350 to $399
- 18$400 to $449
- 318$450 to $499
- 62$500 to $549
- 198$550 to $599
- 230$600 to $649
- 65$650 to $699
- 479$700 to $749
- 348$750 to $799
- 1,031$800 to $899
- 472$900 to $999
- 1,306$1,000 to $1,249
- 499$1,250 to $1,499
- 518$1,500 to $1,999
- 143$2,000 to $2,499
- 41$2,500 to $2,999
- 8$3,000 to $3,499
- 45$3,500 or more
- 201No cash rent
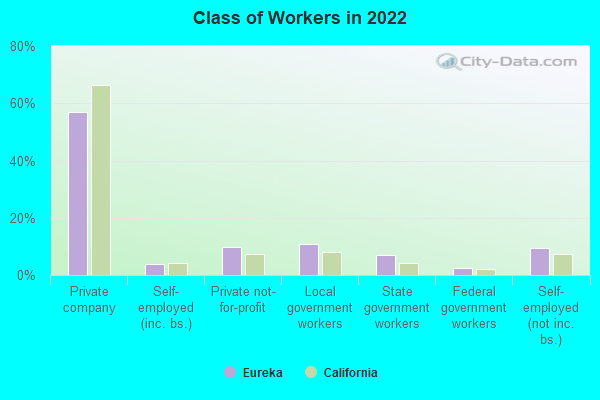
Percentage of workers working in this county: 97.8%
Number of people working at home: 1,425 (11.9% of all workers)
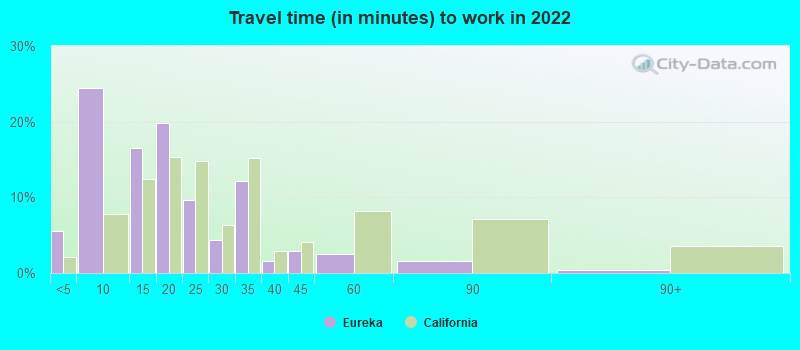
Travel time to work (commute)
- Less than 5 minutes: 911
- 5 to 9 minutes: 3,883
- 10 to 14 minutes: 1,821
- 15 to 19 minutes: 1,774
- 20 to 24 minutes: 1,134
- 25 to 29 minutes: 331
- 30 to 34 minutes: 1,413
- 35 to 39 minutes: 21
- 40 to 44 minutes: 0
- 45 to 59 minutes: 134
- 60 to 89 minutes: 53
- 90 or more minutes: 100
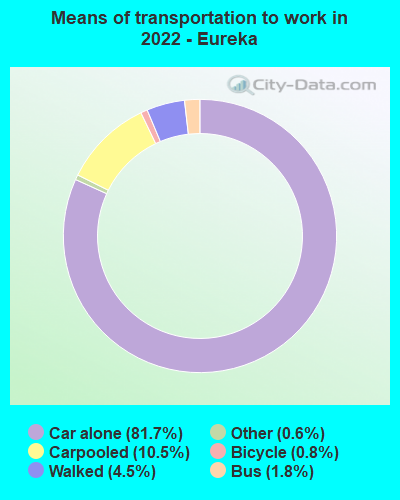
Means of transportation to work:
- Drove a car alone: 14,077 (73.5%)
- Carpooled: 1,952 (10.2%)
- Bus: 262 (1.4%)
- Subway or elevated rail: 6 (0.0%)
- Taxi: 112 (0.6%)
- Bicycle: 144 (0.8%)
- Walked: 819 (4.3%)
- Worked at home: 1,425 (7.4%)
- Unemployment by race in 2022
- Unemployment rate for White non-Hispanic residents
- 9.1%Males
- 8.1%Females
- Unemployment rate for Black residents
- 9.3%Males
- Unemployment rate for American Indian and Alaska Native residents
- 10.0%Males
- 13.0%Females
- Unemployment rate for Asian residents
- 10.8%Males
- 2.9%Females
- Unemployment rate for other race residents
- 10.0%Males
- 7.9%Females
- Unemployment rate for two or more race residents
- 30.0%Males
- 5.9%Females
- Unemployment rate for Hispanic or Latino residents
- 17.7%Males
- 10.8%Females
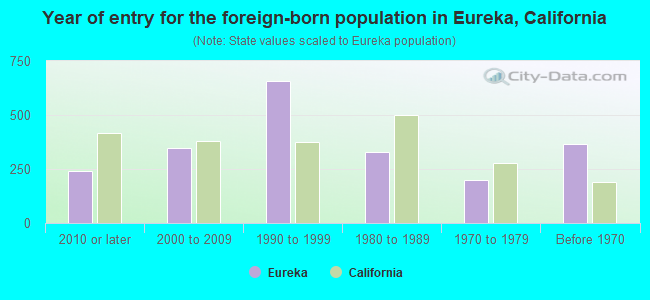
- Year of entry for the foreign-born population in Eureka, California
- 2422010 or later
- 3482000 to 2009
- 6581990 to 1999
- 3281980 to 1989
- 1991970 to 1979
- 367Before 1970
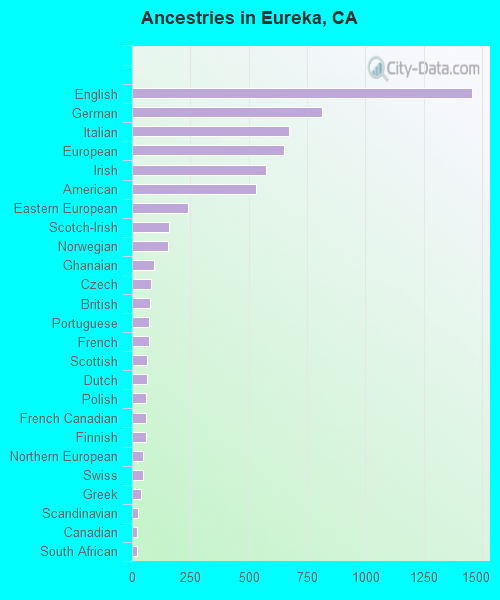
First ancestries reported:
- English: 1,457 (12.9%)
- German: 813 (7.2%)
- Italian: 672 (6.0%)
- European: 650 (5.8%)
- Irish: 574 (5.1%)
- American: 531 (4.7%)
- Eastern European: 241 (2.1%)
- Scotch-Irish: 159 (1.4%)
- Norwegian: 156 (1.4%)
- Ghanaian: 94 (0.8%)
- Czech: 82 (0.7%)
- British: 77 (0.7%)
- Portuguese: 73 (0.6%)
- French: 72 (0.6%)
- Scottish: 65 (0.6%)
- Dutch: 64 (0.6%)
- Polish: 60 (0.5%)
- French Canadian: 60 (0.5%)
- Finnish: 58 (0.5%)
- Northern European: 48 (0.4%)
- Swiss: 48 (0.4%)
- Greek: 39 (0.3%)
- Scandinavian: 26 (0.2%)
- Canadian: 22 (0.2%)
- South African: 20 (0.2%)
- Russian: 17 (0.2%)
- Nigerian: 17 (0.2%)
- Pennsylvania German: 16 (0.1%)
- Swedish: 16 (0.1%)
- Austrian: 14 (0.1%)
- Serbian: 13 (0.1%)
- Ethiopian: 12 (0.1%)
- Danish: 11 (0.10%)
- Hungarian: 7 (0.06%)
- Croatian: 5 (0.04%)
- African: 1 (0.01%)
- Israeli: 1 (0.01%)
Most common places of birth for foreign-born residents (%):
| Eureka: | 31.6% (653) |
| California: | 37.2% (3,881,193) |
| Eureka: | 8.0% (165) |
| California: | 4.2% (440,287) |
| Eureka: | 7.1% (146) |
| California: | 6.6% (684,672) |
| Eureka: | 6.5% (135) |
| California: | 0.5% (48,911) |
| Eureka: | 6.1% (126) |
| California: | 0.3% (33,937) |
| Eureka: | 5.9% (122) |
| California: | 0.6% (65,335) |
| Eureka: | 3.7% (77) |
| California: | 0.3% (31,439) |
| Eureka: | 3.7% (77) |
| California: | 1.2% (127,477) |
| Eureka: | 2.9% (60) |
| California: | 0.1% (8,814) |
| Eureka: | 2.1% (43) |
| California: | 3.0% (315,248) |
| Eureka: | 2.0% (41) |
| California: | 0.5% (55,249) |
| Eureka: | 1.6% (34) |
| California: | 7.8% (818,297) |
| Eureka: | 1.6% (34) |
| California: | 0.1% (9,241) |
| Eureka: | 1.6% (34) |
| California: | 2.8% (290,436) |
Place of birth for U.S.-born residents:
- This state: 17,377
- Other state: 6,617
- Northeast: 605
- Midwest: 1,731
- South: 2,418
- West: 1,984
80.9% of Eureka residents lived in the same house 1 years ago.
Out of people who lived in different houses, 34.4% lived in this county.
Out of people who lived in different counties, 72.8% lived in California.
| Eureka: | 80.9% |
| State average: | 88.9% |
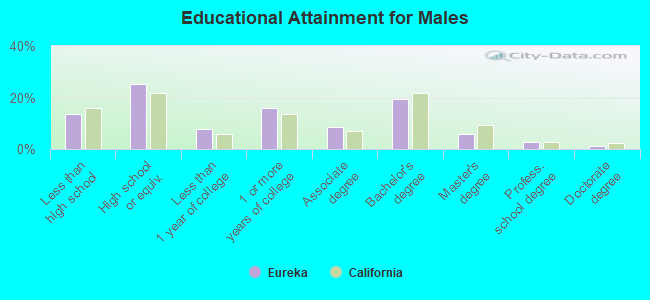
Education attainment for males 25 years and older:
- No schooling: 118
- Nursery to 4th grade: 78
- 5th and 6th grade: 46
- 7th and 8th grade: 58
- 9th grade: 324
- 10th grade: 140
- 11th grade: 105
- 12th grade, no diploma: 486
- High school graduate (or equivalency): 2,533
- Less than 1 year of college: 785
- Some college more than 1 year, no degree: 1,603
- Associate degree: 839
- Bachelor's degree: 1,951
- Master's degree: 597
- Professional school degree: 269
- Doctorate degree: 101
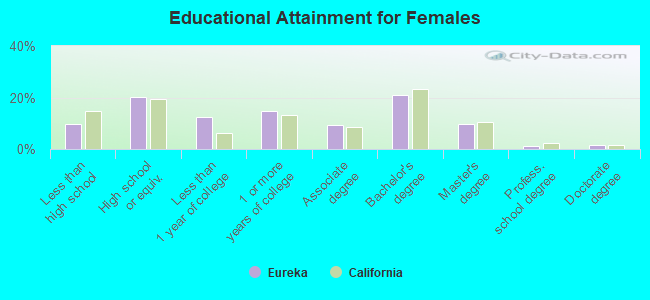
Education attainment for females 25 years and older:
- No schooling: 212
- Nursery to 4th grade: 17
- 5th and 6th grade: 109
- 7th and 8th grade: 75
- 9th grade: 28
- 10th grade: 68
- 11th grade: 269
- 12th grade, no diploma: 166
- High school graduate (or equivalency): 1,956
- Less than 1 year of college: 1,187
- Some college more than 1 year, no degree: 1,406
- Associate degree: 905
- Bachelor's degree: 2,000
- Master's degree: 949
- Professional school degree: 103
- Doctorate degree: 159
Housing units in structures:
- One, detached: 7,724
- One, attached: 581
- Two: 616
- 3 or 4: 1,189
- 5 to 9: 1,168
- 10 to 19: 213
- 20 to 49: 268
- 50 or more: 195
- Mobile homes: 113
- Boats, RVs, vans, etc.: 17
Housing units lacking complete kitchen facilities in 2022: 0.9%
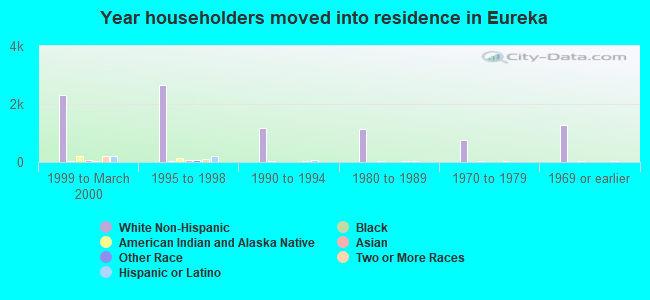
House/condo owner moved in on average 16 years ago
Renter moved in on average 3 years ago
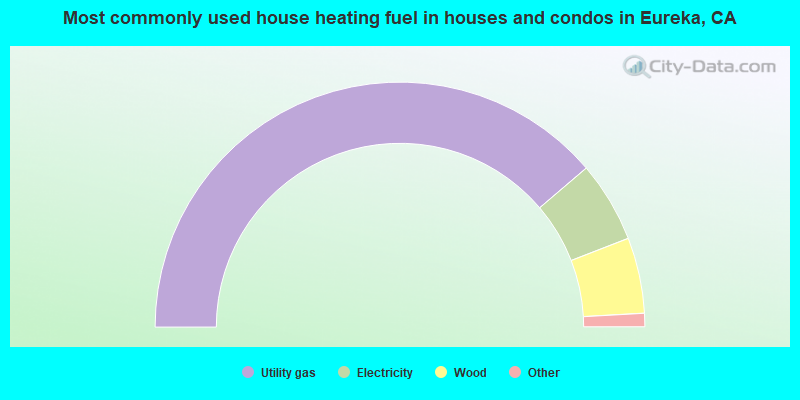
- 77.6%Utility gas
- 10.7%Electricity
- 10.0%Wood
- 1.3%Bottled, tank, or LP gas
- 0.2%Other fuel
- 0.2%No fuel used
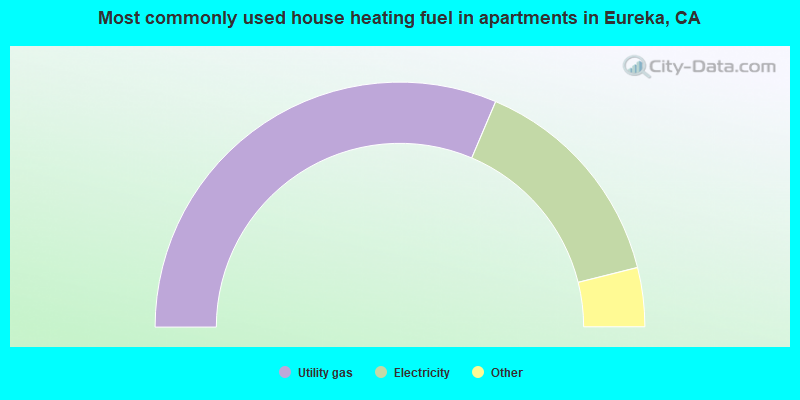
- 62.8%Utility gas
- 29.4%Electricity
- 3.4%No fuel used
- 1.8%Wood
- 1.7%Bottled, tank, or LP gas
- 0.5%Other fuel
- 0.4%Solar energy
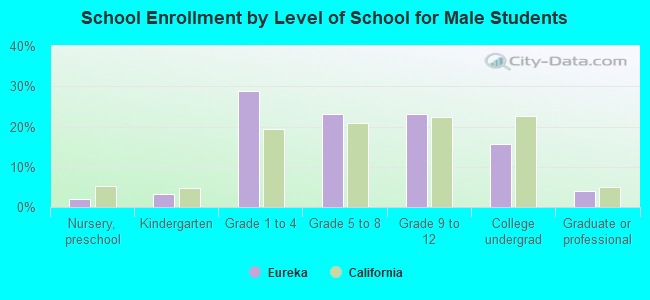
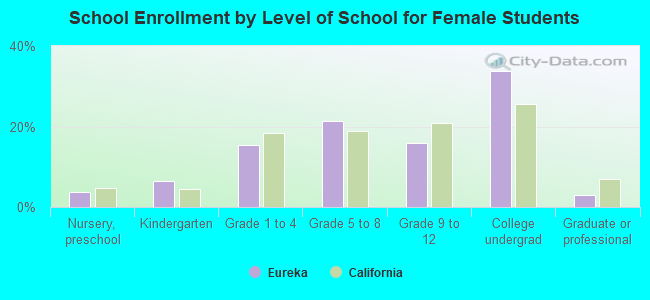
Private vs. public school enrollment:
| Here: | 11.1% |
| California: | 10.5% |
| Here: | 11.3% |
| California: | 8.5% |
| Here: | 5.4% |
| California: | 15.9% |