Finley, WA (Washington) Houses and Residents
| Finley: | $308,889 |
| Washington: | $569,500 |
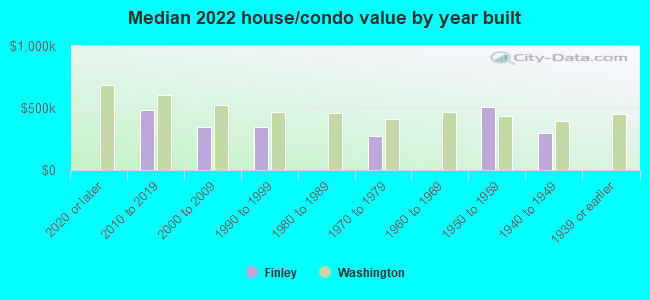
Mean price in 2022:
Detached houses: $427,798
Here: $427,798 State: $734,307 Mobile homes: $271,901
Here: $271,901 State: $218,362
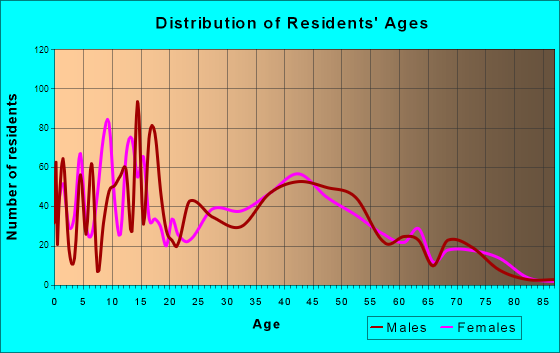
Total population: 6,012 (Urban population: 4,579, Rural population: 1,085 (104 farm, 981 nonfarm))
Houses: 2,117 (1,884 occupied: 1,450 owner occupied, 435 renter occupied)
| % of renters here: | 23% |
| State: | 36% |
Housing density: 184 houses/condos per square mile
Median price asked for vacant for-sale houses and condos in 2022 in this county: $190,801.
Median contract rent in 2022: $997 (lower quartile is $729, upper quartile is $1,323)
Median rent asked for vacant for-rent units in 2022: $556
Median gross rent in Finley, WA in 2022: $1,150
Housing units in Finley with a mortgage: 501 (82 second mortgage, 0 home equity loan, 32 both second mortgage and home equity loan)
Houses without a mortgage: 0
Median household income for houses/condos with a mortgage: $86,524
Median household income for apartments without a mortgage: $99,211
Median monthly housing costs: $831
Compare current foreclosures near Finley, WA:
| Photo | Address | Area | Beds / Baths | Price | Details |
|---|---|---|---|---|---|

|
#1
E Foster Wells Rd
Pasco, WA 99301
|
- sq. feet
|
2 baths 3 beds |
show details | |

|
#2
S Hawthorne St
Kennewick, WA 99336
|
1,820 sq. feet
|
2 baths 3 beds |
show details | |

|
#3
E Bowles Rd
Kennewick, WA 99337
|
- sq. feet
|
1 baths 3 beds |
show details | |

|
#4
W 21st Pl
Kennewick, WA 99337
|
1,250 sq. feet
|
2 baths 3 beds |
show details | |

|
#5
Humphreys St
Richland, WA 99352
|
1,200 sq. feet
|
1 baths 3 beds |
show details | |

|
#6
Ronan St
Pasco, WA 99301
|
- sq. feet
|
2 baths 3 beds |
show details | |

|
#7
N Georgia Pl
Kennewick, WA 99336
|
1,848 sq. feet
|
2 baths 3 beds |
show details | |

|
#8
Hudson Ave
Richland, WA 99354
|
2,460 sq. feet
|
2 baths 4 beds |
show details | |

|
#9
S Dennis Pl
Kennewick, WA 99337
|
1,890 sq. feet
|
2 baths 3 beds |
show details | |

|
#10
S Fir St
Kennewick, WA 99336
|
793 sq. feet
|
1 baths 3 beds |
show details |
| Photo | Address | Area | Beds / Baths | Price | Details |
|---|---|---|---|---|---|

|
#11
Marysville Way
Richland, WA 99352
|
- sq. feet
|
2 baths 3 beds |
show details | |

|
#12
Summit View Dr
Kennewick, WA 99338
|
4,100 sq. feet
|
3 baths 4 beds |
show details | |

|
#13
S Irby Ct
Kennewick, WA 99337
|
1,784 sq. feet
|
2 baths 3 beds |
show details | |

|
#14
W 24th Ave
Kennewick, WA 99337
|
1,394 sq. feet
|
2 baths 3 beds |
show details | |

|
#15
W Metaline Pl
Kennewick, WA 99336
|
2,034 sq. feet
|
1 baths 5 beds |
show details | |

|
#16
W Tucannon Ave
Kennewick, WA 99336
|
1,706 sq. feet
|
2 baths 3 beds |
show details | |

|
#17
Largent Rd
Burbank, WA 99323
|
1,440 sq. feet
|
2 baths 3 beds |
show details | |

|
#18
N Neel St
Kennewick, WA 99336
|
1,378 sq. feet
|
2 baths 3 beds |
show details | |

|
#19
W 7th Ave
Kennewick, WA 99336
|
2,239 sq. feet
|
1 baths 3 beds |
show details | |

|
#20
W Nixon St
Pasco, WA 99301
|
1,264 sq. feet
|
2 baths 3 beds |
show details |
| Photo | Address | Area | Beds / Baths | Price | Details |
|---|---|---|---|---|---|

|
#21
N Kellogg St
Kennewick, WA 99336
|
1,608 sq. feet
|
2 baths 4 beds |
show details | |

|
#22
S Kellogg St
Kennewick, WA 99336
|
1,592 sq. feet
|
2 baths 4 beds |
show details | |

|
#23
Wisteria St
Richland, WA 99352
|
1,208 sq. feet
|
2 baths 3 beds |
show details | |

|
#24
S Nelson St
Kennewick, WA 99338
|
1,755 sq. feet
|
2 baths 3 beds |
show details | |

|
#25
Torbett St
Richland, WA 99354
|
1,914 sq. feet
|
1 baths 3 beds |
show details | |

|
#26
N Volland St
Kennewick, WA 99336
|
1,269 sq. feet
|
1 baths 3 beds |
show details | |

|
#27
W Marie St
Pasco, WA 99301
|
1,328 sq. feet
|
1 baths 3 beds |
show details | |

|
#28
W Imnaha Ave
Kennewick, WA 99336
|
1,910 sq. feet
|
2 baths 3 beds |
show details | |

|
#29
Shasta Ave
Richland, WA 99354
|
3,521 sq. feet
|
2 baths 3 beds |
show details | |

|
#30
W 4th Ave
Kennewick, WA 99336
|
962 sq. feet
|
1 baths 3 beds |
show details |
| Photo | Address | Area | Beds / Baths | Price | Details |
|---|---|---|---|---|---|

|
#31
N Road 32
Pasco, WA 99301
|
1,300 sq. feet
|
2 baths 3 beds |
show details | |

|
#32
N Williams St
Kennewick, WA 99336
|
1,057 sq. feet
|
1 baths 3 beds |
show details | |

|
#33
N Road 40
Pasco, WA 99301
|
1,412 sq. feet
|
1 baths 3 beds |
show details | |

|
#34
N Road 50
Pasco, WA 99301
|
1,728 sq. feet
|
2 baths 3 beds |
show details | |

|
#35
Cedar Ave
Richland, WA 99354
|
1,200 sq. feet
|
1 baths 3 beds |
show details | |

|
#36
W Seabrook Ct
Pasco, WA 99301
|
1,348 sq. feet
|
3 baths 4 beds |
show details | |

|
#37
W Richardson Rd
Pasco, WA 99301
|
1,570 sq. feet
|
3 baths 3 beds |
show details | |

|
#38
Perkins Ave
Richland, WA 99354
|
961 sq. feet
|
1 baths 3 beds |
show details | |

|
#39
S Reed St
Kennewick, WA 99336
|
1,469 sq. feet
|
2 baths 3 beds |
show details | |

|
#40
Cord Dr
Pasco, WA 99301
|
1,092 sq. feet
|
2 baths 3 beds |
show details |
| Photo | Address | Area | Beds / Baths | Price | Details |
|---|---|---|---|---|---|

|
#41
S Mckinley St
Kennewick, WA 99336
|
2,569 sq. feet
|
2 baths 4 beds |
show details | |

|
#42
E Chelsea Rd
Kennewick, WA 99338
|
4,595 sq. feet
|
5 baths 7 beds |
show details | |

|
#43
Kau Trl
Pasco, WA 99301
|
1,323 sq. feet
|
1 baths 2 beds |
show details | |

|
#44
Kau Trl
Pasco, WA 99301
|
1,568 sq. feet
|
2 baths 3 beds |
show details | |

|
#45
Rimrock Ave
Richland, WA 99352
|
1,080 sq. feet
|
2 baths 3 beds |
show details | |

|
#46
Canyon Rim Ct
Richland, WA 99352
|
2,098 sq. feet
|
2 baths 4 beds |
show details | |

|
#47
Hudson Dr
Pasco, WA 99301
|
1,768 sq. feet
|
2 baths 3 beds |
show details | |

|
#48
Muris Ln
Pasco, WA 99301
|
1,366 sq. feet
|
2 baths 3 beds |
show details | |

|
#49
Quatsino Dr
Pasco, WA 99301
|
2,137 sq. feet
|
2 baths 4 beds |
show details | |

|
Check over 1 million property listings on Foreclosure.com!
|
browse all offers | |||

Latest news about housing in Finley, WA collected exclusively by city-data.com from local newspapers, TV, and radio stations

 | Legal marijuana what do you think about it? (53 replies) |
| Riverpointe Apts? (11 replies) |
| Advice for Move and Driving to Work Near Kahlotus (19 replies) |
| moving to Tri cities from Alaska (4 replies) |
| How would you describe the people in tri cities?(mentality) (6 replies) |
| very worst parts of each Tri-City (33 replies) |
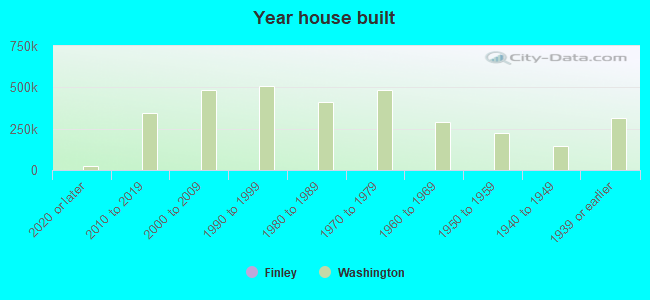
Median year apartment built: 1983
Household type by relationship:
Households: 5,995- Male householders: 982 (178 living alone), Female householders: 883 (165 living alone)
892 spouses (869 opposite-sex spouses), 174 unmarried partners, (174 opposite-sex unmarried partners), 2,088 children (1,962 natural, 67 adopted, 58 stepchildren), 427 grandchildren, 90 brothers or sisters, 21 parents, 0 foster children, 86 other relatives, 348 non-relatives
Size of family households: 491 2-persons, 357 3-persons, 208 4-persons, 192 5-persons, 156 6-persons, 34 7-or-more-persons.
Size of nonfamily households: 361 1-person, 60 2-persons, 23 5-persons.
510 married couples with children.
438 single-parent households (34 men, 404 women).
77.3% of residents of Finley speak English at home.
21.9% of residents speak Spanish at home (63% speak English very well, 19% speak English well, 18% speak English not well).
Foreign born population: 767 (12.8%)
(45.1% of them are naturalized citizens)
| Here: | 6.3 |
| State: | 6.5 |
| Here: | 5.3 |
| State: | 3.9 |
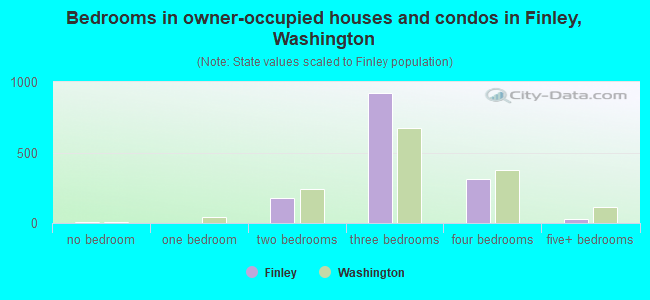
- Bedrooms in owner-occupied houses and condos in Finley, Washington
- 9no bedroom
- 01 bedroom
- 1752 bedrooms
- 9243 bedrooms
- 3124 bedrooms
- 305+ bedrooms
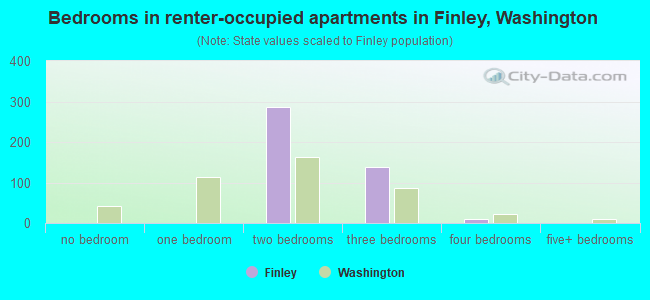
- Bedrooms in renter-occupied apartments in Finley, Washington
- 0no bedroom
- 01 bedroom
- 2862 bedrooms
- 1383 bedrooms
- 114 bedrooms
- 05+ bedrooms
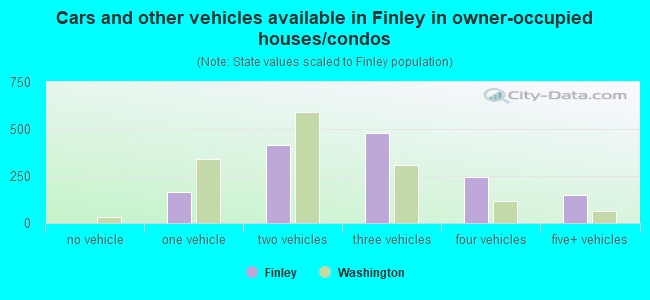
- Cars and other vehicles available in Finley in owner-occupied houses/condos
- 0no vehicle
- 1641 vehicle
- 4162 vehicles
- 4793 vehicles
- 2454 vehicles
- 1475+ vehicles
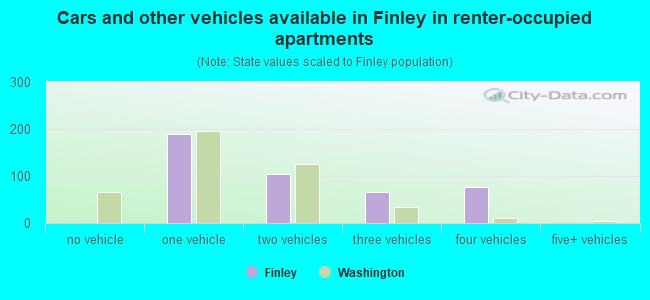
- Cars and other vehicles available in Finley in renter-occupied apartments
- 0no vehicle
- 1891 vehicle
- 1052 vehicles
- 653 vehicles
- 774 vehicles
- 05+ vehicles
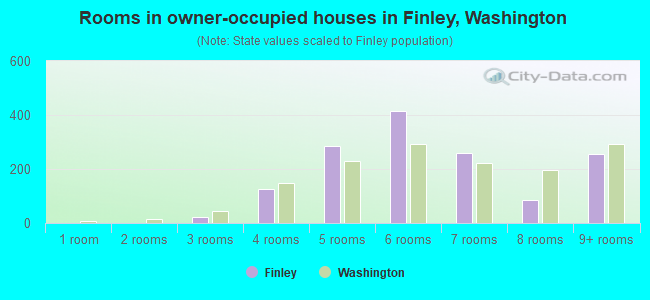
- Rooms in owner-occupied houses in Finley, Washington
- 01 room
- 02 rooms
- 233 rooms
- 1274 rooms
- 2845 rooms
- 4146 rooms
- 2617 rooms
- 848 rooms
- 2579+ rooms
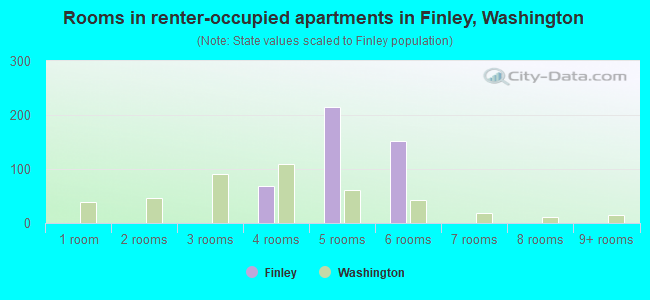
- Rooms in renter-occupied apartments in Finley, Washington
- 01 room
- 02 rooms
- 03 rooms
- 694 rooms
- 2145 rooms
- 1516 rooms
- 07 rooms
- 08 rooms
- 09+ rooms
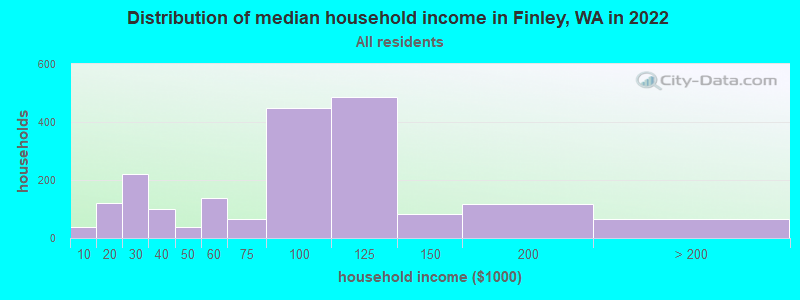
Finley, WA household income distribution

- 37Less than $10,000
- 119$10,000 to $19,999
- 222$20,000 to $29,999
- 99$30,000 to $39,999
- 39$40,000 to $49,999
- 138$50,000 to $59,999
- 67$60,000 to $74,999
- 448$75,000 to $99,999
- 487$100,000 to $124,999
- 82$125,000 to $149,999
- 117$150,000 to $199,999
- 67$200,000 or more
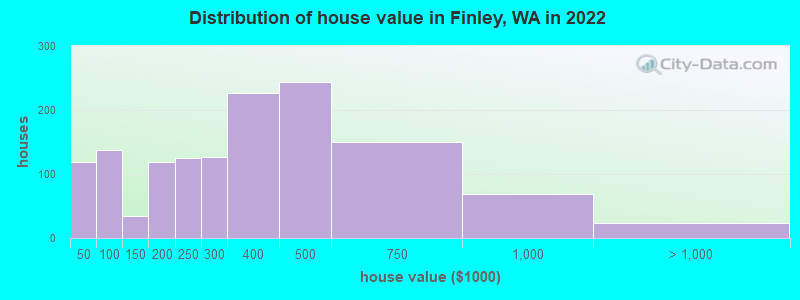
Home value of owner - occupied houses in 2022 in Finley, WA
-
- 83$10,000 to $14,999
- 34$25,000 to $29,999
- 111$60,000 to $69,999
- 9$80,000 to $89,999
- 17$90,000 to $99,999
- 24$100,000 to $124,999
- 10$125,000 to $149,999
- 64$150,000 to $174,999
- 54$175,000 to $199,999
- 125$200,000 to $249,999
- 127$250,000 to $299,999
- 226$300,000 to $399,999
- 243$400,000 to $499,999
- 149$500,000 to $749,999
- 69$750,000 to $999,999
- 23$1,000,000 to $1,499,999
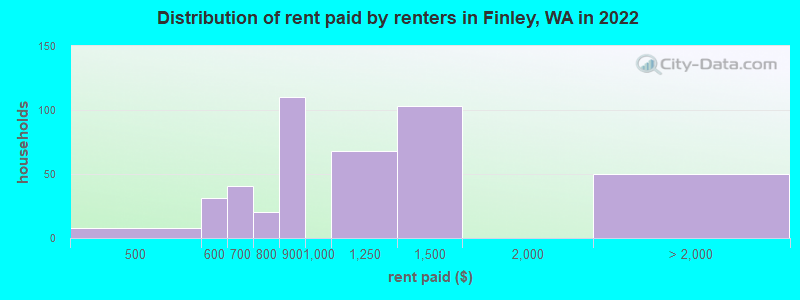
Rent paid by renters in 2022 in Finley, WA
-
- 7$450 to $499
- 30$500 to $549
- 41$600 to $649
- 19$700 to $749
- 109$800 to $899
- 67$1,000 to $1,249
- 102$1,250 to $1,499
- 49No cash rent
Percentage of workers working in this county: 68.0%
Number of people working at home: 312 (11.8% of all workers)
Travel time to work (commute)
- Less than 5 minutes: 33
- 5 to 9 minutes: 154
- 10 to 14 minutes: 275
- 15 to 19 minutes: 114
- 20 to 24 minutes: 347
- 25 to 29 minutes: 156
- 30 to 34 minutes: 457
- 35 to 39 minutes: 51
- 40 to 44 minutes: 250
- 45 to 59 minutes: 327
- 60 to 89 minutes: 89
- 90 or more minutes: 69
Means of transportation to work:
- Drove a car alone: 1,973 (82.1%)
- Carpooled: 314 (13.1%)
- Motorcycle: 10 (0.4%)
- Walked: 19 (0.8%)
- Other means: 6 (0.2%)
- Worked at home: 81 (3.4%)
- Unemployment by race in 2022
- Unemployment rate for White non-Hispanic residents
- 1.9%Males
- 3.4%Females
- Unemployment rate for other race residents
- 21.4%Females
- Unemployment rate for two or more race residents
- 37.6%Males
- Unemployment rate for Hispanic or Latino residents
- 18.2%Males
- 19.2%Females
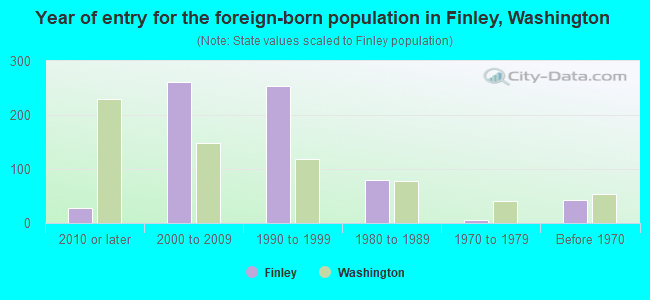
- Year of entry for the foreign-born population in Finley, Washington
- 282010 or later
- 2612000 to 2009
- 2531990 to 1999
- 791980 to 1989
- 61970 to 1979
- 42Before 1970
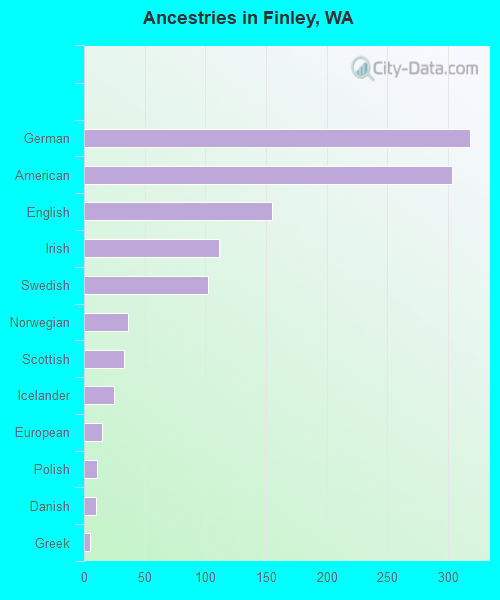
First ancestries reported:
- German: 318 (11.4%)
- American: 303 (10.8%)
- English: 155 (5.5%)
- Irish: 111 (4.0%)
- Swedish: 102 (3.6%)
- Norwegian: 36 (1.3%)
- Scottish: 33 (1.2%)
- Icelander: 25 (0.9%)
- European: 15 (0.5%)
- Polish: 11 (0.4%)
- Danish: 10 (0.4%)
- Greek: 5 (0.2%)
Most common places of birth for foreign-born residents (%):
| Finley: | 95.3% (734) |
| Washington: | 21.1% (241,655) |
| Finley: | 2.7% (21) |
| Washington: | 0.5% (5,640) |
| Finley: | 1.6% (12) |
| Washington: | 7.4% (84,470) |
Place of birth for U.S.-born residents:
- This state: 4,143
- Other state: 1,202
- Northeast: 118
- Midwest: 136
- South: 106
- West: 846
86.5% of Finley residents lived in the same house 1 years ago.
Out of people who lived in different houses, 44.5% lived in this county.
Out of people who lived in different counties, 100.0% lived in Washington.
| Finley: | 86.5% |
| State average: | 85.2% |
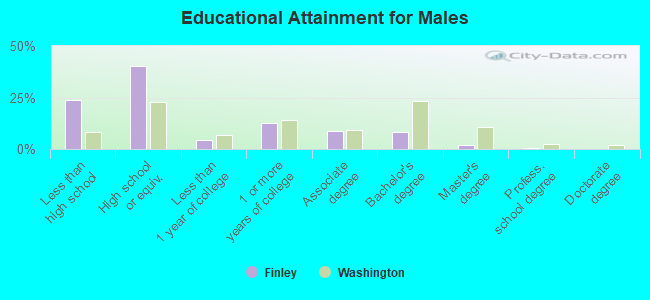
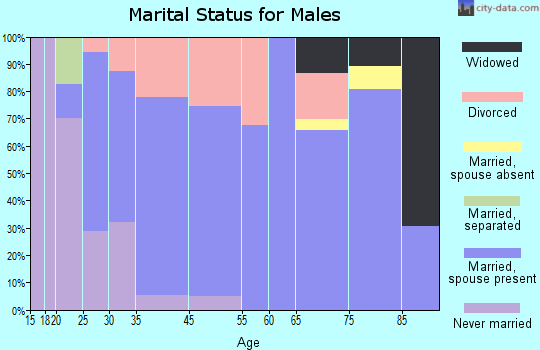
Education attainment for males 25 years and older:
- No schooling: 37
- Nursery to 4th grade: 77
- 5th and 6th grade: 72
- 7th and 8th grade: 226
- 9th grade: 15
- 10th grade: 33
- 11th grade: 8
- 12th grade, no diploma: 61
- High school graduate (or equivalency): 886
- Less than 1 year of college: 93
- Some college more than 1 year, no degree: 274
- Associate degree: 188
- Bachelor's degree: 184
- Master's degree: 39
- Professional school degree: 16
- Doctorate degree: 0
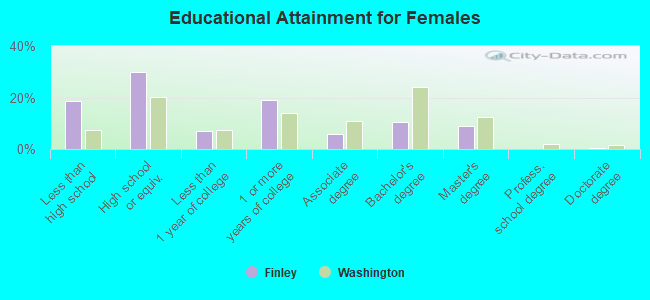
Education attainment for females 25 years and older:
- No schooling: 0
- Nursery to 4th grade: 0
- 5th and 6th grade: 206
- 7th and 8th grade: 0
- 9th grade: 27
- 10th grade: 0
- 11th grade: 117
- 12th grade, no diploma: 14
- High school graduate (or equivalency): 582
- Less than 1 year of college: 135
- Some college more than 1 year, no degree: 369
- Associate degree: 111
- Bachelor's degree: 204
- Master's degree: 171
- Professional school degree: 0
- Doctorate degree: 11
Housing units in structures:
- One, detached: 821
- One, attached: 21
- 20 to 49: 65
- Mobile homes: 1,209
Median worth of mobile homes: $214,890
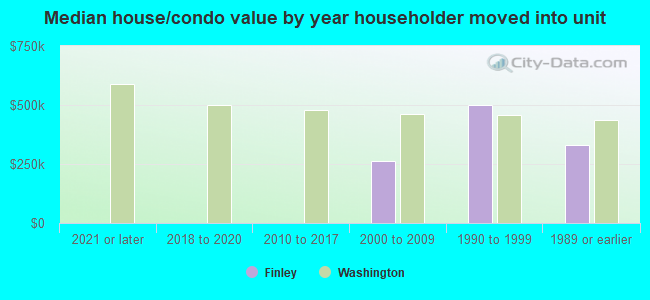
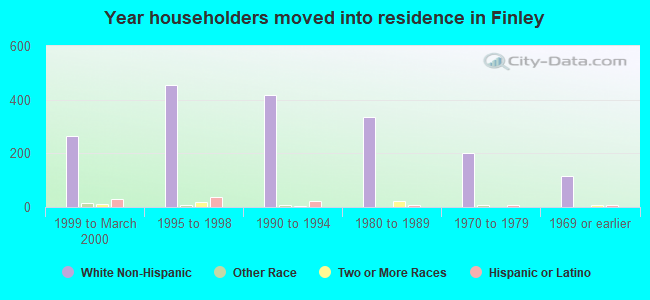
House/condo owner moved in on average 16 years ago
Renter moved in on average 4 years ago
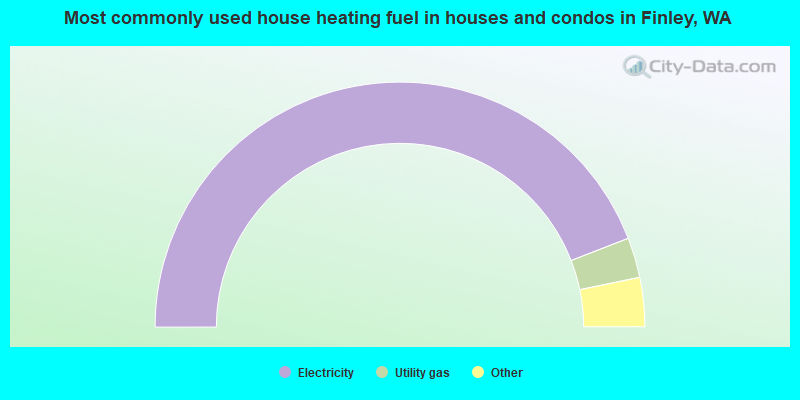
- 88.3%Electricity
- 5.3%Utility gas
- 3.9%Wood
- 1.3%Bottled, tank, or LP gas
- 1.3%Fuel oil, kerosene, etc.
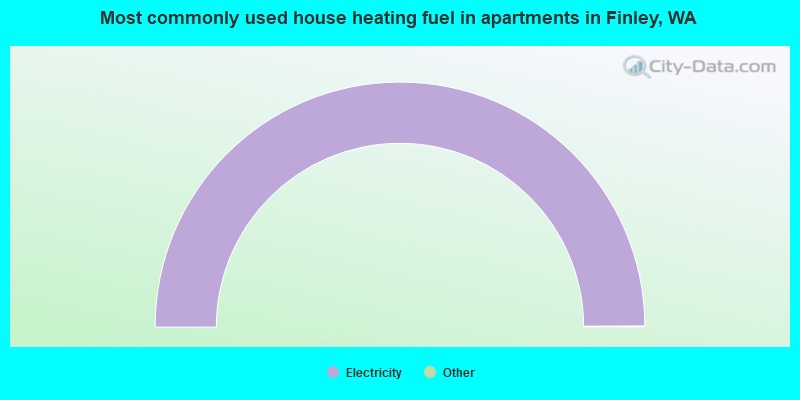
- 100.0%Electricity
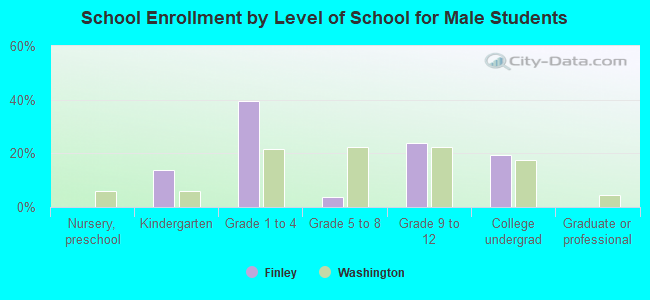
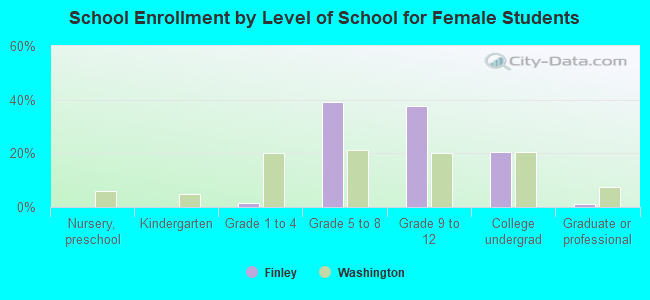
Private vs. public school enrollment:
| Here: | 3.8% |
| Washington: | 12.4% |
| Here: | 0.0% |
| Washington: | 9.2% |
| Here: | 0.0% |
| Washington: | 16.5% |