Flintville, TN (Tennessee) Houses and Residents
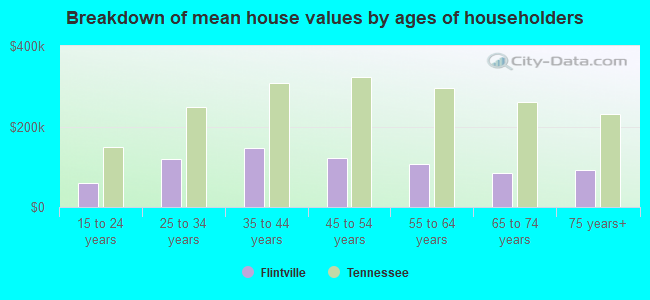
| Flintville: | $201,833 |
| Tennessee: | $284,800 |
Total population: 4,939 (Urban population: 0, Rural population: 4,738 (232 farm, 4,506 nonfarm))
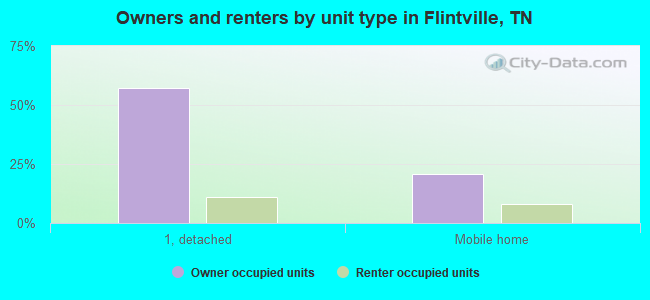
Houses: 2,086 (1,832 occupied: 1,463 owner occupied, 369 renter occupied)
| % of renters here: | 20% |
| State: | 33% |
Housing density: 22 houses/condos per square mile
Median price asked for vacant for-sale houses and condos in 2022 in this county: $413,308.
Median contract rent in 2022: $601 (lower quartile is $467, upper quartile is $661)
Median rent asked for vacant for-rent units in 2022: $570
Median gross rent in Flintville, TN in 2022: $820
Housing units in Flintville with a mortgage: 429 (41 second mortgage, 23 home equity loan, 0 both second mortgage and home equity loan)
Houses without a mortgage: 304
Compare current foreclosures near Flintville, TN:
| Photo | Address | Area | Beds / Baths | Price | Details |
|---|---|---|---|---|---|

|
#1
Howell Hill Rd
Flintville, TN 37335
|
1,269 sq. feet
|
1 baths - beds |
show details | |

|
#2
Brighton Rd
Flintville, TN 37335
|
1,025 sq. feet
|
1 baths - beds |
show details | |

|
#3
Howell Hill Rd
Flintville, TN 37335
|
1,216 sq. feet
|
- baths - beds |
show details | |

|
#4
Shady Grove Rd
Flintville, TN 37335
|
- sq. feet
|
- baths - beds |
show details | |

|
#5
Snow Rd
Flintville, TN 37335
|
- sq. feet
|
- baths - beds |
show details | |

|
#6
Henry Askins Rd
Hazel Green, AL 35750
|
- sq. feet
|
2 baths 4 beds |
show details | |

|
#7
Hall Dr
Fayetteville, TN 37334
|
2,727 sq. feet
|
3 baths 4 beds |
show details | |

|
#8
Stonebridge Dr
Fayetteville, TN 37334
|
1,198 sq. feet
|
1 baths 2 beds |
show details | |

|
#9
Rowan St
Meridianville, AL 35759
|
- sq. feet
|
2 baths 4 beds |
show details | |

|
#10
Fran Dr
Fayetteville, TN 37334
|
1,225 sq. feet
|
2 baths 4 beds |
show details |
| Photo | Address | Area | Beds / Baths | Price | Details |
|---|---|---|---|---|---|

|
#11
Pauline Dr
Hazel Green, AL 35750
|
992 sq. feet
|
1 baths 2 beds |
show details | |

|
#12
Stormy Dr
New Market, AL 35761
|
1,182 sq. feet
|
2 baths 3 beds |
show details | |

|
#13
Charley Patterson Rd
New Market, AL 35761
|
1,419 sq. feet
|
1 baths 3 beds |
show details | |

|
#14
Oakley Dr
Fayetteville, TN 37334
|
1,434 sq. feet
|
2 baths 3 beds |
show details | |

|
#15
Bullard Rd
Hazel Green, AL 35750
|
1,256 sq. feet
|
1 baths - beds |
show details | |

|
#16
Mountain Rd
Elora, TN 37328
|
1,425 sq. feet
|
1 baths - beds |
show details | |

|
#17
Jimmy Fisk Rd
Hazel Green, AL 35750
|
1,280 sq. feet
|
2 baths - beds |
show details | |

|
#18
Mcfarlen Dr
Hazel Green, AL 35750
|
1,288 sq. feet
|
2 baths - beds |
show details | |

|
#19
Ed Baeder Rd
Hazel Green, AL 35750
|
1,970 sq. feet
|
2 baths - beds |
show details | |

|
#20
Butter And Egg Rd
Hazel Green, AL 35750
|
1,176 sq. feet
|
1 baths - beds |
show details |
| Photo | Address | Area | Beds / Baths | Price | Details |
|---|---|---|---|---|---|

|
#21
Cozy Creek Rd
Meridianville, AL 35759
|
2,030 sq. feet
|
3 baths - beds |
show details | |

|
#22
Maddie Ridge Rd
Meridianville, AL 35759
|
1,925 sq. feet
|
2 baths - beds |
show details | |

|
#23
Cepha Dr
Hazel Green, AL 35750
|
1,226 sq. feet
|
2 baths - beds |
show details | |

|
#24
Butch Cir
Hazel Green, AL 35750
|
1,673 sq. feet
|
2 baths - beds |
show details | |

|
#25
Gimlet Rd
Fayetteville, TN 37334
|
1,680 sq. feet
|
1 baths - beds |
show details | |

|
#26
Mandy Dr
Hazel Green, AL 35750
|
1,083 sq. feet
|
2 baths - beds |
show details | |

|
#27
Cepha Dr
Hazel Green, AL 35750
|
1,936 sq. feet
|
2 baths - beds |
show details | |

|
#28
8th Ave
Fayetteville, TN 37334
|
900 sq. feet
|
1 baths - beds |
show details | |

|
#29
Steger Rd
Meridianville, AL 35759
|
1,742 sq. feet
|
2 baths - beds |
show details | |

|
#30
Macon Rd
Hazel Green, AL 35750
|
1,310 sq. feet
|
2 baths - beds |
show details |
| Photo | Address | Area | Beds / Baths | Price | Details |
|---|---|---|---|---|---|

|
#31
Bermuda Lakes Dr
Meridianville, AL 35759
|
3,277 sq. feet
|
2 baths - beds |
show details | |

|
#32
Clingstone Cir
Meridianville, AL 35759
|
1,565 sq. feet
|
2 baths - beds |
show details | |

|
#33
Golden Harvest Dr
New Market, AL 35761
|
2,299 sq. feet
|
2 baths - beds |
show details | |

|
#34
Mccollum Ln
New Market, AL 35761
|
1,020 sq. feet
|
1 baths - beds |
show details | |

|
#35
Charity Ln
Hazel Green, AL 35750
|
1,422 sq. feet
|
2 baths - beds |
show details | |

|
#36
Will Holt Rd
Hazel Green, AL 35750
|
1,305 sq. feet
|
1 baths - beds |
show details | |

|
#37
Reeney Dr
New Market, AL 35761
|
2,010 sq. feet
|
2 baths - beds |
show details | |

|
#38
Narrow Ln
New Market, AL 35761
|
1,481 sq. feet
|
2 baths - beds |
show details | |

|
#39
White Willow Ct
Hazel Green, AL 35750
|
1,403 sq. feet
|
2 baths - beds |
show details | |

|
#40
Dixon Rd
Hazel Green, AL 35750
|
1,000 sq. feet
|
1 baths - beds |
show details |
| Photo | Address | Area | Beds / Baths | Price | Details |
|---|---|---|---|---|---|

|
#41
Dixon Rd
Hazel Green, AL 35750
|
1,000 sq. feet
|
1 baths - beds |
show details | |

|
#42
Easy St
Hazel Green, AL 35750
|
1,472 sq. feet
|
2 baths - beds |
show details | |

|
#43
Bagley Dr
Fayetteville, TN 37334
|
1,572 sq. feet
|
1 baths - beds |
show details | |

|
#44
Washington St W
Fayetteville, TN 37334
|
2,330 sq. feet
|
2 baths - beds |
show details | |

|
#45
Lawndale St
Fayetteville, TN 37334
|
1,800 sq. feet
|
1 baths - beds |
show details | |

|
#46
Singletree Dr
Hazel Green, AL 35750
|
1,621 sq. feet
|
2 baths - beds |
show details | |

|
#47
Ready Section Rd
Hazel Green, AL 35750
|
1,305 sq. feet
|
2 baths - beds |
show details | |

|
#48
Red Hawk Ln
Winchester, TN 37398
|
1,176 sq. feet
|
1 baths - beds |
show details | |

|
#49
Meridianville Rd
Meridianville, AL 35759
|
2,429 sq. feet
|
2 baths - beds |
show details | |

|
Check over 1 million property listings on Foreclosure.com!
|
browse all offers | |||


Household type by relationship:
Households: 33,078- In family households: 28,525 (6,942 male householders, 2,507 female householders)
7,233 spouses, 9,242 children (8,321 natural, 251 adopted, 670 stepchildren), 946 grandchildren, 242 brothers or sisters, 253 parents, foster children, 370 other relatives, 610 non-relatives
- In nonfamily households: 4,553 (1,714 male householders (1,432 living alone)), 2,219 female householders (2,002 living alone)), 620 nonrelatives
- In group quarters: 283 (272 institutionalized population)
5,225 married couples with children.
1,572 single-parent households (330 men, 1,242 women).
97.5% of residents of Flintville speak English at home.
1.3% of residents speak Spanish at home (93% speak English very well, 7% speak English well).
0.7% of residents speak other Indo-European language at home (100% speak English very well).
0.5% of residents speak Asian or Pacific Island language at home (57% speak English not well, 43% don't speak English at all).
Foreign born population: 120 (2.2%)
(78.3% of them are naturalized citizens)
| Here: | 6.3 |
| State: | 6.5 |
| Here: | 4.9 |
| State: | 4.4 |
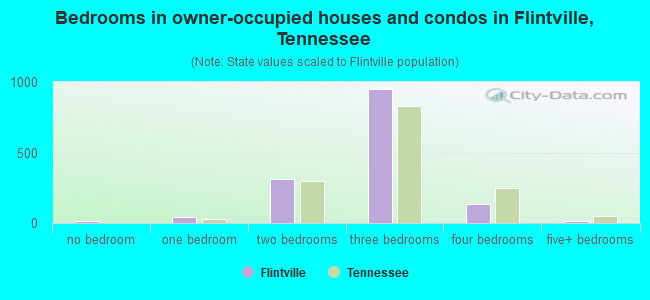
- Bedrooms in owner-occupied houses and condos in Flintville, Tennessee
- 11no bedroom
- 421 bedroom
- 3142 bedrooms
- 9503 bedrooms
- 1324 bedrooms
- 145+ bedrooms
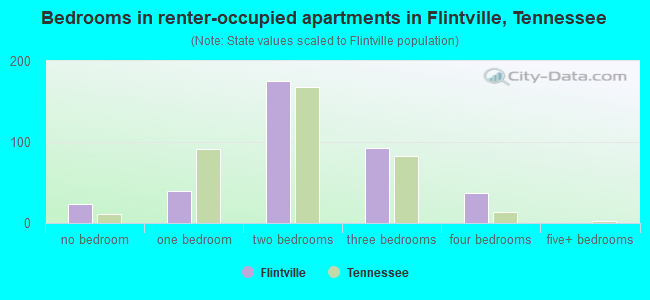
- Bedrooms in renter-occupied apartments in Flintville, Tennessee
- 24no bedroom
- 401 bedroom
- 1752 bedrooms
- 933 bedrooms
- 374 bedrooms
- 05+ bedrooms
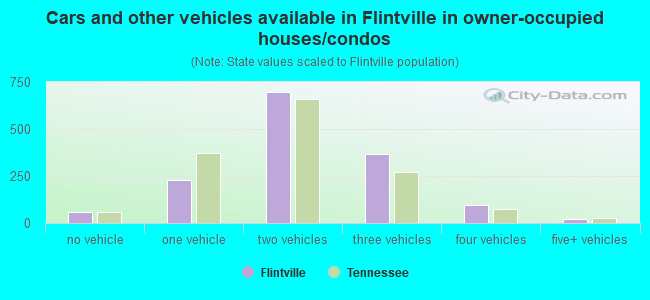
- Cars and other vehicles available in Flintville in owner-occupied houses/condos
- 56no vehicle
- 2291 vehicle
- 6952 vehicles
- 3653 vehicles
- 964 vehicles
- 225+ vehicles
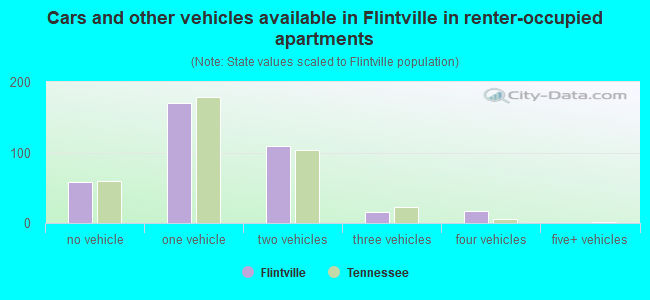
- Cars and other vehicles available in Flintville in renter-occupied apartments
- 58no vehicle
- 1701 vehicle
- 1092 vehicles
- 153 vehicles
- 174 vehicles
- 05+ vehicles
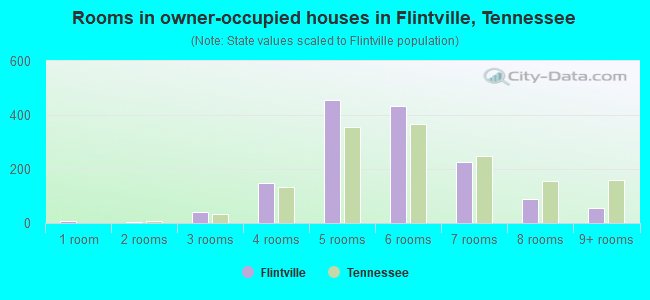
- Rooms in owner-occupied houses in Flintville, Tennessee
- 61 room
- 52 rooms
- 413 rooms
- 1484 rooms
- 4575 rooms
- 4356 rooms
- 2267 rooms
- 888 rooms
- 579+ rooms
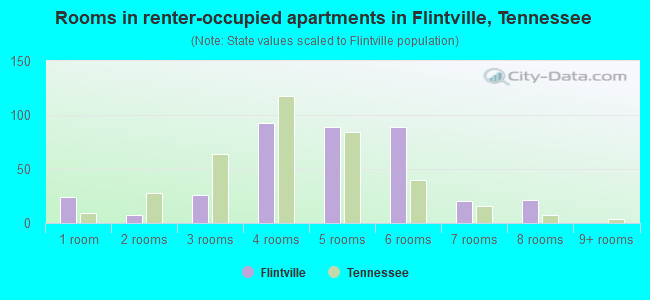
- Rooms in renter-occupied apartments in Flintville, Tennessee
- 241 room
- 72 rooms
- 263 rooms
- 934 rooms
- 895 rooms
- 896 rooms
- 207 rooms
- 218 rooms
- 09+ rooms
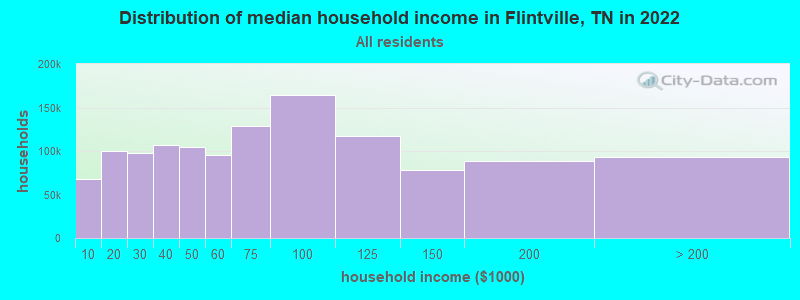
Flintville, TN household income distribution

- 44,623Less than $10,000
- 74,845$10,000 to $19,999
- 70,981$20,000 to $29,999
- 72,576$30,000 to $39,999
- 70,171$40,000 to $49,999
- 64,949$50,000 to $59,999
- 88,551$60,000 to $74,999
- 112,869$75,000 to $99,999
- 84,413$100,000 to $124,999
- 50,280$125,000 to $149,999
- 55,187$150,000 to $199,999
- 46,653$200,000 or more
Percentage of workers working in this county: 58.9%
Number of people working at home: 226 (9.8% of all workers)
Travel time to work (commute)
- Less than 5 minutes: 80
- 5 to 9 minutes: 135
- 10 to 14 minutes: 137
- 15 to 19 minutes: 148
- 20 to 24 minutes: 381
- 25 to 29 minutes: 93
- 30 to 34 minutes: 323
- 35 to 39 minutes: 41
- 40 to 44 minutes: 77
- 45 to 59 minutes: 338
- 60 to 89 minutes: 143
- 90 or more minutes: 102
Means of transportation to work:
- Drove a car alone: 1,507 (73.0%)
- Carpooled: 416 (20.2%)
- Bus or trolley bus: 25 (1.2%)
- Walked: 22 (1.1%)
- Other means: 28 (1.4%)
- Worked at home: 65 (3.2%)
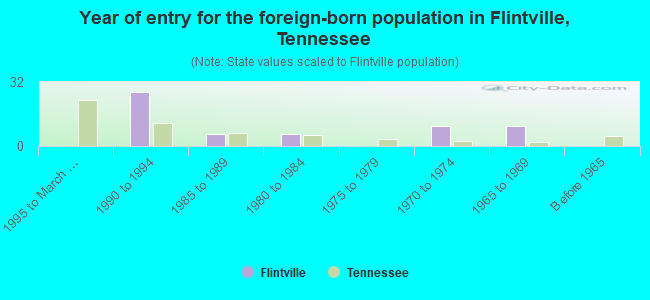
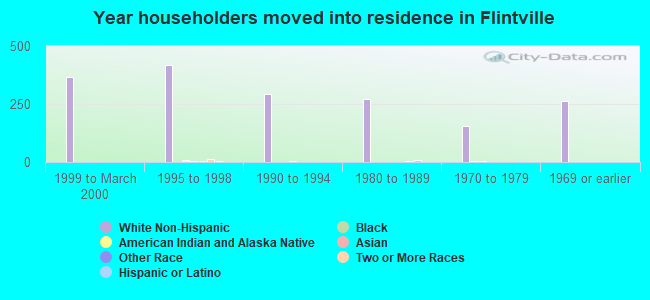
- Year of entry for the foreign-born population in Flintville, Tennessee
- 01995 to March 2000
- 271990 to 1994
- 61985 to 1989
- 61980 to 1984
- 01975 to 1979
- 101970 to 1974
- 101965 to 1969
- 0Before 1965
Most common places of birth for foreign-born residents (%):
| Flintville: | 55.9% (33) |
| Tennessee: | 3.8% (6,106) |
| Flintville: | 16.9% (10) |
| Tennessee: | 0.9% (1,381) |
| Flintville: | 10.2% (6) |
| Tennessee: | 0.3% (519) |
| Flintville: | 10.2% (6) |
| Tennessee: | 0.3% (465) |
| Flintville: | 6.8% (4) |
| Tennessee: | 1.1% (1,721) |
Place of birth for U.S.-born residents:
- This state: 2,589
- Other state: 2,038
- Northeast: 70
- Midwest: 366
- South: 1,558
- West: 44
55% of Flintville residents lived in the same house 5 years ago.
Out of people who lived in different houses, 62% lived in this county.
Out of people who lived in different counties, 28% lived in Tennessee.
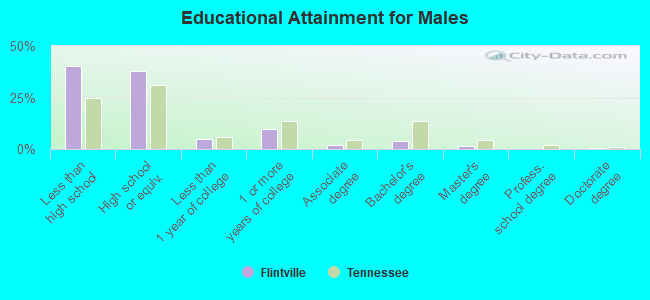
Education attainment for males 25 years and older:
- No schooling: 11
- Nursery to 4th grade: 36
- 5th and 6th grade: 61
- 7th and 8th grade: 150
- 9th grade: 45
- 10th grade: 107
- 11th grade: 113
- 12th grade, no diploma: 96
- High school graduate (or equivalency): 581
- Less than 1 year of college: 74
- Some college more than 1 year, no degree: 150
- Associate degree: 32
- Bachelor's degree: 58
- Master's degree: 22
- Professional school degree: 0
- Doctorate degree: 7
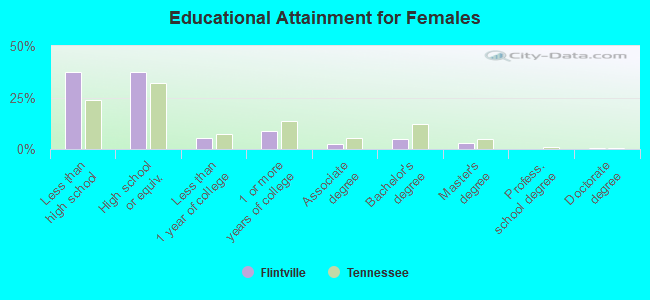
Education attainment for females 25 years and older:
- No schooling: 13
- Nursery to 4th grade: 0
- 5th and 6th grade: 64
- 7th and 8th grade: 125
- 9th grade: 110
- 10th grade: 125
- 11th grade: 100
- 12th grade, no diploma: 71
- High school graduate (or equivalency): 605
- Less than 1 year of college: 88
- Some college more than 1 year, no degree: 145
- Associate degree: 41
- Bachelor's degree: 76
- Master's degree: 47
- Professional school degree: 0
- Doctorate degree: 6
Housing units in structures:
- One, detached: 1,388
- One, attached: 41
- Two: 12
- Mobile homes: 637
- Boats, RVs, vans, etc.: 8
Median worth of mobile homes: $85,009
Housing units lacking complete kitchen facilities: 1.8%
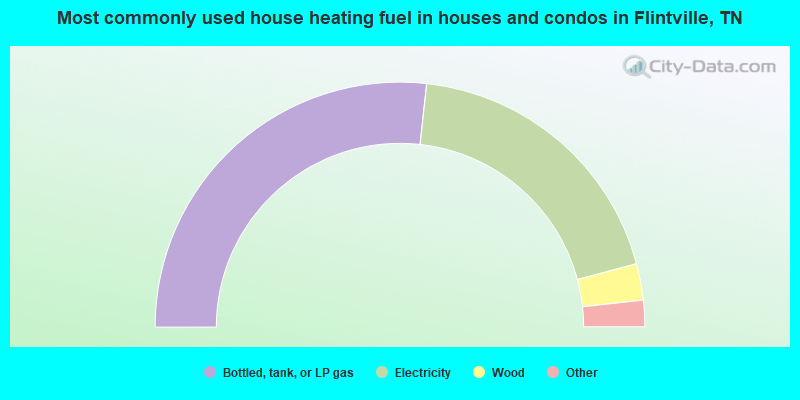
- 53.5%Bottled, tank, or LP gas
- 38.2%Electricity
- 4.8%Wood
- 2.7%Utility gas
- 0.8%Fuel oil, kerosene, etc.
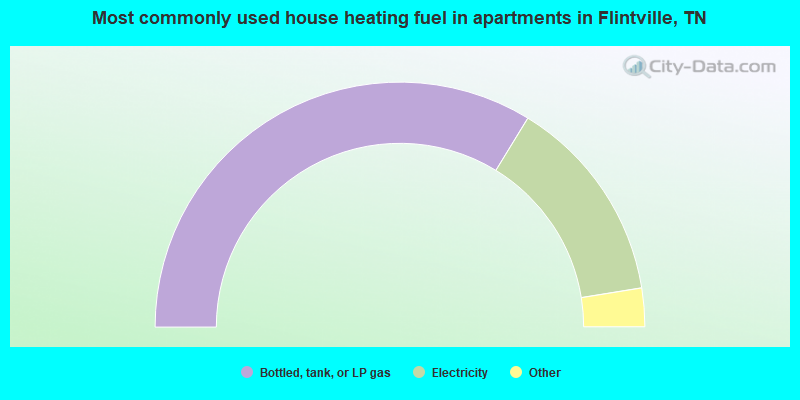
- 67.5%Bottled, tank, or LP gas
- 27.4%Electricity
- 1.9%Wood
- 1.6%Utility gas
- 1.6%Fuel oil, kerosene, etc.
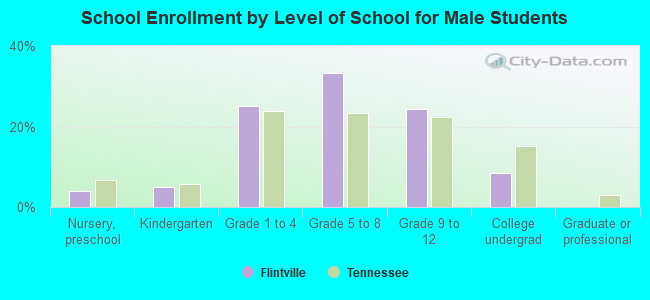
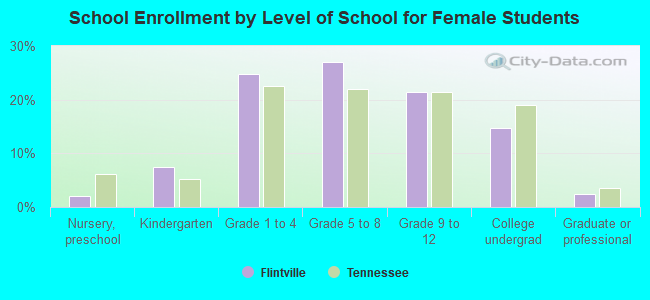
Private vs. public school enrollment:
| Here: | 1.0% |
| Tennessee: | 9.5% |
| Here: | 3.3% |
| Tennessee: | 10.4% |
| Here: | 11.9% |
| Tennessee: | 22.8% |