Flying Hills, PA (Pennsylvania) Houses and Residents
| Flying Hills: | $250,509 |
| Pennsylvania: | $245,500 |
Total population: 2,568 (Urban population: 1,186, Rural population: 0)
Houses: 1,113 (1,033 occupied: 513 owner occupied, 520 renter occupied)
| % of renters here: | 50% |
| State: | 31% |
Housing density: 3,633 houses/condos per square mile
Median price asked for vacant for-sale houses and condos in 2022 in this county: $196,460.
Median contract rent in 2022: $1,232 (lower quartile is $1,060, upper quartile is $1,384)
Median rent asked for vacant for-rent units in 2022: $1,163
Median gross rent in Flying Hills, PA in 2022: $1,368
Housing units in Flying Hills with a mortgage: 335 (23 second mortgage, 0 home equity loan, 24 both second mortgage and home equity loan)
Houses without a mortgage: 61
Median household income for houses/condos with a mortgage: $81,453
Median household income for apartments without a mortgage: $161,664
Median monthly housing costs: $1,314
Compare current foreclosures near Flying Hills, PA:
| Photo | Address | Area | Beds / Baths | Price | Details |
|---|---|---|---|---|---|

|
#1
Mulberry St
Reading, PA 19604
|
1,064 sq. feet
|
1 baths 3 beds |
$7,746
|
show details |

|
#2
E Main St
Birdsboro, PA 19508
|
1,207 sq. feet
|
1 baths 3 beds |
$85,456
|
show details |

|
#3
Cupola Rd
Honey Brook, PA 19344
|
2,112 sq. feet
|
1 baths 4 beds |
$165,679
|
show details |

|
#4
Pine St
Honey Brook, PA 19344
|
1,232 sq. feet
|
1 baths 3 beds |
$88,729
|
show details |

|
#5
Grandview Blvd
Reading, PA 19609
|
2,394 sq. feet
|
2 baths 4 beds |
$329,679
|
show details |

|
#6
Cedar St
Reading, PA 19601
|
1,034 sq. feet
|
1 baths 3 beds |
$58,442
|
show details |

|
#7
Denton Dr
Glenmoore, PA 19343
|
1,590 sq. feet
|
1 baths 3 beds |
$34,159
|
show details |

|
#8
Finney Rd
Glenmoore, PA 19343
|
1,392 sq. feet
|
1 baths 2 beds |
$81,747
|
show details |

|
#9
N Penn St
Pottstown, PA 19464
|
1,872 sq. feet
|
2 baths 4 beds |
show details | |

|
#10
Penns Ln
Douglassville, PA 19518
|
2,018 sq. feet
|
2 baths 4 beds |
show details |
| Photo | Address | Area | Beds / Baths | Price | Details |
|---|---|---|---|---|---|

|
#11
Glen Tilt Ave
Wernersville, PA 19565
|
1,656 sq. feet
|
1 baths 3 beds |
show details | |

|
#12
Muhlenberg St
Reading, PA 19602
|
1,558 sq. feet
|
1 baths 4 beds |
show details | |

|
#13
Margaret St
Reading, PA 19611
|
1,332 sq. feet
|
1 baths 3 beds |
show details | |

|
#14
Fairview Ave
Reading, PA 19606
|
2,042 sq. feet
|
2 baths 4 beds |
show details | |

|
#15
S Walnut St
Birdsboro, PA 19508
|
1,002 sq. feet
|
1 baths 2 beds |
show details | |

|
#16
W Broad St
Reading, PA 19607
|
1,620 sq. feet
|
1 baths 4 beds |
show details | |

|
#17
Grant St
Pottstown, PA 19464
|
1,296 sq. feet
|
1 baths 3 beds |
show details | |

|
#18
West St
Pottstown, PA 19464
|
1,044 sq. feet
|
1 baths 2 beds |
show details | |

|
#19
Quarry Rd
Honey Brook, PA 19344
|
1,760 sq. feet
|
1 baths 2 beds |
show details | |

|
#20
Frush Valley Rd
Reading, PA 19605
|
1,040 sq. feet
|
1 baths 3 beds |
show details |
| Photo | Address | Area | Beds / Baths | Price | Details |
|---|---|---|---|---|---|

|
#21
Pear St
Reading, PA 19601
|
1,573 sq. feet
|
1 baths 3 beds |
show details | |

|
#22
W 2nd St
Birdsboro, PA 19508
|
1,176 sq. feet
|
1 baths 3 beds |
show details | |

|
#23
Montgomery Ave
New Berlinville, PA 19545
|
1,768 sq. feet
|
2 baths 3 beds |
show details | |

|
#24
Kindt Corner Rd
Leesport, PA 19533
|
1,190 sq. feet
|
2 baths 3 beds |
show details | |

|
#25
Linden St
Reading, PA 19604
|
1,164 sq. feet
|
1 baths 3 beds |
show details | |

|
#26
Dauphin Ave
Reading, PA 19610
|
2,072 sq. feet
|
1 baths 4 beds |
show details | |

|
#27
S Kelly Dr
Birdsboro, PA 19508
|
1,820 sq. feet
|
2 baths 4 beds |
show details | |

|
#28
Grandview Cir
Honey Brook, PA 19344
|
1,142 sq. feet
|
2 baths 3 beds |
show details | |

|
#29
Penndale Ave
Reading, PA 19606
|
1,864 sq. feet
|
1 baths 4 beds |
show details | |

|
#30
N Front St
Reading, PA 19601
|
1,897 sq. feet
|
2 baths 4 beds |
show details |
| Photo | Address | Area | Beds / Baths | Price | Details |
|---|---|---|---|---|---|

|
#31
Reading Ave
Boyertown, PA 19512
|
1,634 sq. feet
|
1 baths 2 beds |
show details | |

|
#32
N 10th St
Reading, PA 19604
|
1,925 sq. feet
|
2 baths 5 beds |
show details | |

|
#33
Chapel Hill Rd
Reading, PA 19608
|
1,356 sq. feet
|
1 baths 3 beds |
show details | |

|
#34
Curtis Rd
Reading, PA 19608
|
2,142 sq. feet
|
1 baths 4 beds |
show details | |

|
#35
Gregg Ave
Reading, PA 19607
|
1,040 sq. feet
|
1 baths 3 beds |
show details | |

|
#36
Hill Rd
Honey Brook, PA 19344
|
1,456 sq. feet
|
2 baths 3 beds |
show details | |

|
#37
Benjamin Franklin Hw
Douglassville, PA 19518
|
1,734 sq. feet
|
2 baths 4 beds |
show details | |

|
#38
Commonwealth Blvd
Reading, PA 19607
|
2,709 sq. feet
|
2 baths 4 beds |
show details | |

|
#39
Willow Brook Ln
Pottstown, PA 19464
|
1,566 sq. feet
|
2 baths 3 beds |
show details | |

|
#40
Ringing Rocks Park
Pottstown, PA 19464
|
1,000 sq. feet
|
1 baths 3 beds |
show details |
| Photo | Address | Area | Beds / Baths | Price | Details |
|---|---|---|---|---|---|

|
#41
Marshall Rd
Glenmoore, PA 19343
|
905 sq. feet
|
1 baths 2 beds |
show details | |

|
#42
S Custer Ave
New Holland, PA 17557
|
3,503 sq. feet
|
2 baths 4 beds |
show details | |

|
#43
New Holland Rd
Reading, PA 19607
|
1,352 sq. feet
|
1 baths 3 beds |
show details | |

|
#44
Hazel St
Reading, PA 19611
|
1,076 sq. feet
|
1 baths 3 beds |
show details | |

|
#45
Fox Ridge Rd
Glenmoore, PA 19343
|
2,914 sq. feet
|
2 baths 4 beds |
show details | |

|
#46
Club Rd
Oley, PA 19547
|
3,437 sq. feet
|
2 baths 3 beds |
show details | |

|
#47
Girard Ave
Reading, PA 19605
|
1,309 sq. feet
|
1 baths 3 beds |
show details | |

|
#48
Shalter Ave
Temple, PA 19560
|
1,452 sq. feet
|
1 baths 3 beds |
show details | |

|
#49
N 6th St
Denver, PA 17517
|
1,260 sq. feet
|
1 baths 2 beds |
show details | |

|
Check over 1 million property listings on Foreclosure.com!
|
browse all offers | |||


 | Moving to Reading (21 replies) |
| New Nurse relocating from NJ to PA for a Job @ Reading (22 replies) |
| Where Should We Look in SE or Central PA? (14 replies) |
| Relocating to the Reading area.Need as much info as possible. (2 replies) |
| Relocating to Philly/Reading PA- Which area should we focus on? (3 replies) |
| Downingtown to Lancaster commute (9 replies) |
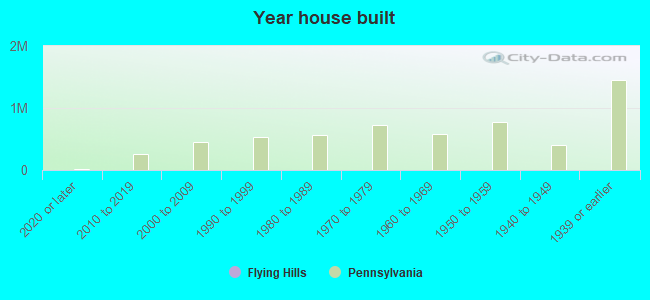
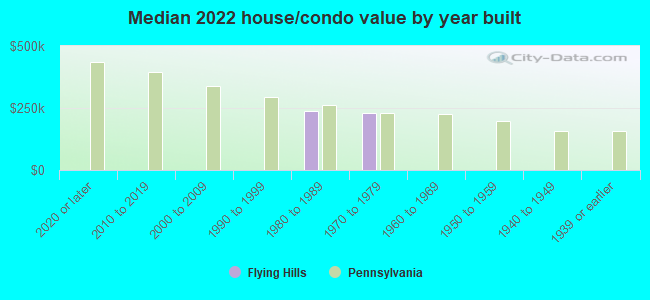
Median year apartment built: 1980
Household type by relationship:
Households: 1,723- Male householders: 617 (294 living alone), Female householders: 413 (245 living alone)
294 spouses (294 opposite-sex spouses), 123 unmarried partners, (123 opposite-sex unmarried partners), 160 children (160 natural, 0 adopted, 0 stepchildren), 0 grandchildren, 0 brothers or sisters, 0 parents, 0 foster children, 0 other relatives, 113 non-relatives
Size of family households: 268 2-persons, 52 3-persons, 30 4-persons, 17 5-persons.
Size of nonfamily households: 537 1-person, 79 2-persons, 55 4-persons.
89 married couples with children.
63 single-parent households (53 men, 10 women).
84.2% of residents of Flying Hills speak English at home.
9.4% of residents speak Spanish at home (100% speak English very well).
4.6% of residents speak other Indo-European language at home (100% speak English very well).
0.6% of residents speak other language at home (100% speak English very well).
Foreign born population: 118 (6.8%)
(47.5% of them are naturalized citizens)
| Here: | 6.9 |
| State: | 6.8 |
| Here: | 4.9 |
| State: | 4.3 |
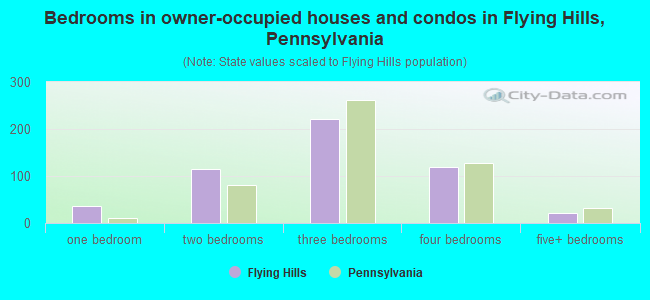
- Bedrooms in owner-occupied houses and condos in Flying Hills, Pennsylvania
- 0no bedroom
- 361 bedroom
- 1152 bedrooms
- 2213 bedrooms
- 1194 bedrooms
- 225+ bedrooms
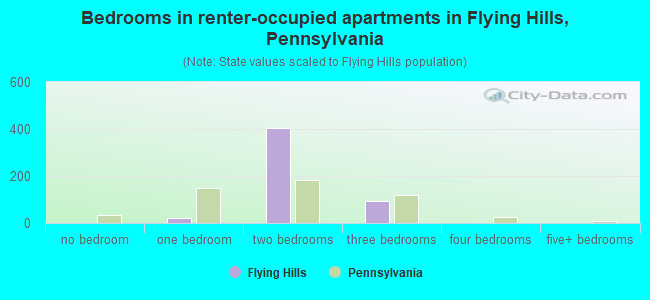
- Bedrooms in renter-occupied apartments in Flying Hills, Pennsylvania
- 0no bedroom
- 231 bedroom
- 4032 bedrooms
- 953 bedrooms
- 04 bedrooms
- 05+ bedrooms
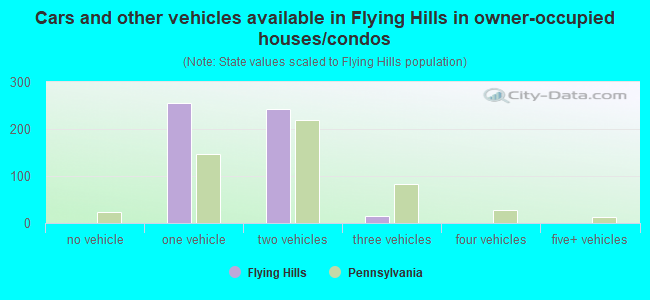
- Cars and other vehicles available in Flying Hills in owner-occupied houses/condos
- 0no vehicle
- 2561 vehicle
- 2432 vehicles
- 153 vehicles
- 04 vehicles
- 05+ vehicles
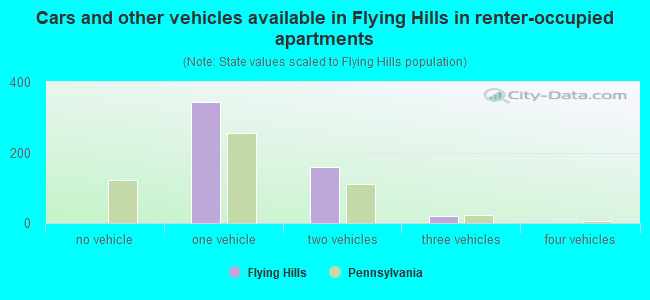
- Cars and other vehicles available in Flying Hills in renter-occupied apartments
- 1no vehicle
- 3421 vehicle
- 1582 vehicles
- 193 vehicles
- 04 vehicles
- 05+ vehicles
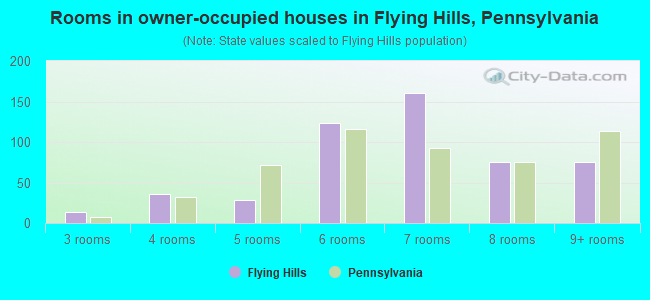
- Rooms in owner-occupied houses in Flying Hills, Pennsylvania
- 01 room
- 02 rooms
- 133 rooms
- 364 rooms
- 295 rooms
- 1236 rooms
- 1617 rooms
- 758 rooms
- 759+ rooms
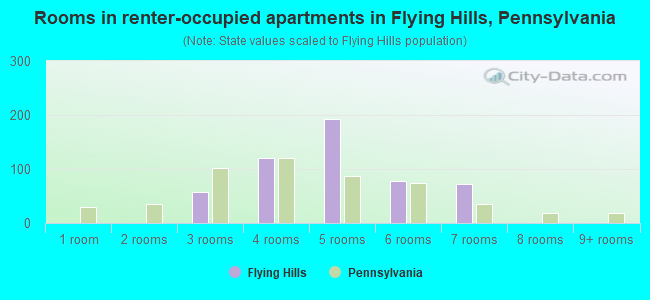
- Rooms in renter-occupied apartments in Flying Hills, Pennsylvania
- 01 room
- 02 rooms
- 573 rooms
- 1204 rooms
- 1925 rooms
- 786 rooms
- 727 rooms
- 08 rooms
- 09+ rooms
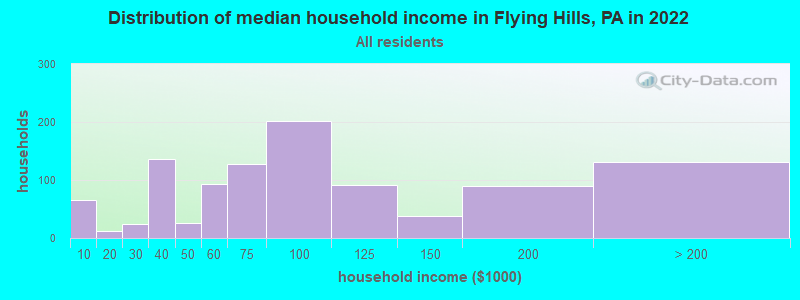
Flying Hills, PA household income distribution

- 65Less than $10,000
- 12$10,000 to $19,999
- 25$20,000 to $29,999
- 137$30,000 to $39,999
- 26$40,000 to $49,999
- 93$50,000 to $59,999
- 127$60,000 to $74,999
- 201$75,000 to $99,999
- 92$100,000 to $124,999
- 38$125,000 to $149,999
- 89$150,000 to $199,999
- 131$200,000 or more
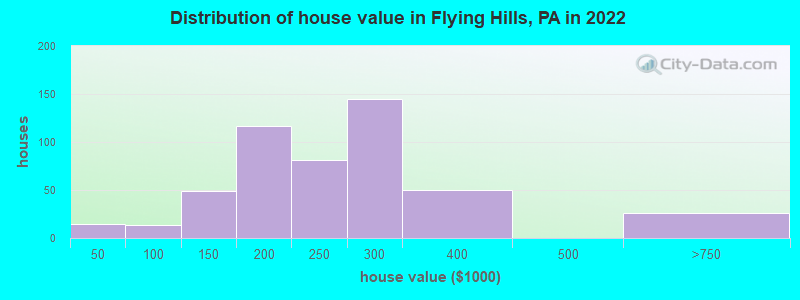
Home value of owner - occupied houses in 2022 in Flying Hills, PA
-
- 14Less than $10,000
- 14$60,000 to $69,999
- 25$100,000 to $124,999
- 23$125,000 to $149,999
- 63$150,000 to $174,999
- 53$175,000 to $199,999
- 81$200,000 to $249,999
- 145$250,000 to $299,999
- 49$300,000 to $399,999
- 25$500,000 to $749,999
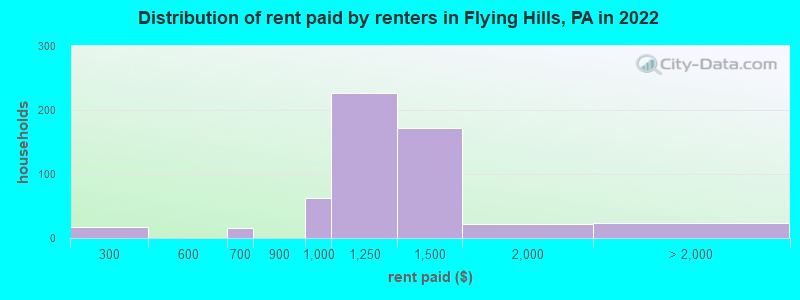
Rent paid by renters in 2022 in Flying Hills, PA
-
- 16$200 to $249
- 15$650 to $699
- 62$900 to $999
- 226$1,000 to $1,249
- 171$1,250 to $1,499
- 22$1,500 to $1,999
- 23No cash rent
Percentage of workers working in this county: 82.3%
Number of people working at home: 82 (8.1% of all workers)
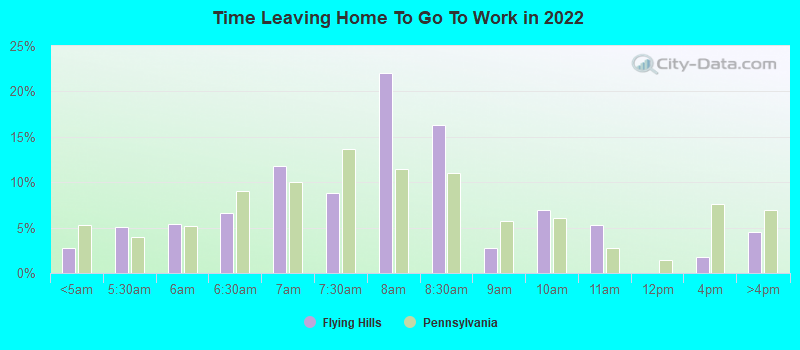
Travel time to work (commute)
- Less than 5 minutes: 11
- 5 to 9 minutes: 35
- 10 to 14 minutes: 122
- 15 to 19 minutes: 241
- 20 to 24 minutes: 137
- 25 to 29 minutes: 35
- 30 to 34 minutes: 105
- 35 to 39 minutes: 22
- 40 to 44 minutes: 0
- 45 to 59 minutes: 142
- 60 to 89 minutes: 33
- 90 or more minutes: 18
Means of transportation to work:
- Drove a car alone: 667 (85.5%)
- Carpooled: 76 (9.7%)
- Walked: 7 (0.9%)
- Worked at home: 30 (3.8%)
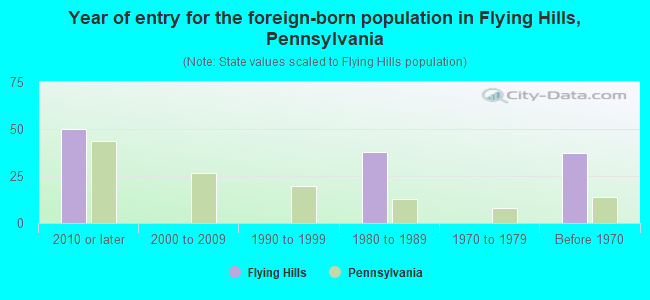
- Year of entry for the foreign-born population in Flying Hills, Pennsylvania
- 502010 or later
- 02000 to 2009
- 01990 to 1999
- 381980 to 1989
- 01970 to 1979
- 37Before 1970
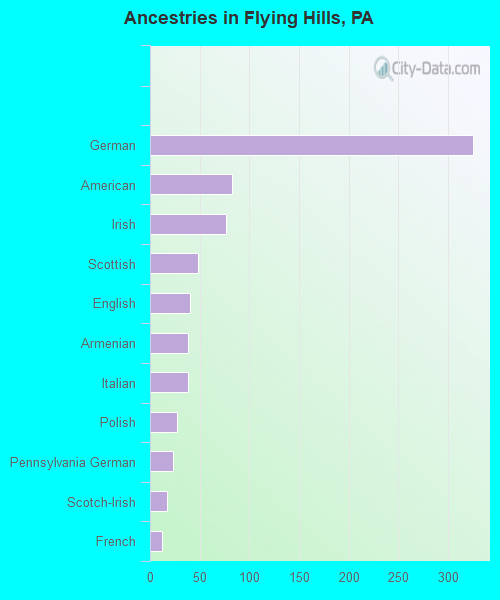
First ancestries reported:
- German: 325 (32.8%)
- American: 83 (8.4%)
- Irish: 77 (7.8%)
- Scottish: 48 (4.8%)
- English: 40 (4.0%)
- Armenian: 38 (3.8%)
- Italian: 38 (3.8%)
- Polish: 27 (2.7%)
- Pennsylvania German: 23 (2.3%)
- Scotch-Irish: 17 (1.7%)
- French: 12 (1.2%)
Most common places of birth for foreign-born residents (%):
| Flying Hills: | 40.0% (44) |
| Pennsylvania: | 2.1% (19,841) |
| Flying Hills: | 29.1% (32) |
| Pennsylvania: | 0.4% (4,113) |
| Flying Hills: | 8.2% (9) |
| Pennsylvania: | 1.9% (18,065) |
| Flying Hills: | 8.2% (9) |
| Pennsylvania: | 1.8% (16,884) |
Place of birth for U.S.-born residents:
- This state: 1,226
- Other state: 362
- Northeast: 185
- Midwest: 51
- South: 84
- West: 35
90.8% of Flying Hills residents lived in the same house 1 years ago.
Out of people who lived in different houses, 33.3% lived in this county.
Out of people who lived in different counties, 77.1% lived in Pennsylvania.
| Flying Hills: | 90.8% |
| State average: | 89.3% |
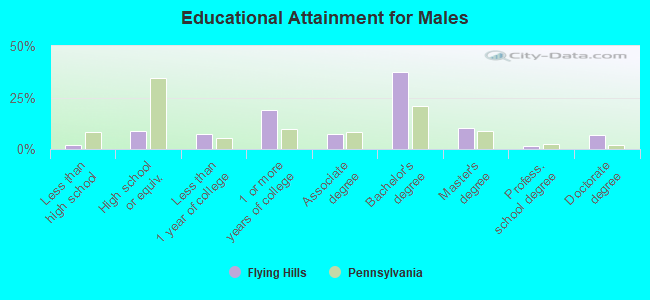
Education attainment for males 25 years and older:
- No schooling: 0
- Nursery to 4th grade: 0
- 5th and 6th grade: 0
- 7th and 8th grade: 0
- 9th grade: 0
- 10th grade: 12
- 11th grade: 4
- 12th grade, no diploma: 0
- High school graduate (or equivalency): 67
- Less than 1 year of college: 54
- Some college more than 1 year, no degree: 144
- Associate degree: 56
- Bachelor's degree: 288
- Master's degree: 77
- Professional school degree: 12
- Doctorate degree: 52
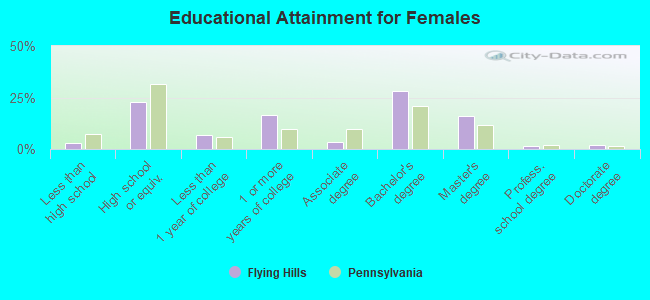
Education attainment for females 25 years and older:
- No schooling: 0
- Nursery to 4th grade: 0
- 5th and 6th grade: 0
- 7th and 8th grade: 0
- 9th grade: 0
- 10th grade: 10
- 11th grade: 0
- 12th grade, no diploma: 10
- High school graduate (or equivalency): 157
- Less than 1 year of college: 47
- Some college more than 1 year, no degree: 112
- Associate degree: 22
- Bachelor's degree: 195
- Master's degree: 110
- Professional school degree: 9
- Doctorate degree: 15
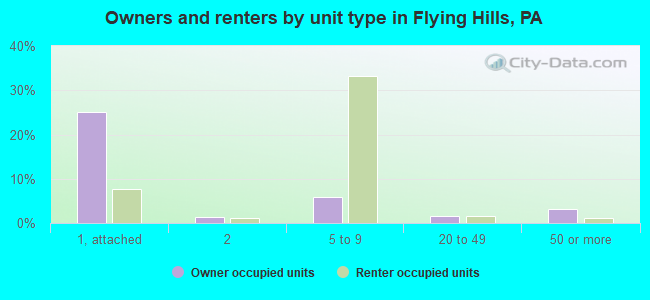
Housing units in structures:
- One, detached: 177
- One, attached: 434
- Two: 25
- 3 or 4: 53
- 5 to 9: 352
- 10 to 19: 7
- 20 to 49: 29
- 50 or more: 35
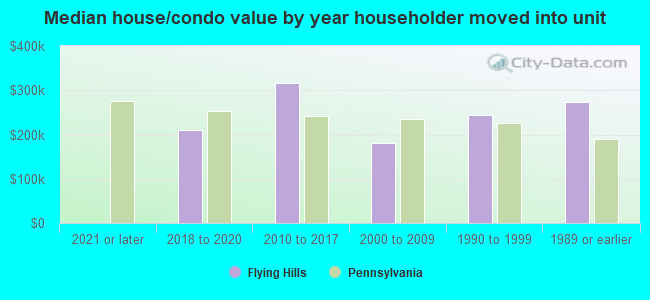
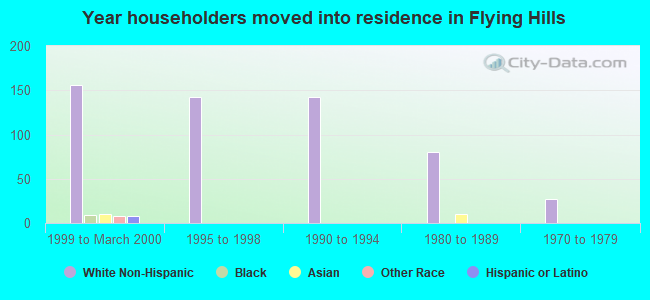
House/condo owner moved in on average 8 years ago
Renter moved in on average 5 years ago
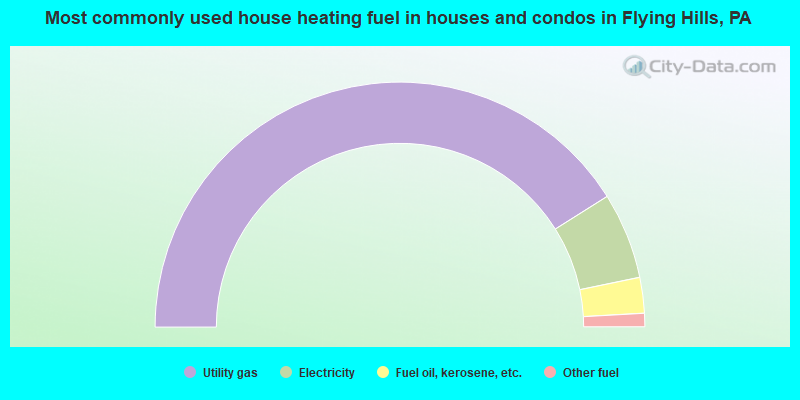
- 82.2%Utility gas
- 11.4%Electricity
- 4.7%Fuel oil, kerosene, etc.
- 1.8%Other fuel
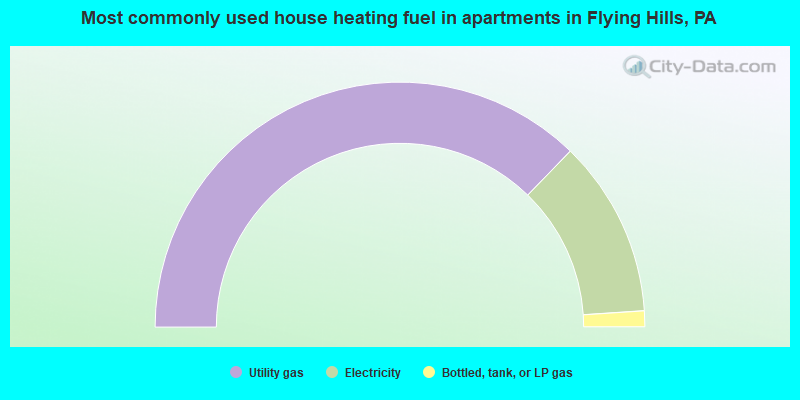
- 74.5%Utility gas
- 23.4%Electricity
- 2.1%Bottled, tank, or LP gas
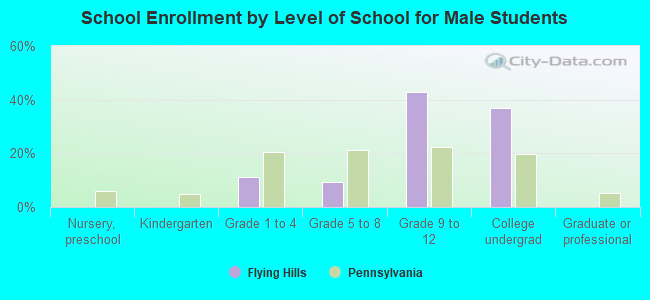
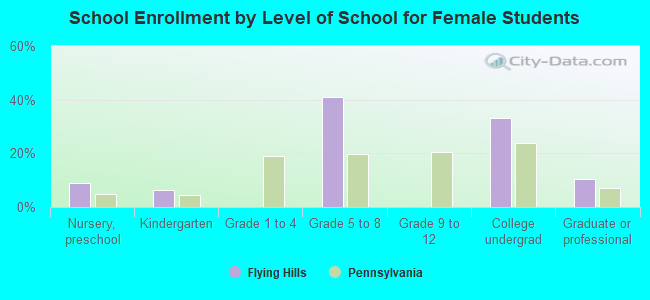
Private vs. public school enrollment:
| Here: | 0.0% |
| Pennsylvania: | 15.7% |
| Here: | 0.0% |
| Pennsylvania: | 13.4% |
| Here: | 0.0% |
| Pennsylvania: | 39.8% |