Fort Benning, GA (Georgia) Houses and Residents
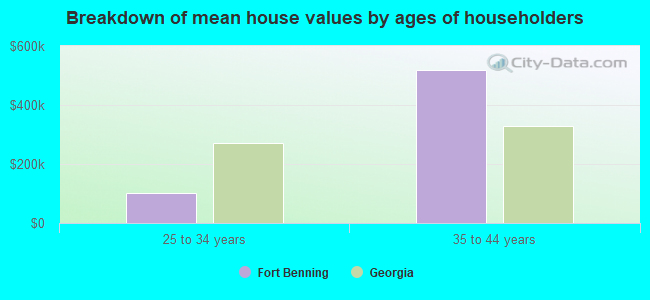
| Fort Benning: | $178,441 |
| Georgia: | $297,400 |
Total population: 11,177 (All urban)
Houses: 2,053 (1,872 occupied: 69 owner occupied, 1,803 renter occupied)
| % of renters here: | 96% |
| State: | 34% |
Housing density: 11 houses/condos per square mile
Median price asked for vacant for-sale houses and condos in 2022 in this county: $322,090.
Median contract rent in 2022: $1,499 (lower quartile is $1,885, upper quartile is $1,657)
Median rent asked for vacant for-rent units in 2022: $1,426
Median gross rent in Fort Benning, GA in 2022: $1,492
Housing units in Fort Benning with a mortgage: 12 (0 second mortgage, 0 home equity loan, 0 both second mortgage and home equity loan)
Houses without a mortgage: 14
Compare current foreclosures near Fort Benning, GA:
| Photo | Address | Area | Beds / Baths | Price | Details |
|---|---|---|---|---|---|

|
#1
Arrowhead Rd
Fort Benning, GA 31905
|
- sq. feet
|
- baths - beds |
show details | |

|
#2
Strike Swiftly Loop
Fort Benning, GA 31905
|
- sq. feet
|
- baths - beds |
show details | |

|
#3
Kessler Dr
Fort Benning, GA 31905
|
- sq. feet
|
- baths - beds |
show details | |

|
#4
Old Ironsides Loop
Fort Benning, GA 31905
|
- sq. feet
|
- baths - beds |
show details | |

|
#5
Arrowhead Rd Apt A
Fort Benning, GA 31905
|
- sq. feet
|
- baths - beds |
show details | |

|
#6
Arracourt Way
Fort Benning, GA 31905
|
- sq. feet
|
- baths - beds |
show details | |

|
#7
Desoto Dr
Columbus, GA 31909
|
1,092 sq. feet
|
1 baths 3 beds |
$190,000
|
show details |

|
#8
Walker St
Columbus, GA 31903
|
1,288 sq. feet
|
1 baths 3 beds |
$145,000
|
show details |

|
#9
Flournoy Dr
Columbus, GA 31906
|
- sq. feet
|
2 baths 3 beds |
$134,900
|
show details |

|
#10
Charter Oaks Cir
Columbus, GA 31909
|
- sq. feet
|
2 baths 3 beds |
$124,800
|
show details |
| Photo | Address | Area | Beds / Baths | Price | Details |
|---|---|---|---|---|---|

|
#11
17th Ave
Columbus, GA 31904
|
- sq. feet
|
2 baths 3 beds |
$64,900
|
show details |

|
#12
Kessington Dr
Columbus, GA 31907
|
2,818 sq. feet
|
3 baths 4 beds |
show details | |

|
#13
Winifred Ln
Columbus, GA 31907
|
- sq. feet
|
2 baths 3 beds |
show details | |

|
#14
Woodlawn Ave
Columbus, GA 31904
|
1,486 sq. feet
|
2 baths 3 beds |
show details | |

|
#15
Ellen Ave
Columbus, GA 31903
|
2,625 sq. feet
|
3 baths 5 beds |
show details | |

|
#16
Dozier St
Columbus, GA 31904
|
1,465 sq. feet
|
2 baths 2 beds |
show details | |

|
#17
10th St
Columbus, GA 31906
|
1,404 sq. feet
|
2 baths 3 beds |
show details | |

|
#18
4th Ave
Phenix City, AL 36867
|
1,416 sq. feet
|
1 baths 3 beds |
show details | |

|
#19
24th St
Phenix City, AL 36867
|
- sq. feet
|
2 baths 2 beds |
show details | |

|
#20
11th Ave
Columbus, GA 31904
|
1,344 sq. feet
|
1 baths 4 beds |
show details |
| Photo | Address | Area | Beds / Baths | Price | Details |
|---|---|---|---|---|---|

|
#21
Summerville Rd
Phenix City, AL 36867
|
2,843 sq. feet
|
2 baths 4 beds |
show details | |

|
#22
Luckie St
Columbus, GA 31903
|
- sq. feet
|
2 baths 3 beds |
show details | |

|
#23
Colony Dr
Columbus, GA 31909
|
1,056 sq. feet
|
2 baths 3 beds |
show details | |

|
#24
Woodruff Rd
Columbus, GA 31904
|
1,968 sq. feet
|
2 baths 3 beds |
show details | |

|
#25
Paul Stephens Rd
Richland, GA 31825
|
980 sq. feet
|
2 baths 2 beds |
show details | |

|
#26
6th Pl
Phenix City, AL 36869
|
1,200 sq. feet
|
2 baths - beds |
show details | |

|
#27
Honeysuckle Way
Fort Mitchell, AL 36856
|
1,884 sq. feet
|
2 baths - beds |
show details | |

|
#28
Seminole Rd
Richland, GA 31825
|
841 sq. feet
|
3 baths 3 beds |
show details | |

|
#29
Owens Rd
Fort Mitchell, AL 36856
|
1,603 sq. feet
|
2 baths - beds |
show details | |

|
#30
Georgia Dr
Columbus, GA 31907
|
- sq. feet
|
2 baths 3 beds |
show details |
| Photo | Address | Area | Beds / Baths | Price | Details |
|---|---|---|---|---|---|

|
#31
Liberty Hill Rd
Cusseta, GA 31805
|
2,128 sq. feet
|
2 baths 1 beds |
show details | |

|
#32
Poppy Seed Loop
Columbus, GA 31907
|
- sq. feet
|
2 baths 3 beds |
show details | |

|
#33
Gennings Ct
Columbus, GA 31907
|
- sq. feet
|
2 baths 3 beds |
show details | |

|
#34
10th St
Columbus, GA 31906
|
- sq. feet
|
2 baths 3 beds |
show details | |

|
#35
Pineknot Rd
Box Springs, GA 31801
|
1,056 sq. feet
|
1 baths - beds |
show details | |

|
#36
Ridgecrest Dr
Phenix City, AL 36869
|
1,456 sq. feet
|
- baths - beds |
show details | |

|
#37
17th St Apt 2
Columbus, GA 31901
|
- sq. feet
|
- baths - beds |
show details | |

|
#38
Gibbs Dr
Phenix City, AL 36869
|
- sq. feet
|
- baths - beds |
show details | |

|
#39
Bradley Rd
Fort Mitchell, AL 36856
|
- sq. feet
|
- baths - beds |
show details | |

|
#40
10th Ave S Apt 58b
Phenix City, AL 36869
|
- sq. feet
|
- baths - beds |
show details |
| Photo | Address | Area | Beds / Baths | Price | Details |
|---|---|---|---|---|---|

|
#41
Redwood Dr
Phenix City, AL 36869
|
1,455 sq. feet
|
- baths - beds |
show details | |

|
#42
Nuckols Rd
Phenix City, AL 36869
|
- sq. feet
|
- baths - beds |
show details | |

|
#43
1st Pl
Phenix City, AL 36869
|
- sq. feet
|
- baths - beds |
show details | |

|
#44
Sweetwater Park Dr
Fort Mitchell, AL 36856
|
- sq. feet
|
- baths - beds |
show details | |

|
#45
Admiral Dr
Midland, GA 31820
|
- sq. feet
|
- baths - beds |
show details | |

|
#46
Linwood Blvd Apt D
Columbus, GA 31901
|
- sq. feet
|
- baths - beds |
show details | |

|
#47
20th Ave S
Phenix City, AL 36869
|
1,480 sq. feet
|
- baths - beds |
show details | |

|
#48
Gibbs Dr
Phenix City, AL 36869
|
- sq. feet
|
- baths - beds |
show details | |

|
#49
Palmetto Ave
Columbus, GA 31906
|
- sq. feet
|
- baths - beds |
show details | |

|
Check over 1 million property listings on Foreclosure.com!
|
browse all offers | |||

Household type by relationship:
Households: 8,000- In family households: 7,233 (1,411 male householders, 656 female householders)
1,532 spouses, 3,158 children (2,812 natural, 68 adopted, 278 stepchildren), 159 grandchildren, 55 brothers or sisters, 45 parents, foster children, 78 other relatives, 99 non-relatives
- In nonfamily households: 767 (354 male householders (271 living alone)), 265 female householders (241 living alone)), 148 nonrelatives
- In group quarters: 3,267 (0 institutionalized population)
3,494 married couples with children.
562 single-parent households (122 men, 440 women).
83.7% of residents of Fort Benning speak English at home.
10.2% of residents speak Spanish at home (77% speak English very well, 18% speak English well, 6% speak English not well).
3.9% of residents speak other Indo-European language at home (78% speak English very well, 20% speak English well, 2% speak English not well).
1.9% of residents speak Asian or Pacific Island language at home (70% speak English very well, 30% speak English well).
0.4% of residents speak other language at home (85% speak English very well, 15% speak English well).
Foreign born population: 1,623 (9.8%)
(70.0% of them are naturalized citizens)
| Here: | 4.7 |
| State: | 6.8 |
| Here: | 6.8 |
| State: | 4.6 |
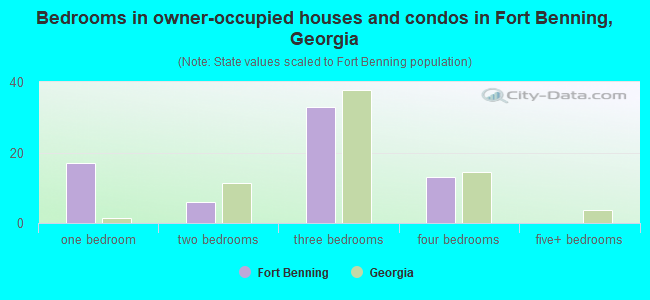
- Bedrooms in owner-occupied houses and condos in Fort Benning, Georgia
- 0no bedroom
- 171 bedroom
- 62 bedrooms
- 333 bedrooms
- 134 bedrooms
- 05+ bedrooms
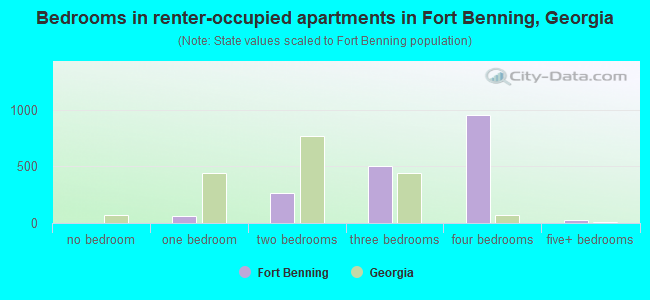
- Bedrooms in renter-occupied apartments in Fort Benning, Georgia
- 0no bedroom
- 591 bedroom
- 2632 bedrooms
- 5023 bedrooms
- 9544 bedrooms
- 255+ bedrooms
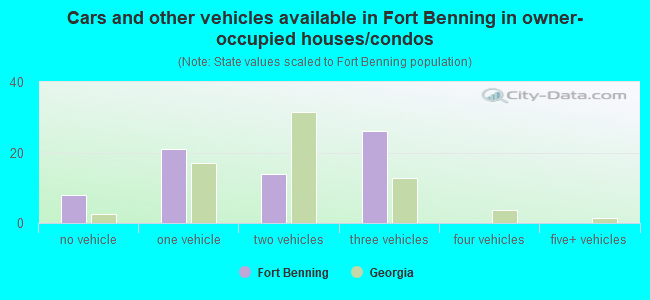
- Cars and other vehicles available in Fort Benning in owner-occupied houses/condos
- 8no vehicle
- 211 vehicle
- 142 vehicles
- 263 vehicles
- 04 vehicles
- 05+ vehicles
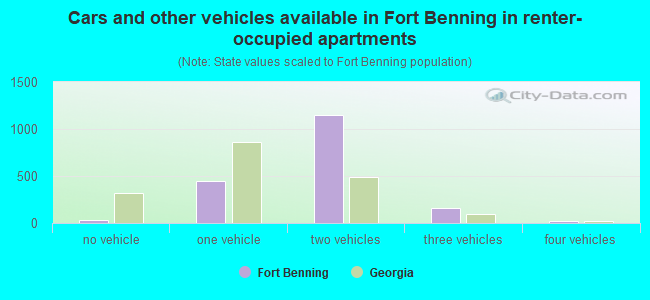
- Cars and other vehicles available in Fort Benning in renter-occupied apartments
- 28no vehicle
- 4451 vehicle
- 1,1472 vehicles
- 1563 vehicles
- 214 vehicles
- 65+ vehicles
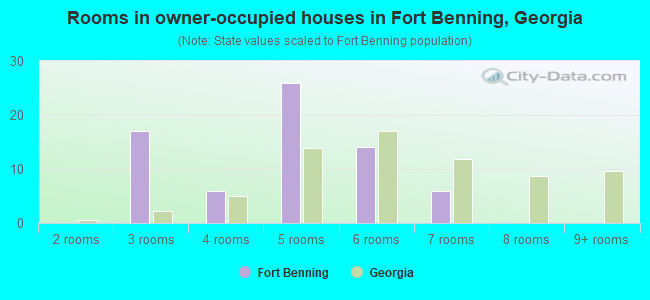
- Rooms in owner-occupied houses in Fort Benning, Georgia
- 01 room
- 02 rooms
- 173 rooms
- 64 rooms
- 265 rooms
- 146 rooms
- 67 rooms
- 08 rooms
- 09+ rooms
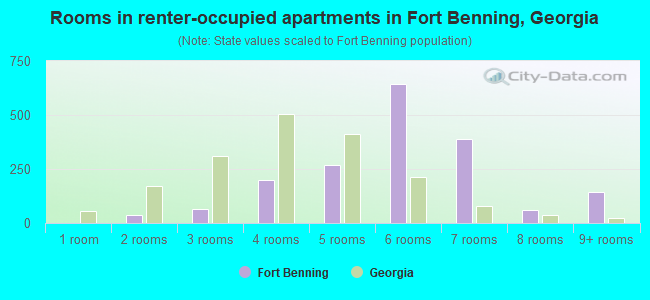
- Rooms in renter-occupied apartments in Fort Benning, Georgia
- 01 room
- 372 rooms
- 643 rooms
- 2014 rooms
- 2675 rooms
- 6456 rooms
- 3877 rooms
- 608 rooms
- 1429+ rooms
Fort Benning, GA household income distribution

- 164,042Less than $10,000
- 187,829$10,000 to $19,999
- 194,676$20,000 to $29,999
- 208,748$30,000 to $39,999
- 210,572$40,000 to $49,999
- 197,966$50,000 to $59,999
- 279,920$60,000 to $74,999
- 374,475$75,000 to $99,999
- 281,703$100,000 to $124,999
- 199,366$125,000 to $149,999
- 241,173$150,000 to $199,999
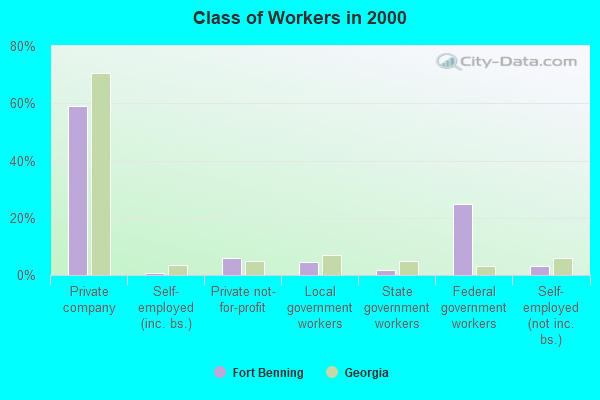
- 320,250$200,000 or more

Percentage of workers working in this county: 74.4%
Number of people working at home: 1,887 (18.1% of all workers)
Travel time to work (commute)
- Less than 5 minutes: 1,438
- 5 to 9 minutes: 1,889
- 10 to 14 minutes: 1,471
- 15 to 19 minutes: 954
- 20 to 24 minutes: 496
- 25 to 29 minutes: 223
- 30 to 34 minutes: 212
- 35 to 39 minutes: 26
- 40 to 44 minutes: 0
- 45 to 59 minutes: 46
- 60 to 89 minutes: 47
- 90 or more minutes: 94
Means of transportation to work:
- Drove a car alone: 3,528 (48.1%)
- Carpooled: 987 (13.4%)
- Bus or trolley bus: 45 (0.6%)
- Motorcycle: 25 (0.3%)
- Bicycle: 17 (0.2%)
- Walked: 2,106 (28.7%)
- Other means: 188 (2.6%)
- Worked at home: 446 (6.1%)
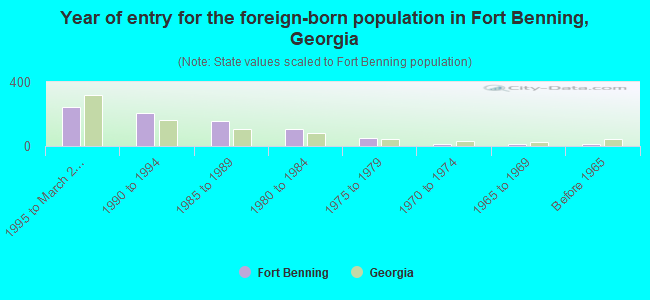
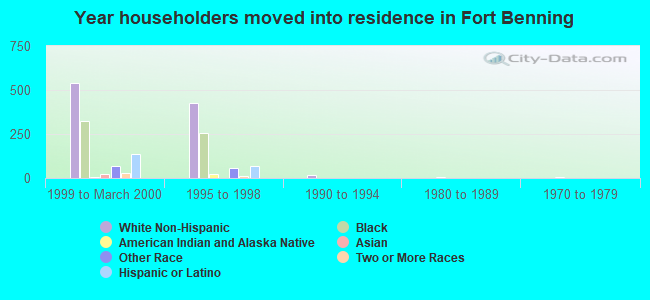
- Year of entry for the foreign-born population in Fort Benning, Georgia
- 2461995 to March 2000
- 2071990 to 1994
- 1591985 to 1989
- 1081980 to 1984
- 501975 to 1979
- 141970 to 1974
- 111965 to 1969
- 11Before 1965
Most common places of birth for foreign-born residents (%):
| Fort Benning: | 16.6% (134) |
| Georgia: | 3.3% (19,039) |
| Fort Benning: | 9.8% (79) |
| Georgia: | 1.5% (8,832) |
| Fort Benning: | 6.9% (56) |
| Georgia: | 4.0% (23,188) |
| Fort Benning: | 6.7% (54) |
| Georgia: | 2.6% (15,057) |
| Fort Benning: | 6.7% (54) |
| Georgia: | 1.7% (10,099) |
| Fort Benning: | 6.5% (52) |
| Georgia: | 33.0% (190,621) |
| Fort Benning: | 5.5% (44) |
| Georgia: | 1.8% (10,584) |
| Fort Benning: | 4.5% (36) |
| Georgia: | 0.7% (4,103) |
| Fort Benning: | 4.3% (35) |
| Georgia: | 0.2% (1,346) |
| Fort Benning: | 4.2% (34) |
| Georgia: | 0.8% (4,626) |
| Fort Benning: | 3.7% (30) |
| Georgia: | 0.5% (2,845) |
| Fort Benning: | 3.3% (27) |
| Georgia: | 2.9% (16,457) |
| Fort Benning: | 2.7% (22) |
| Georgia: | 0.7% (4,299) |
| Fort Benning: | 2.0% (16) |
| Georgia: | 0.5% (2,611) |
| Fort Benning: | 1.7% (14) |
| Georgia: | 1.5% (8,740) |
| Fort Benning: | 1.6% (13) |
| Georgia: | 1.1% (6,408) |
| Fort Benning: | 1.6% (13) |
| Georgia: | 0.9% (4,909) |
Place of birth for U.S.-born residents:
- This state: 1,186
- Other state: 9,190
- Northeast: 1,523
- Midwest: 1,724
- South: 4,216
- West: 1,727
6% of Fort Benning residents lived in the same house 5 years ago.
Out of people who lived in different houses, 3% lived in this county.
Out of people who lived in different counties, 8% lived in Georgia.
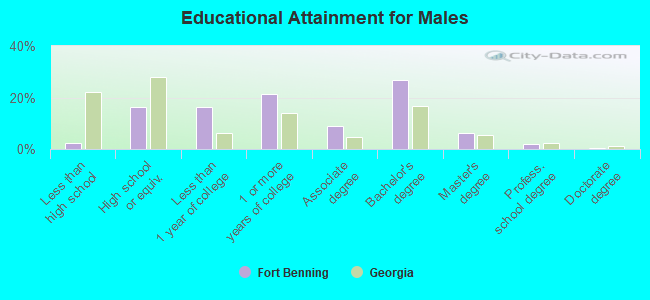
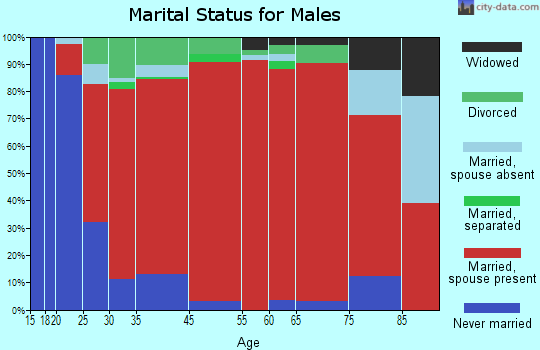
Education attainment for males 25 years and older:
- No schooling: 0
- Nursery to 4th grade: 0
- 5th and 6th grade: 0
- 7th and 8th grade: 0
- 9th grade: 0
- 10th grade: 0
- 11th grade: 7
- 12th grade, no diploma: 56
- High school graduate (or equivalency): 474
- Less than 1 year of college: 482
- Some college more than 1 year, no degree: 625
- Associate degree: 263
- Bachelor's degree: 786
- Master's degree: 179
- Professional school degree: 58
- Doctorate degree: 6
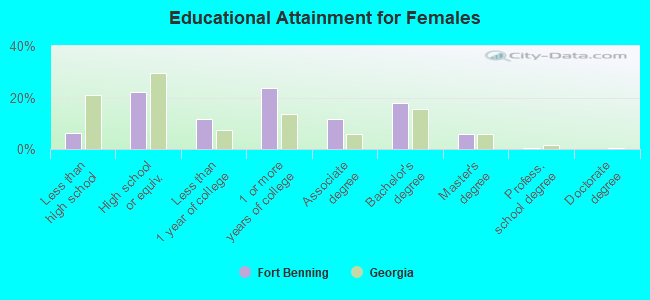
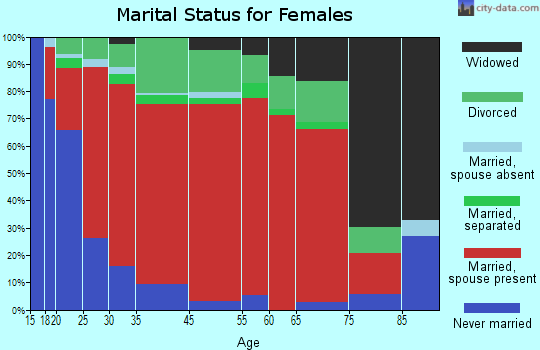
Education attainment for females 25 years and older:
- No schooling: 0
- Nursery to 4th grade: 0
- 5th and 6th grade: 4
- 7th and 8th grade: 15
- 9th grade: 0
- 10th grade: 18
- 11th grade: 43
- 12th grade, no diploma: 29
- High school graduate (or equivalency): 385
- Less than 1 year of college: 199
- Some college more than 1 year, no degree: 412
- Associate degree: 198
- Bachelor's degree: 311
- Master's degree: 101
- Professional school degree: 10
- Doctorate degree: 0
Housing units in structures:
- One, detached: 371
- One, attached: 960
- Two: 180
- 3 or 4: 355
- 5 to 9: 168
- Mobile homes: 19
Median worth of mobile homes: $165,166
Housing units lacking complete kitchen facilities: 0.5%
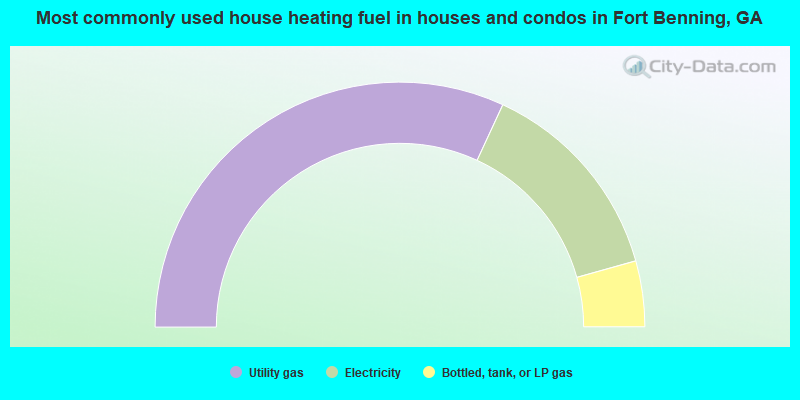
- 63.8%Utility gas
- 27.5%Electricity
- 8.7%Bottled, tank, or LP gas

- 61.5%Utility gas
- 35.7%Electricity
- 1.5%Bottled, tank, or LP gas
- 1.0%Other fuel
- 0.3%No fuel used
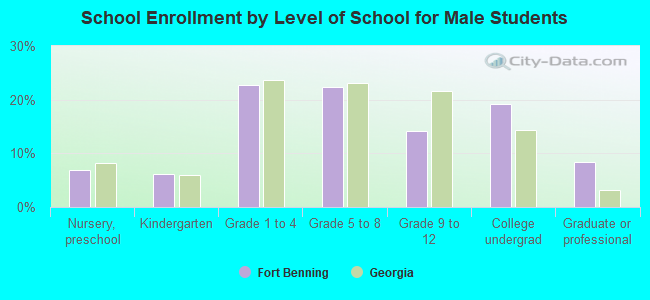
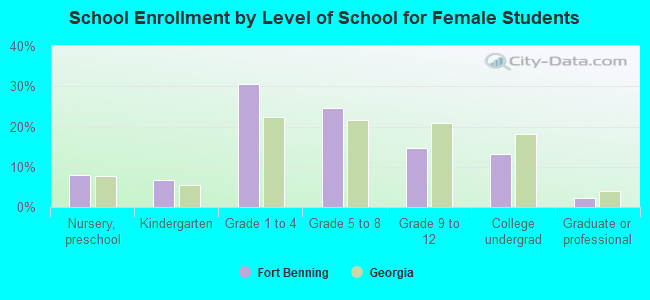
Private vs. public school enrollment:
| Here: | 4.9% |
| Georgia: | 8.4% |
| Here: | 3.7% |
| Georgia: | 8.5% |
| Here: | 17.8% |
| Georgia: | 22.9% |