Housing density: 1,840 houses/condos per square mile
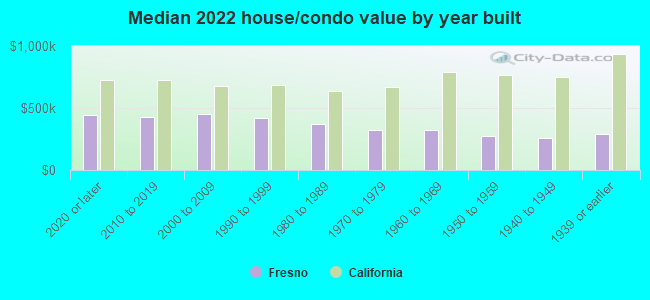
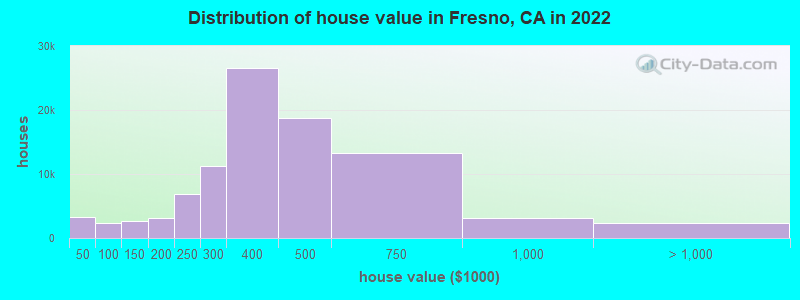
Median price asked for vacant for-sale houses and condos in 2022: $480,866.
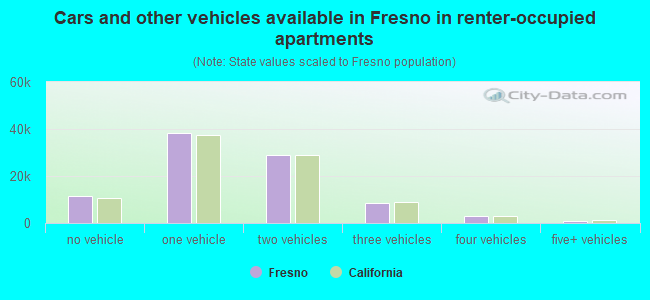
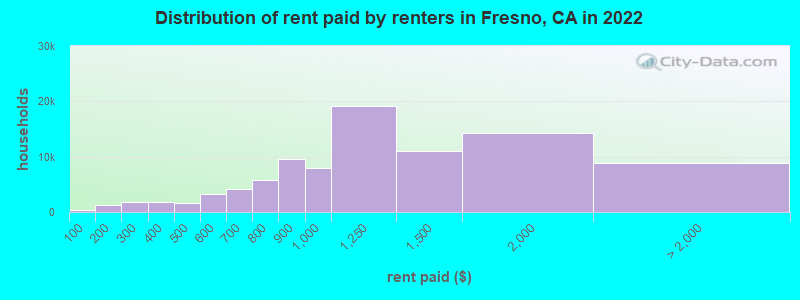
Median contract rent in 2022: $1,087 (lower quartile is $821, upper quartile is $1,469)
Median rent asked for vacant for-rent units in 2022: $1,601
Median gross rent in Fresno, CA in 2022: $1,334
Housing units in Fresno with a mortgage: 62,739 (4,017 second mortgage, 251 home equity loan, 2,959 both second mortgage and home equity loan) Houses without a mortgage: 447
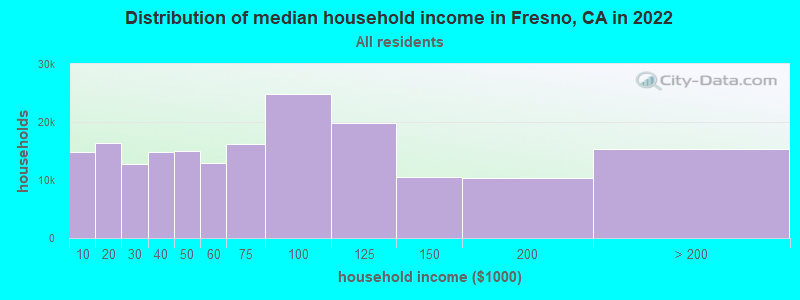
Median household income for houses/condos with a mortgage: $98,788
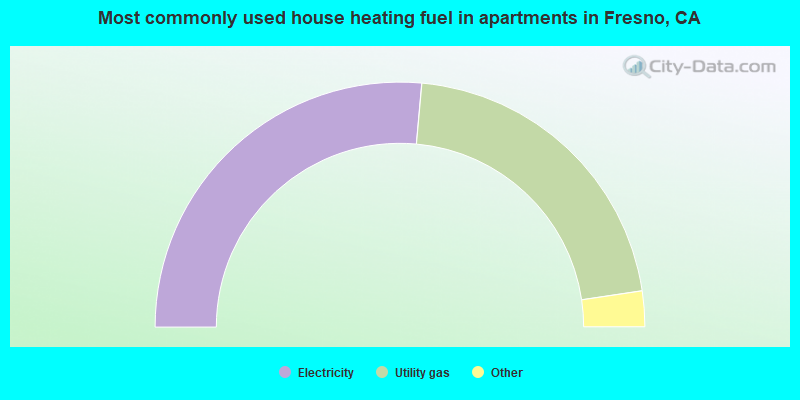
Median household income for apartments without a mortgage: $65,950
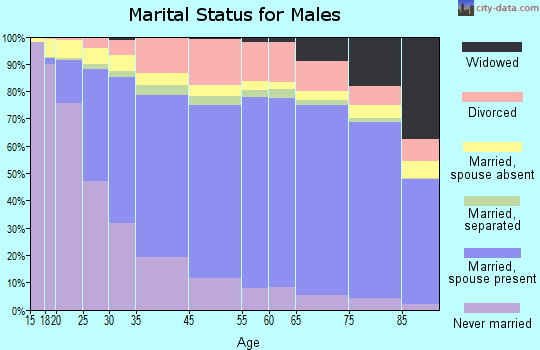
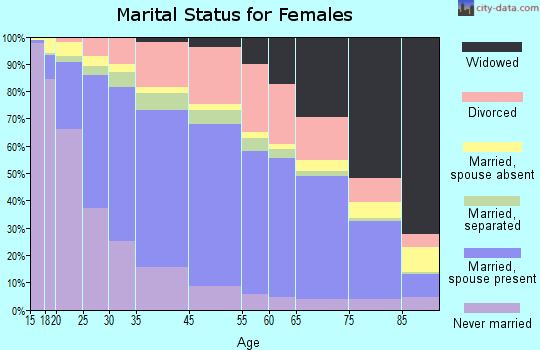
78,078 married couples with children.
53,574 single-parent households (16,200 men, 37,374 women).
58.5% of residents of Fresno speak English at home.
29.1% of residents speak Spanish at home (67% speak English very well, 13% speak English well, 10% speak English not well, 9% don't speak English at all).
4.3% of residents speak other Indo-European language at home (52% speak English very well, 28% speak English well, 14% speak English not well, 6% don't speak English at all).
7.5% of residents speak Asian or Pacific Island language at home (55% speak English very well, 28% speak English well, 13% speak English not well, 5% don't speak English at all).
0.7% of residents speak other language at home (54% speak English very well, 22% speak English well, 19% speak English not well, 5% don't speak English at all).
Foreign born population: 99,555 (18.2%)
(50.2% of them are naturalized citizens)
Percentage of workers working in this county: 93.3% Number of people working at home: 28,525 (12.1% of all workers)
Travel time to work (commute)
Less than 5 minutes: 5,610
5 to 9 minutes: 20,410
10 to 14 minutes: 30,061
15 to 19 minutes: 44,245
20 to 24 minutes: 45,502
25 to 29 minutes: 14,604
30 to 34 minutes: 25,483
35 to 39 minutes: 2,566
40 to 44 minutes: 2,785
45 to 59 minutes: 5,488
60 to 89 minutes: 7,304
90 or more minutes: 3,412
Means of transportation to work:
Drove a car alone: 207,237 (74.5%)
Carpooled: 29,840 (10.7%)
Bus: 2,073 (0.7%)
Taxi: 4,875 (1.8%)
Bicycle: 1,555 (0.6%)
Walked: 4,037 (1.5%)
Worked at home: 28,525 (10.3%)
Unemployment by race in 2022
Unemployment rate for White non-Hispanic residents
6.0%Males
4.7%Females
Unemployment rate for Black residents
11.9%Males
8.9%Females
Unemployment rate for American Indian and Alaska Native residents
11.0%Males
13.2%Females
Unemployment rate for Asian residents
7.6%Males
9.2%Females
Unemployment rate for other race residents
5.2%Males
16.6%Females
Unemployment rate for two or more race residents
7.7%Males
6.0%Females
Unemployment rate for Hispanic or Latino residents
6.9%Males
10.7%Females
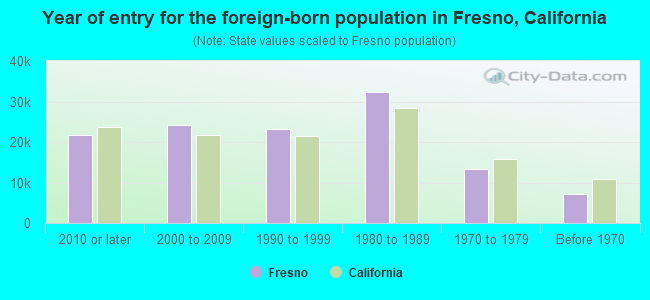
Year of entry for the foreign-born population in Fresno, California
21,8432010 or later
24,1232000 to 2009
23,1361990 to 1999
32,2581980 to 1989
13,2461970 to 1979
7,189Before 1970
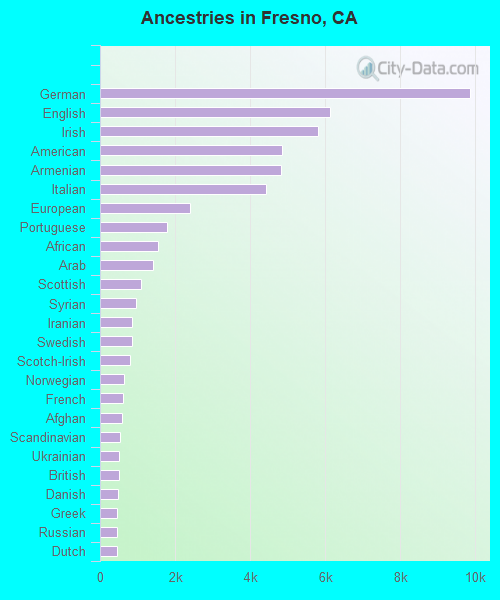
First ancestries reported:
German: 9,878 (2.9%)
English: 6,128 (1.8%)
Irish: 5,800 (1.7%)
American: 4,859 (1.4%)
Armenian: 4,814 (1.4%)
Italian: 4,428 (1.3%)
European: 2,394 (0.7%)
Portuguese: 1,795 (0.5%)
African: 1,552 (0.5%)
Arab: 1,406 (0.4%)
Scottish: 1,098 (0.3%)
Syrian: 950 (0.3%)
Iranian: 865 (0.3%)
Swedish: 860 (0.3%)
Scotch-Irish: 807 (0.2%)
Norwegian: 628 (0.2%)
French: 626 (0.2%)
Afghan: 577 (0.2%)
Scandinavian: 526 (0.2%)
Ukrainian: 517 (0.2%)
British: 494 (0.1%)
Danish: 475 (0.1%)
Greek: 462 (0.1%)
Russian: 457 (0.1%)
Dutch: 449 (0.1%)
Czech: 430 (0.1%)
Polish: 405 (0.1%)
French Canadian: 238 (0.07%)
Lebanese: 226 (0.07%)
Iraqi: 220 (0.07%)
Ethiopian: 215 (0.06%)
Romanian: 200 (0.06%)
Basque: 190 (0.06%)
Northern European: 171 (0.05%)
Hungarian: 170 (0.05%)
Canadian: 163 (0.05%)
Welsh: 142 (0.04%)
Serbian: 135 (0.04%)
Swiss: 120 (0.04%)
Croatian: 117 (0.03%)
Egyptian: 110 (0.03%)
Nigerian: 107 (0.03%)
Kenyan: 85 (0.03%)
Yugoslavian: 79 (0.02%)
Ugandan: 78 (0.02%)
Bulgarian: 76 (0.02%)
Finnish: 74 (0.02%)
Eastern European: 74 (0.02%)
Palestinian: 68 (0.02%)
Jordanian: 62 (0.02%)
Lithuanian: 59 (0.02%)
Austrian: 56 (0.02%)
Sierra Leonean: 50 (0.01%)
Haitian: 46 (0.01%)
Zimbabwean: 44 (0.01%)
Moroccan: 36 (0.01%)
Belgian: 33 (0.01%)
German Russian: 26 (0.01%)
Pennsylvania German: 24 (0.01%)
Trinidadian and Tobagonian: 22 (0.01%)
Czechoslovakian: 21 (0.01%)
Turkish: 21 (0.01%)
Slovak: 19 (0.01%)
Jamaican: 19 (0.01%)
Brazilian: 18 (0.01%)
Dutch West Indian: 17 (0.01%)
Most common places of birth for foreign-born residents (%):
Mexico
Fresno:
46.9% (48,086)
California:
37.2% (3,881,193)
India
Fresno:
11.3% (11,549)
California:
5.2% (539,184)
Laos
Fresno:
7.4% (7,560)
California:
0.5% (48,911)
Philippines
Fresno:
5.1% (5,203)
California:
7.8% (818,297)
Thailand
Fresno:
3.8% (3,916)
California:
0.6% (65,335)
Vietnam
Fresno:
1.9% (1,926)
California:
4.9% (512,335)
China, excluding Hong Kong and Taiwan
Fresno:
1.7% (1,765)
California:
6.6% (684,672)
El Salvador
Fresno:
1.7% (1,765)
California:
4.2% (440,287)
Place of birth for U.S.-born residents:
This state: 391,269
Other state: 50,170
Northeast: 5,608
Midwest: 12,431
South: 17,876
West: 14,255
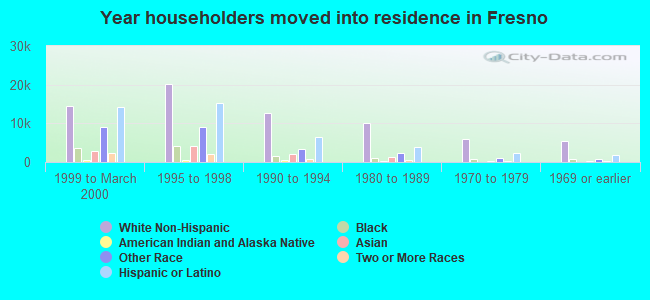
87.4% of Fresno residents lived in the same house 1 years ago. Out of people who lived in different houses, 43.8% lived in this county. Out of people who lived in different counties, 84.1% lived in California.
Fresno:
87.4%
State average:
88.9%
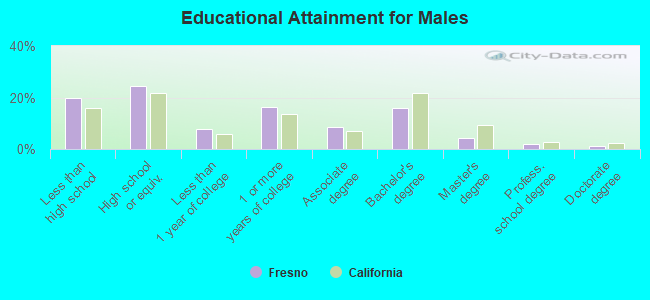
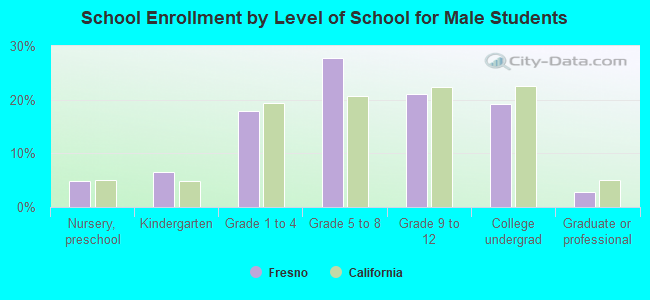
Education attainment for males 25 years and older:
No schooling: 7,281
Nursery to 4th grade: 2,421
5th and 6th grade: 5,330
7th and 8th grade: 781
9th grade: 2,991
10th grade: 3,672
11th grade: 3,391
12th grade, no diploma: 6,866
High school graduate (or equivalency): 40,646
Less than 1 year of college: 12,543
Some college more than 1 year, no degree: 27,141
Associate degree: 14,192
Bachelor's degree: 26,201
Master's degree: 7,208
Professional school degree: 2,899
Doctorate degree: 1,631
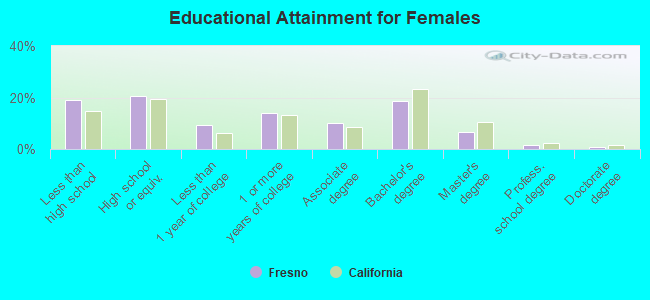
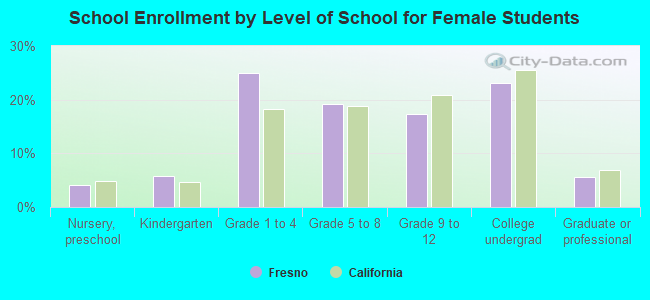
Education attainment for females 25 years and older:
No schooling: 9,163
Nursery to 4th grade: 2,295
5th and 6th grade: 3,534
7th and 8th grade: 2,725
9th grade: 2,388
10th grade: 4,713
11th grade: 2,774
12th grade, no diploma: 5,117
High school graduate (or equivalency): 35,081
Less than 1 year of college: 15,861
Some college more than 1 year, no degree: 23,817
Associate degree: 17,346
Bachelor's degree: 31,682
Master's degree: 11,250
Professional school degree: 2,408
Doctorate degree: 1,605
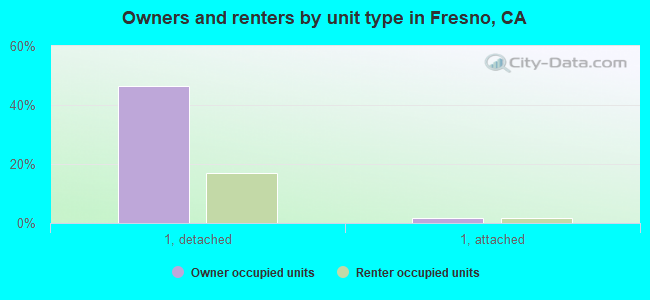
Housing units in structures:
One, detached: 119,916
One, attached: 7,057
Two: 6,583
3 or 4: 14,684
5 to 9: 13,096
10 to 19: 6,758
20 to 49: 5,970
50 or more: 13,499
Mobile homes: 4,444
Median worth of mobile homes: $63,300
Housing units lacking complete plumbing facilities in 2022: 0.6%
Housing units lacking complete kitchen facilities in 2022: 1.5%