Friendly, MD (Maryland) Houses and Residents
| Friendly: | $419,761 |
| Maryland: | $398,100 |
Mean price in 2022:
Detached houses: $417,016
Here: $417,016 State: $526,819 Townhouses or other attached units: $458,275
Here: $458,275 State: $328,305
Total population: 9,250 (All urban)
Houses: 3,833 (3,611 occupied: 3,310 owner occupied, 317 renter occupied)
| % of renters here: | 9% |
| State: | 32% |
Housing density: 564 houses/condos per square mile
Median price asked for vacant for-sale houses and condos in 2022: $505,565.
Median contract rent in 2022: $1,782 (lower quartile is $1,458, upper quartile is over $2,000)
Median rent asked for vacant for-rent units in 2022: $1,722
Median gross rent in Friendly, MD in 2022: over $2,000
Housing units in Friendly with a mortgage: 2,677 (193 second mortgage, 0 home equity loan, 126 both second mortgage and home equity loan)
Houses without a mortgage: 248
Median household income for houses/condos with a mortgage: $134,520
Median household income for apartments without a mortgage: $104,081
Median monthly housing costs: $2,233
Compare current foreclosures near Friendly, MD:
| Photo | Address | Area | Beds / Baths | Price | Details |
|---|---|---|---|---|---|

|
#1
Greenwood Pl
Indian Head, MD 20640
|
912 sq. feet
|
1 baths 2 beds |
$104,900
|
show details |

|
#2
Oakwood Ln
Pomfret, MD 20675
|
1,628 sq. feet
|
2 baths 3 beds |
$262,500
|
show details |

|
#3
Old Fort Rd
Fort Washington, MD 20744
|
721 sq. feet
|
1 baths 2 beds |
$179,900
|
show details |

|
#4
Cathedral Ave NW Apt 108
Washington, DC 20016
|
765 sq. feet
|
1 baths 1 beds |
$279,900
|
show details |

|
#5
Whistling Duck Dr
Upper Marlboro, MD 20774
|
1,740 sq. feet
|
2 baths 3 beds |
$389,500
|
show details |

|
#6
Eastern Ave NE
Washington, DC 20011
|
1,024 sq. feet
|
1 baths 3 beds |
$395,000
|
show details |

|
#7
17th St NW Apt 504
Washington, DC 20009
|
800 sq. feet
|
1 baths 1 beds |
$419,900
|
show details |

|
#8
19th St NW
Washington, DC 20036
|
2,515 sq. feet
|
6 baths 8 beds |
$1,684,800
|
show details |

|
#9
Carousel Ct
Upper Marlboro, MD 20772
|
2,112 sq. feet
|
2 baths 3 beds |
$412,000
|
show details |

|
#10
Bannister Cir
Waldorf, MD 20602
|
1,196 sq. feet
|
3 baths 4 beds |
$449,900
|
show details |
| Photo | Address | Area | Beds / Baths | Price | Details |
|---|---|---|---|---|---|

|
#11
Pickett Dr
Suitland, MD 20746
|
1,296 sq. feet
|
1 baths 2 beds |
$358,900
|
show details |

|
#12
Parkside Dr
Bowie, MD 20721
|
5,066 sq. feet
|
2 baths 5 beds |
$780,000
|
show details |

|
#13
T St SE Apt 3
Washington, DC 20020
|
- sq. feet
|
2 baths 4 beds |
$339,900
|
show details |

|
#14
Delaware Ave SW Apt N720
Washington, DC 20024
|
- sq. feet
|
1 baths 1 beds |
$155,000
|
show details |

|
#15
4th St NE Apt 2
Washington, DC 20002
|
1,061 sq. feet
|
2 baths 2 beds |
show details | |

|
#16
Scottsdale Pl
Waldorf, MD 20602
|
2,068 sq. feet
|
3 baths 3 beds |
show details | |

|
#17
Peacock Dr
Hyattsville, MD 20785
|
1,452 sq. feet
|
2 baths 3 beds |
show details | |

|
#18
Girard St NE
Washington, DC 20017
|
1,270 sq. feet
|
1 baths 3 beds |
show details | |

|
#19
Arbroath Dr
Clinton, MD 20735
|
1,432 sq. feet
|
2 baths 3 beds |
show details | |

|
#20
Connecticut Ave NW Apt 606
Washington, DC 20008
|
160 sq. feet
|
1 baths 1 beds |
show details |
| Photo | Address | Area | Beds / Baths | Price | Details |
|---|---|---|---|---|---|

|
#21
Sutton Ct
Upper Marlboro, MD 20774
|
1,546 sq. feet
|
3 baths 5 beds |
show details | |

|
#22
Foote St NE
Washington, DC 20019
|
1,000 sq. feet
|
1 baths 3 beds |
show details | |

|
#23
Downing Ct
Bowie, MD 20721
|
1,288 sq. feet
|
3 baths 3 beds |
show details | |

|
#24
Petzold Dr
Waldorf, MD 20601
|
1,784 sq. feet
|
2 baths 4 beds |
show details | |

|
#25
Sargent Rd NE
Washington, DC 20017
|
1,360 sq. feet
|
2 baths 3 beds |
show details | |

|
#26
Peanuts Ln
Waldorf, MD 20602
|
- sq. feet
|
2 baths 3 beds |
show details | |

|
#27
Eaton Woods Pl
Lorton, VA 22079
|
1,448 sq. feet
|
2 baths 3 beds |
show details | |

|
#28
Baileys Pond Rd
Accokeek, MD 20607
|
4,677 sq. feet
|
2 baths 7 beds |
show details | |

|
#29
Trent St
Clinton, MD 20735
|
1,080 sq. feet
|
2 baths 3 beds |
show details | |

|
#30
Rolling Spring Ct
Springfield, VA 22152
|
3,365 sq. feet
|
4 baths 4 beds |
show details |
| Photo | Address | Area | Beds / Baths | Price | Details |
|---|---|---|---|---|---|

|
#31
Newtowne Ct
Lorton, VA 22079
|
- sq. feet
|
2 baths 4 beds |
show details | |

|
#32
Bishops Content Rd
Bowie, MD 20721
|
2,504 sq. feet
|
3 baths 3 beds |
show details | |

|
#33
Underwood Pl NW
Washington, DC 20012
|
1,088 sq. feet
|
3 baths 3 beds |
show details | |

|
#34
Crelin Pl
Lanham, MD 20706
|
1,932 sq. feet
|
3 baths 4 beds |
show details | |

|
#35
Dery Rd
Upper Marlboro, MD 20772
|
816 sq. feet
|
1 baths 3 beds |
show details | |

|
#36
Deanwood Dr
Capitol Heights, MD 20743
|
640 sq. feet
|
1 baths 1 beds |
show details | |

|
#37
Winthrop St
Oxon Hill, MD 20745
|
1,020 sq. feet
|
1 baths 3 beds |
show details | |

|
#38
3rd St SW Apt 708
Washington, DC 20024
|
528 sq. feet
|
1 baths 1 beds |
show details | |

|
#39
Hill Way
Suitland, MD 20746
|
1,539 sq. feet
|
2 baths 4 beds |
show details | |

|
#40
English Ct
Suitland, MD 20746
|
1,296 sq. feet
|
2 baths 3 beds |
show details |
| Photo | Address | Area | Beds / Baths | Price | Details |
|---|---|---|---|---|---|

|
#41
Poplarwood Ct
Waldorf, MD 20601
|
1,080 sq. feet
|
2 baths 3 beds |
show details | |

|
#42
Chadsey Ln
Brandywine, MD 20613
|
2,480 sq. feet
|
3 baths 4 beds |
show details | |

|
#43
Summerwood Ln
Accokeek, MD 20607
|
3,774 sq. feet
|
5 baths 4 beds |
show details | |

|
#44
E Timber Branch Pkwy
Alexandria, VA 22302
|
1,743 sq. feet
|
2 baths 3 beds |
show details | |

|
#45
Bowen Rd SE Apt 403
Washington, DC 20020
|
930 sq. feet
|
1 baths 2 beds |
show details | |

|
#46
38th St SE Apt 201
Washington, DC 20020
|
675 sq. feet
|
1 baths 1 beds |
show details | |

|
#47
T Pl SE
Washington, DC 20020
|
900 sq. feet
|
2 baths 2 beds |
show details | |

|
#48
Poplar Hill Dr
Clinton, MD 20735
|
2,193 sq. feet
|
2 baths 3 beds |
show details | |

|
#49
Southern Ave SE
Washington, DC 20019
|
1,024 sq. feet
|
1 baths 3 beds |
show details | |

|
Check over 1 million property listings on Foreclosure.com!
|
browse all offers | |||

Latest news about housing in Friendly, MD collected exclusively by city-data.com from local newspapers, TV, and radio stations


Median year apartment built: 1978
Household type by relationship:
Households: 10,525- Male householders: 1,670 (446 living alone), Female householders: 1,854 (400 living alone)
1,777 spouses (1,747 opposite-sex spouses), 171 unmarried partners, (156 opposite-sex unmarried partners), 2,417 children (2,245 natural, 126 adopted, 45 stepchildren), 383 grandchildren, 421 brothers or sisters, 417 parents, 0 foster children, 640 other relatives, 726 non-relatives
- In group quarters: 43
Size of family households: 1,088 2-persons, 658 3-persons, 517 4-persons, 119 5-persons, 74 6-persons, 139 7-or-more-persons.
Size of nonfamily households: 833 1-person, 115 2-persons, 33 3-persons, 44 5-persons, 9 6-persons.
702 married couples with children.
267 single-parent households (83 men, 184 women).
71.3% of residents of Friendly speak English at home.
21.1% of residents speak Spanish at home (56% speak English very well, 15% speak English well, 26% speak English not well, 4% don't speak English at all).
2.3% of residents speak other Indo-European language at home (47% speak English very well, 45% speak English well, 8% speak English not well).
3.5% of residents speak Asian or Pacific Island language at home (86% speak English very well, 6% speak English well, 8% speak English not well).
0.5% of residents speak other language at home (100% speak English very well).
Foreign born population: 2,230 (21.2%)
(41.0% of them are naturalized citizens)
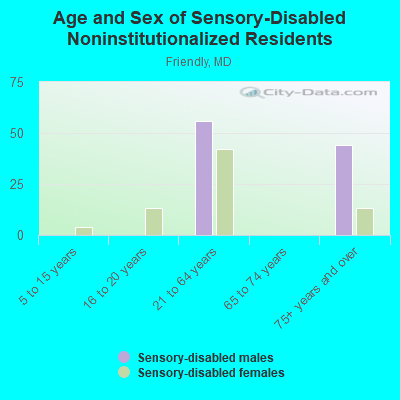
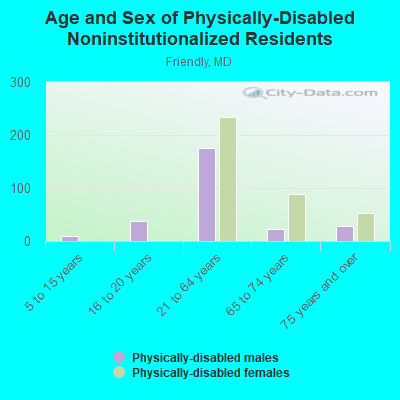
| Here: | 7.8 |
| State: | 7.3 |
| Here: | 8.1 |
| State: | 4.2 |
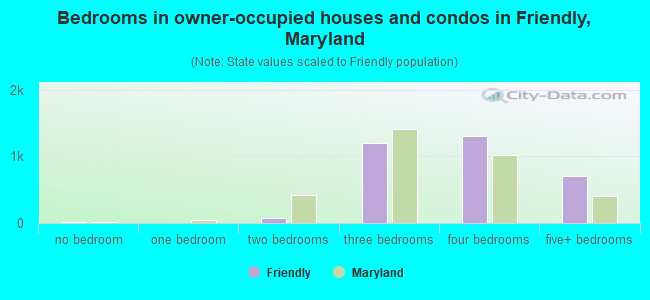
- Bedrooms in owner-occupied houses and condos in Friendly, Maryland
- 16no bedroom
- 01 bedroom
- 802 bedrooms
- 1,2013 bedrooms
- 1,3044 bedrooms
- 7095+ bedrooms
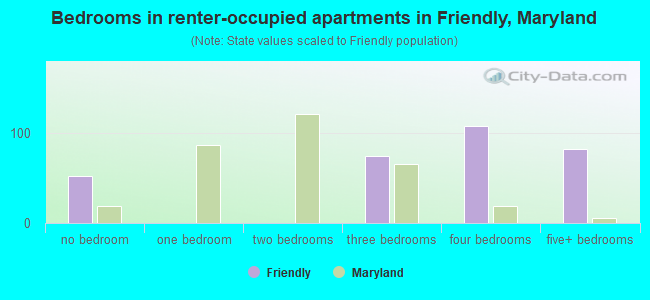
- Bedrooms in renter-occupied apartments in Friendly, Maryland
- 52no bedroom
- 01 bedroom
- 02 bedrooms
- 753 bedrooms
- 1084 bedrooms
- 825+ bedrooms
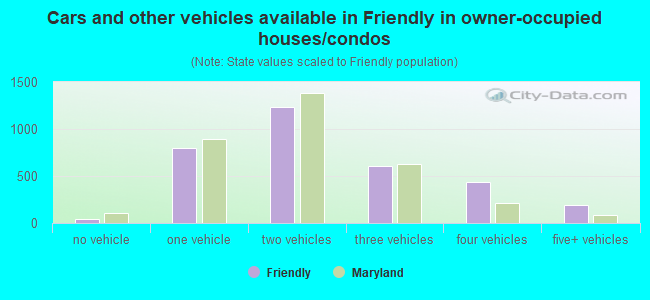
- Cars and other vehicles available in Friendly in owner-occupied houses/condos
- 38no vehicle
- 8011 vehicle
- 1,2312 vehicles
- 6053 vehicles
- 4414 vehicles
- 1955+ vehicles
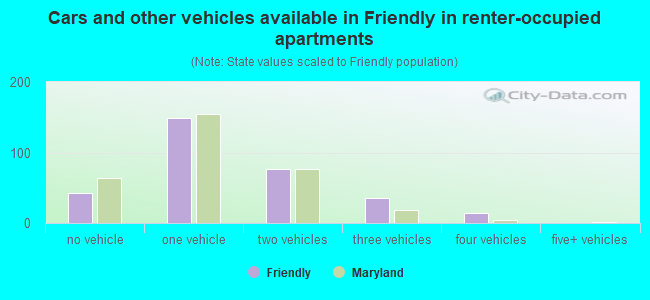
- Cars and other vehicles available in Friendly in renter-occupied apartments
- 42no vehicle
- 1491 vehicle
- 772 vehicles
- 363 vehicles
- 144 vehicles
- 05+ vehicles
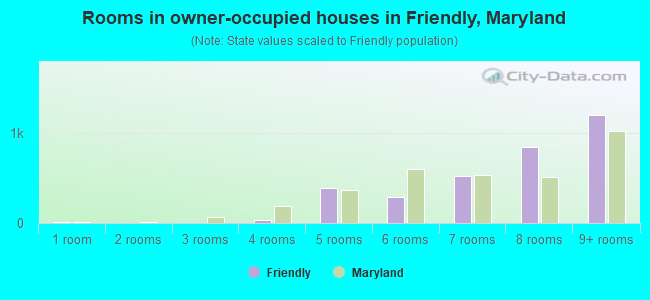
- Rooms in owner-occupied houses in Friendly, Maryland
- 161 room
- 02 rooms
- 03 rooms
- 344 rooms
- 3925 rooms
- 2946 rooms
- 5227 rooms
- 8508 rooms
- 1,2029+ rooms
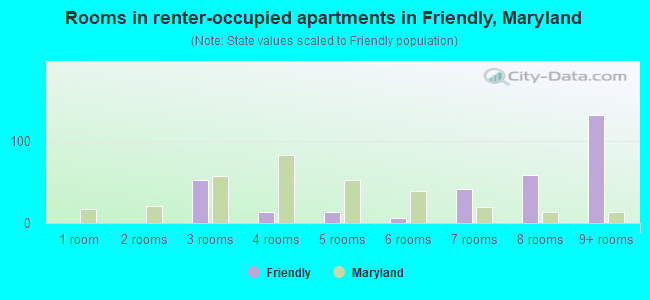
- Rooms in renter-occupied apartments in Friendly, Maryland
- 01 room
- 02 rooms
- 523 rooms
- 134 rooms
- 145 rooms
- 66 rooms
- 417 rooms
- 598 rooms
- 1329+ rooms
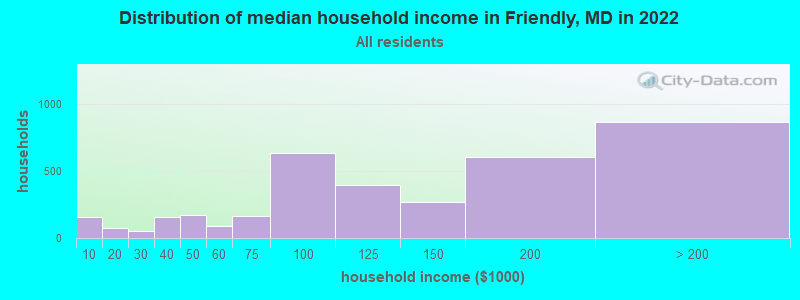
Friendly, MD household income distribution

- 155Less than $10,000
- 74$10,000 to $19,999
- 53$20,000 to $29,999
- 153$30,000 to $39,999
- 170$40,000 to $49,999
- 91$50,000 to $59,999
- 162$60,000 to $74,999
- 634$75,000 to $99,999
- 396$100,000 to $124,999
- 265$125,000 to $149,999
- 605$150,000 to $199,999
- 864$200,000 or more
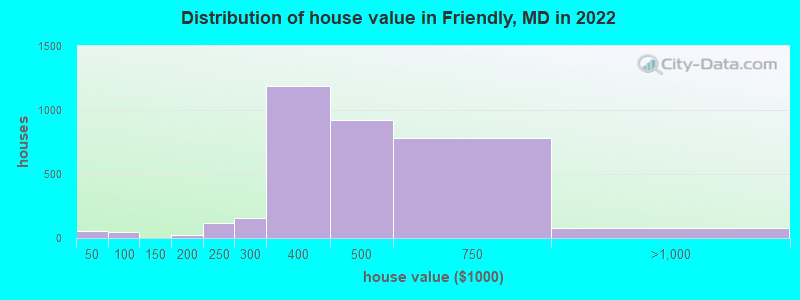
Home value of owner - occupied houses in 2022 in Friendly, MD
-
- 11$25,000 to $29,999
- 6$35,000 to $39,999
- 36$40,000 to $49,999
- 6$70,000 to $79,999
- 6$150,000 to $174,999
- 19$175,000 to $199,999
- 113$200,000 to $249,999
- 158$250,000 to $299,999
- 1,184$300,000 to $399,999
- 917$400,000 to $499,999
- 785$500,000 to $749,999
- 58$750,000 to $999,999
- 14$1,000,000 to $1,499,999
- 6$2,000,000 or more
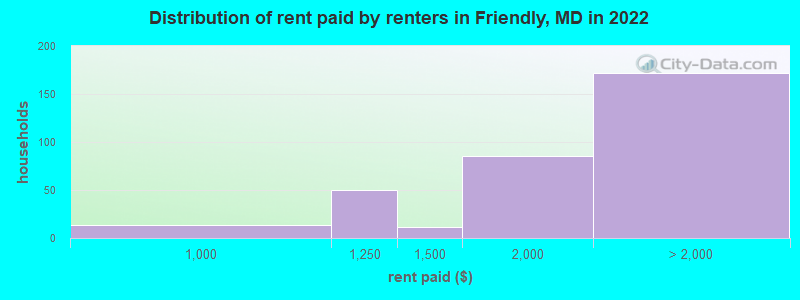
Rent paid by renters in 2022 in Friendly, MD
-
- 14$900 to $999
- 49$1,000 to $1,249
- 10$1,250 to $1,499
- 84$1,500 to $1,999
- 23$2,000 to $2,499
- 40$2,500 to $2,999
- 107No cash rent
Percentage of workers working in this county: 53.1%
Number of people working at home: 1,439 (27.2% of all workers)
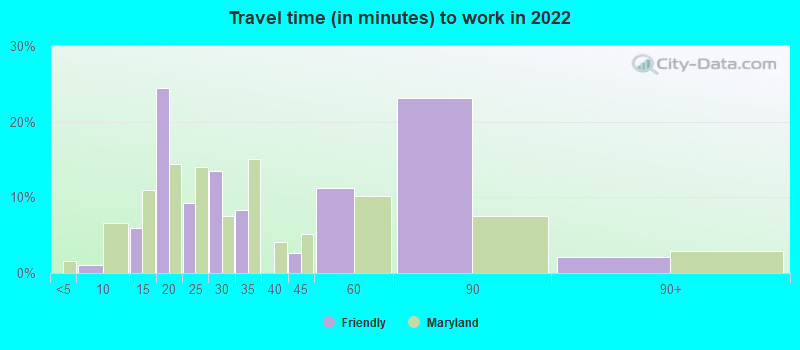
Travel time to work (commute)
- Less than 5 minutes: 8
- 5 to 9 minutes: 59
- 10 to 14 minutes: 251
- 15 to 19 minutes: 273
- 20 to 24 minutes: 380
- 25 to 29 minutes: 207
- 30 to 34 minutes: 577
- 35 to 39 minutes: 327
- 40 to 44 minutes: 278
- 45 to 59 minutes: 754
- 60 to 89 minutes: 519
- 90 or more minutes: 351
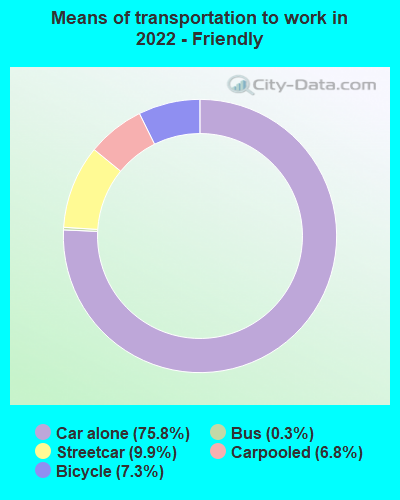
Means of transportation to work:
- Drove a car alone: 260 (17.8%)
- Carpooled: 21 (1.4%)
- Subway or elevated rail: 23 (1.6%)
- Bicycle: 26 (1.8%)
- Worked at home: 1,439 (98.6%)
- Unemployment by race in 2022
- Unemployment rate for White non-Hispanic residents
- 2.4%Males
- 12.6%Females
- Unemployment rate for Black residents
- 9.5%Males
- 2.6%Females
- Unemployment rate for American Indian and Alaska Native residents
- 47.6%Males
- 33.0%Females
- Unemployment rate for Asian residents
- 1.5%Males
- Unemployment rate for other race residents
- 2.2%Males
- Unemployment rate for two or more race residents
- 4.5%Females
- Unemployment rate for Hispanic or Latino residents
- 2.4%Males
- 1.9%Females
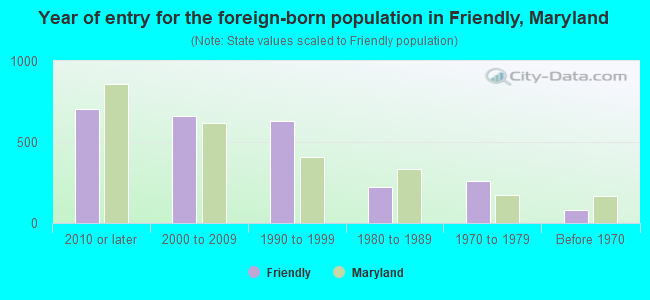
- Year of entry for the foreign-born population in Friendly, Maryland
- 7062010 or later
- 6602000 to 2009
- 6271990 to 1999
- 2251980 to 1989
- 2581970 to 1979
- 82Before 1970
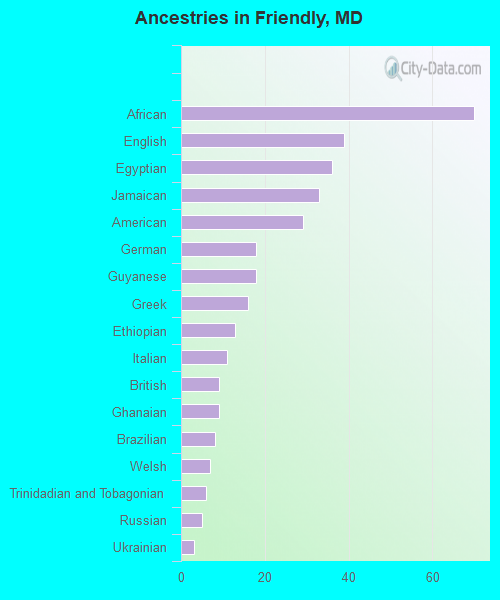
First ancestries reported:
- African: 70 (0.9%)
- English: 39 (0.5%)
- Egyptian: 36 (0.5%)
- Jamaican: 33 (0.4%)
- American: 29 (0.4%)
- German: 18 (0.2%)
- Guyanese: 18 (0.2%)
- Greek: 16 (0.2%)
- Ethiopian: 13 (0.2%)
- Italian: 11 (0.1%)
- British: 9 (0.1%)
- Ghanaian: 9 (0.1%)
- Brazilian: 8 (0.1%)
- Welsh: 7 (0.09%)
- Trinidadian and Tobagonian: 6 (0.08%)
- Russian: 5 (0.06%)
- Ukrainian: 3 (0.04%)
Most common places of birth for foreign-born residents (%):
| Friendly: | 37.1% (817) |
| Maryland: | 12.0% (115,412) |
| Friendly: | 14.0% (309) |
| Maryland: | 3.8% (36,698) |
| Friendly: | 11.8% (259) |
| Maryland: | 2.5% (24,026) |
| Friendly: | 7.7% (170) |
| Maryland: | 3.5% (34,065) |
| Friendly: | 5.2% (115) |
| Maryland: | 2.5% (23,969) |
| Friendly: | 5.2% (115) |
| Maryland: | 4.4% (42,350) |
| Friendly: | 3.4% (74) |
| Maryland: | 1.4% (13,947) |
| Friendly: | 3.1% (69) |
| Maryland: | 0.8% (8,109) |
| Friendly: | 2.5% (54) |
| Maryland: | 4.6% (44,742) |
| Friendly: | 1.9% (42) |
| Maryland: | 1.8% (17,161) |
| Friendly: | 1.7% (38) |
| Maryland: | 0.7% (7,124) |
Place of birth for U.S.-born residents:
- This state: 1,391
- Other state: 6,515
- Northeast: 666
- Midwest: 390
- South: 5,147
- West: 231
96.8% of Friendly residents lived in the same house 1 years ago.
Out of people who lived in different houses, 33.4% lived in this county.
Out of people who lived in different counties, 53.0% lived in Maryland.
| Friendly: | 96.8% |
| State average: | 88.5% |
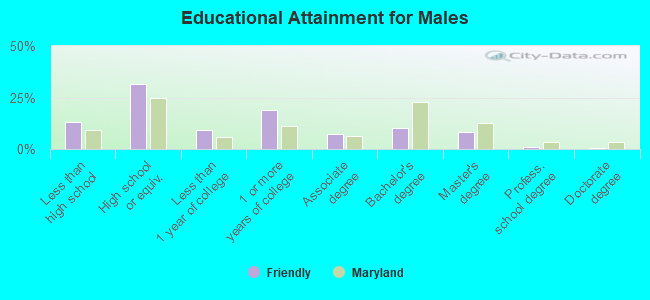
Education attainment for males 25 years and older:
- No schooling: 0
- Nursery to 4th grade: 0
- 5th and 6th grade: 211
- 7th and 8th grade: 19
- 9th grade: 79
- 10th grade: 36
- 11th grade: 106
- 12th grade, no diploma: 70
- High school graduate (or equivalency): 1,260
- Less than 1 year of college: 367
- Some college more than 1 year, no degree: 752
- Associate degree: 286
- Bachelor's degree: 400
- Master's degree: 328
- Professional school degree: 36
- Doctorate degree: 14
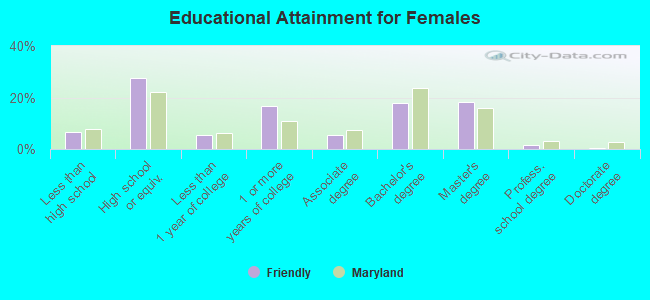
Education attainment for females 25 years and older:
- No schooling: 35
- Nursery to 4th grade: 24
- 5th and 6th grade: 111
- 7th and 8th grade: 0
- 9th grade: 0
- 10th grade: 15
- 11th grade: 61
- 12th grade, no diploma: 12
- High school graduate (or equivalency): 1,083
- Less than 1 year of college: 212
- Some college more than 1 year, no degree: 665
- Associate degree: 211
- Bachelor's degree: 712
- Master's degree: 727
- Professional school degree: 67
- Doctorate degree: 10
Housing units in structures:
- One, detached: 3,813
- 5 to 9: 7
- Mobile homes: 13
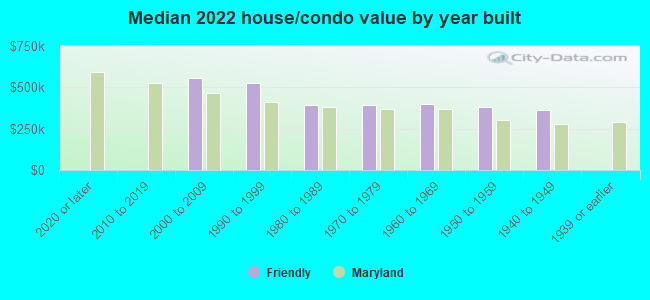
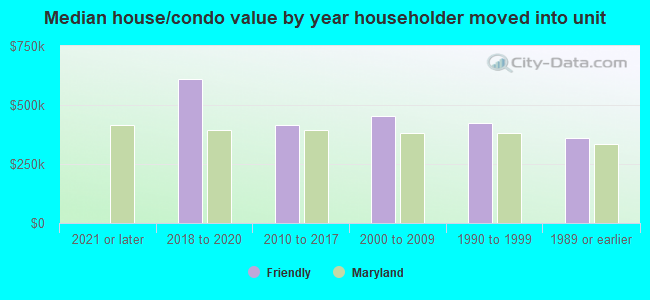
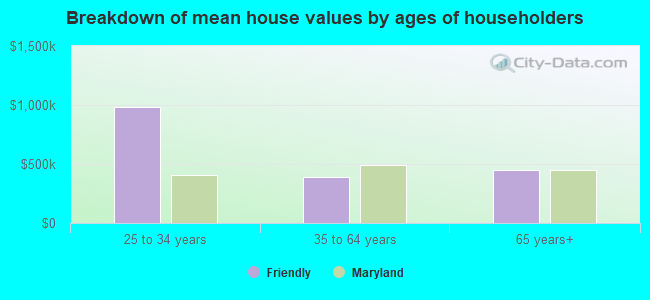
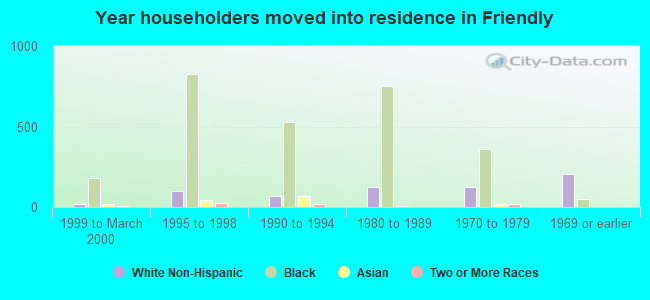
House/condo owner moved in on average 18 years ago
Renter moved in on average 7 years ago
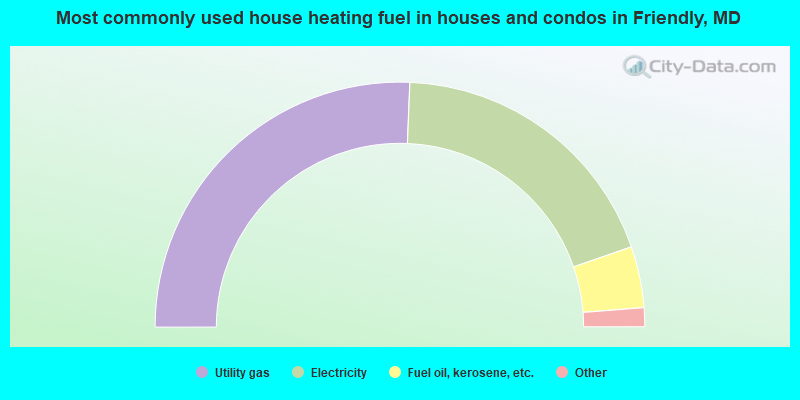
- 51.3%Utility gas
- 38.1%Electricity
- 8.1%Fuel oil, kerosene, etc.
- 1.1%Solar energy
- 1.0%Other fuel
- 0.3%No fuel used
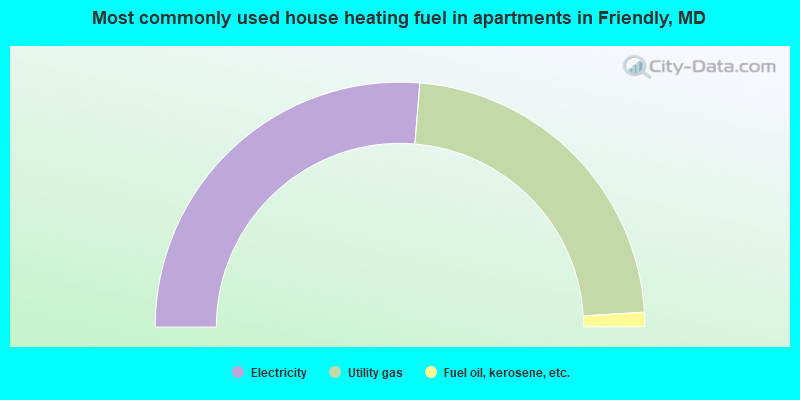
- 52.6%Electricity
- 45.5%Utility gas
- 1.9%Fuel oil, kerosene, etc.
Private vs. public school enrollment:
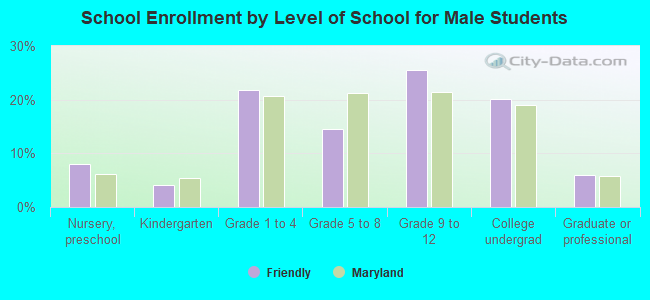
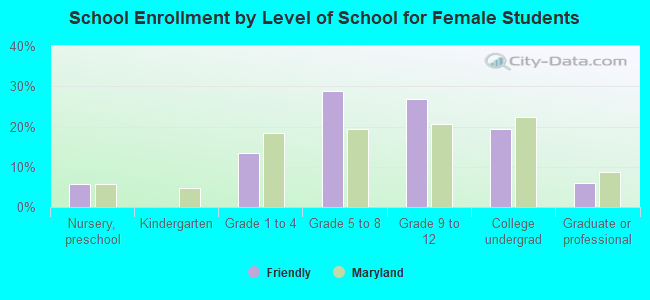
| Here: | 9.0% |
| Maryland: | 15.2% |
| Here: | 29.0% |
| Maryland: | 14.4% |
| Here: | 25.6% |
| Maryland: | 20.2% |