Glenvar Heights, FL (Florida) Houses and Residents
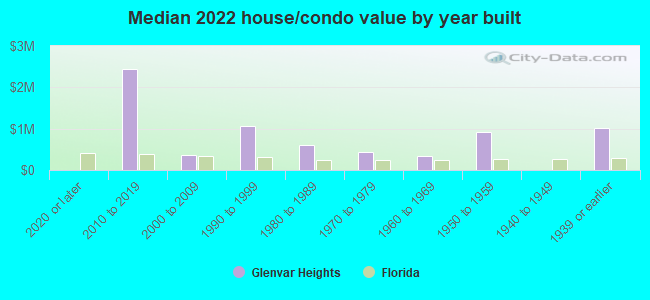
Estimated median house or condo value in 2022: $556,025 (it was $160,500 in 2000 )
Glenvar Heights:
$556,025Florida:
$354,100
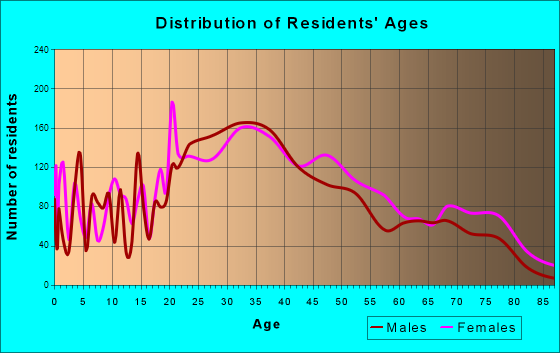
Lower value quartile - upper value quartile: $309,170 - $1,110,767Total population: 16,898 (Urban population: 16,115, Rural population: 0)
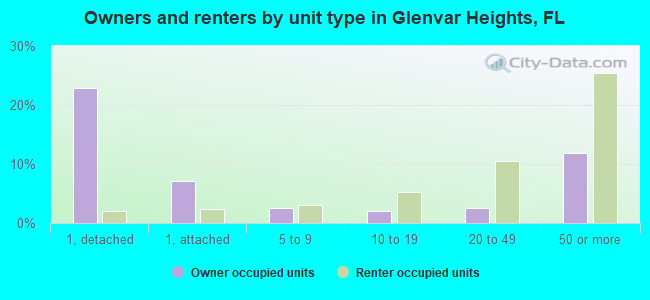
Houses: 9,375 (8,408 occupied: 4,189 owner occupied, 4,330 renter occupied )
% of renters here:
51%State:
33%
Housing density: 2,227 houses/condos per square mile
Median price asked for vacant for-sale houses and condos in 2022: $766,742.
Median contract rent in 2022: $1,830 (lower quartile is $1,439, upper quartile is over $2,000)
Median rent asked for vacant for-rent units in 2022: $2,464
Median gross rent in Glenvar Heights, FL in 2022: $1,893
Housing units in Glenvar Heights with a mortgage: 1,986 (297 second mortgage, 0 home equity loan, 299 both second mortgage and home equity loan )Houses without a mortgage: 48
Median household income for houses/condos with a mortgage: $144,673
Median household income for apartments without a mortgage: $61,567
Median monthly housing costs: $1,715
Data:
Median house or condo value ($)
Median house or condo value ($ change since 2000)
Median house or condo value ($) - White
Median house or condo value ($) - Black or African American
Median house or condo value ($) - Asian
Median house or condo value ($) - Hispanic or Latino
Median house or condo value ($) - American Indian and Alaska Native
Median house or condo value ($) - Multirace
Median house or condo value ($) - Other Race
Median price asked for mobile homes ($)
Household density (households per square mile)
Mean house or condo value by units in structure - 1, detached ($)
Mean house or condo value by units in structure - 1, attached ($)
Mean house or condo value by units in structure - 2 ($)
Mean house or condo value by units in structure by units in structure - 3 or 4 ($)
Mean house or condo value by units in structure - 5 or more ($)
Mean house or condo value by units in structure - Boat, RV, van, etc. ($)
Mean house or condo value by units in structure - Mobile home ($)
Median contract rent ($)
Median contract rent - Lower quartile ($)
Median contract rent - Upper quartile ($)
Median gross rent ($)
Urban houses (%)
Rural houses (%)
Houses occupied (%)
Houses occupied (% change since 2000)
Houses owner occupied (%)
Houses owner occupied (% change since 2000)
Houses renter occupied (%)
Houses renter occupied (% change since 2000)
Vacant housing units - For rent (%)
Vacant housing units - For rent (% change since 2000)
Vacant housing units - For sale only (%)
Vacant housing units - For sale only (% change since 2000)
Vacant housing units - Rented or sold, not occupied (%)
Vacant housing units - Rented or sold, not occupied (% change since 2000)
Vacant housing units - For seasonal, recreational, or occasional use (%)
Vacant housing units - For seasonal, recreational, or occasional use (% change since 2000)
Vacant housing units - For migrant workers (%)
Vacant housing units - For migrant workers (% change since 2000)
Vacant housing units - Other vacant (%)
Vacant housing units - Other vacant (% change since 2000)
Median monthly housing costs ($)
Median household income for houses/condos with a mortgage ($)
Median household income for houses/condos without a mortgage ($)
Median household income ($)
Median household income ($) - White
Median household income ($) - Black or African American
Median household income ($) - Asian
Median household income ($) - Hispanic or Latino
Median household income ($) - American Indian and Alaska Native
Median household income ($) - Multirace
Median household income ($) - Other Race
Mortgage status - with mortgage (%)
Mortgage status - with second mortgage (%)
Mortgage status - with home equity loan (%)
Mortgage status - with both second mortgage and home equity loan (%)
Mortgage status - without a mortgage (%)
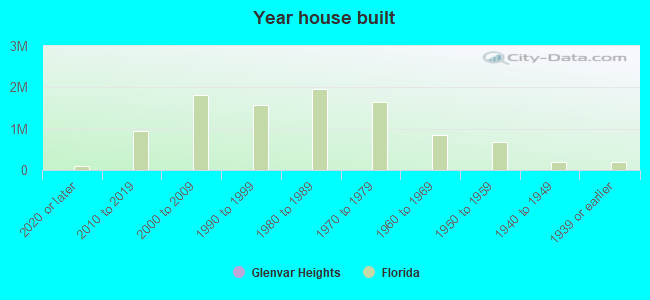
Median year house/condo built
Median year apartment built
Household type by relationship - Male householder living alone (%)
Household type by relationship - Male householder not living alone (%)
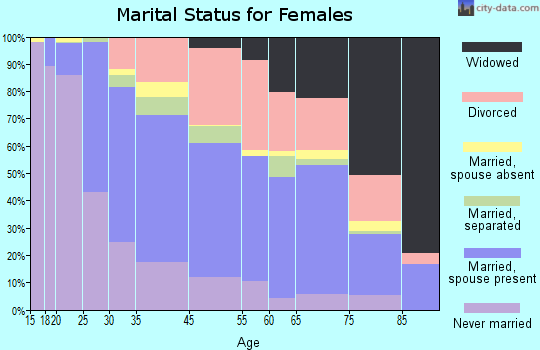
Household type by relationship - Female householder living alone (%)
Household type by relationship - Female householder not living alone (%)
Household type by relationship - Opposite-Sex spouse (%)
Household type by relationship - Same-Sex spouse (%)
Household type by relationship - Opposite-Sex unmarried partner (%)
Household type by relationship - Same-Sex unmarried partner (%)
Household type by relationship - In group quarters (%)
Size of family households - 2-person household (%)
Size of family households - 3-person household (%)
Size of family households - 4-person household (%)
Size of family households - 5-person household (%)
Size of family households - 6-person household (%)
Size of family households - 7-or-more-person household (%)
Size of nonfamily households - 1-person household (%)
Size of nonfamily households - 2-person household (%)
Size of nonfamily households - 3-person household (%)
Size of nonfamily households - 4-person household (%)
Size of nonfamily households - 5-person household (%)
Size of nonfamily households - 6-person household (%)
Size of nonfamily households - 7-or-moreperson household (%)
Year house built - Built 2010 or later (%)
Year house built - Built 2000 to 2009 (%)
Year house built - Built 1990 to 1999 (%)
Year house built - Built 1980 to 1989 (%)
Year house built - Built 1970 to 1979 (%)
Year house built - Built 1960 to 1969 (%)
Year house built - Built 1950 to 1959 (%)
Year house built - Built 1940 to 1949 (%)
Year house built - Built 1939 or earlier (%)
Median number of rooms in houses and condos
Median number of rooms in apartments
Median number of bedrooms in owner occupied houses
Mean number of bedrooms in owner occupied houses
Median number of bedrooms in renter occupied houses
Mean number of bedrooms in renter occupied houses
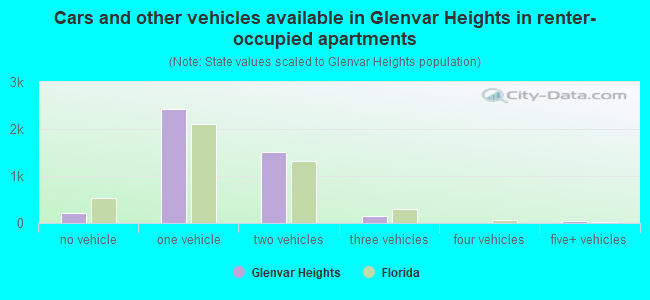
Median number of vehichles in owner occupied houses
Mean number of vehichles in owner occupied houses
Median number of vehichles in renter occupied houses
Mean number of vehichles in renter occupied houses
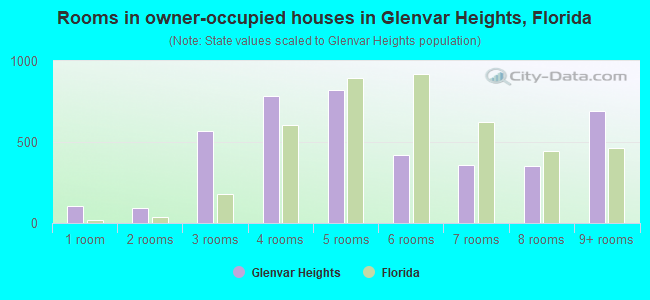
Rooms in owner-occupied houses - 1 room (%)
Rooms in owner-occupied houses - 2 rooms (%)
Rooms in owner-occupied houses - 3 rooms (%)
Rooms in owner-occupied houses - 4 rooms (%)
Rooms in owner-occupied houses - 5 rooms (%)
Rooms in owner-occupied houses - 6 rooms (%)
Rooms in owner-occupied houses - 7 rooms (%)
Rooms in owner-occupied houses - 8 rooms (%)
Rooms in owner-occupied houses - 9+ rooms (%)
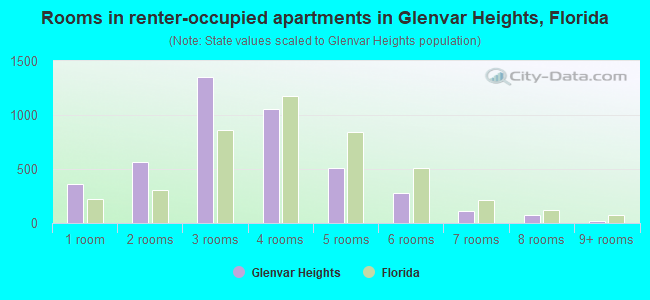
Rooms in renter-occupied houses - 1 room (%)
Rooms in renter-occupied houses - 2 rooms (%)
Rooms in renter-occupied houses - 3 rooms (%)
Rooms in renter-occupied houses - 4 rooms (%)
Rooms in renter-occupied houses - 5 rooms (%)
Rooms in renter-occupied houses - 6 rooms (%)
Rooms in renter-occupied houses - 7 rooms (%)
Rooms in renter-occupied houses - 8 rooms (%)
Rooms in renter-occupied houses - 9+ rooms (%)
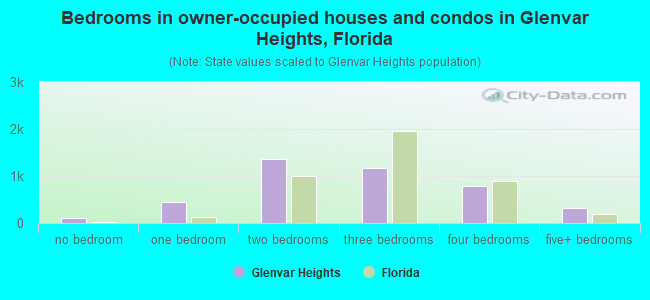
Bedrooms in owner-occupied houses - no bedrooms (%)
Bedrooms in owner-occupied houses - 1 bedroom (%)
Bedrooms in owner-occupied houses - 2 bedrooms (%)
Bedrooms in owner-occupied houses - 3 bedrooms (%)
Bedrooms in owner-occupied houses - 4 bedrooms (%)
Bedrooms in owner-occupied houses - 5+ bedrooms (%)
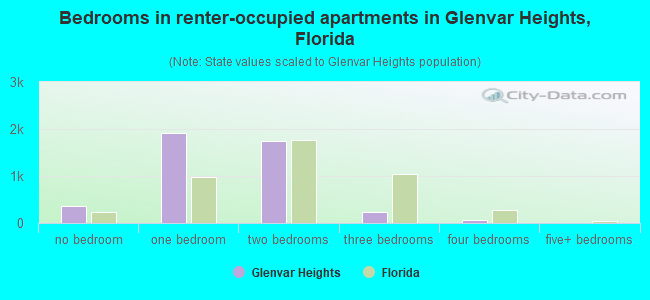
Bedrooms in renter-occupied houses - no bedrooms (%)
Bedrooms in renter-occupied houses - 1 bedroom (%)
Bedrooms in renter-occupied houses - 2 bedrooms (%)
Bedrooms in renter-occupied houses - 3 bedrooms (%)
Bedrooms in renter-occupied houses - 4 bedrooms (%)
Bedrooms in renter-occupied houses - 5+ bedrooms (%)
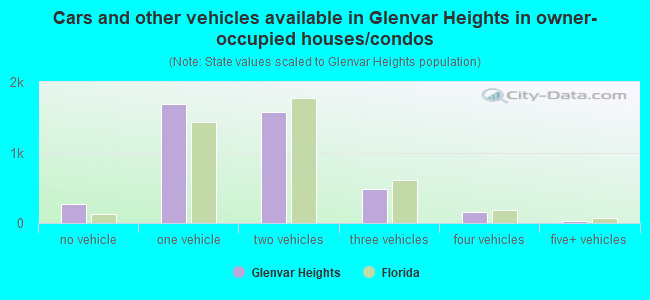
Vehicles available in owner-occupied houses - no vehicle available (%)
Vehicles available in owner-occupied houses - 1 vehicle available(%)
Vehicles available in owner-occupied houses - 2 Vehicles available (%)
Vehicles available in owner-occupied houses - 3 Vehicles available (%)
Vehicles available in owner-occupied houses - 4 Vehicles available (%)
Vehicles available in owner-occupied houses - 5+ Vehicles available (%)
Vehicles available in renter-occupied houses - no vehicle available (%)
Vehicles available in renter-occupied houses - 1 vehicle available (%)
Vehicles available in renter-occupied houses - 2 Vehicles available (%)
Vehicles available in renter-occupied houses - 3 Vehicles available (%)
Vehicles available in renter-occupied houses - 4 Vehicles available (%)
Vehicles available in renter-occupied houses - 5+ Vehicles available (%)
Housing units in structures - 1, detached (%)
Housing units in structures - 1, attached (%)
Housing units in structures - 2 (%)
Housing units in structures - 3 or 4 (%)
Housing units in structures - 5 to 9 (%)
Housing units in structures - 10 to 19 (%)
Housing units in structures - 20 to 49 (%)
Housing units in structures - 50 or more (%)
Housing units in structures - Mobile home (%)
Housing units in structures - Boat, RV, van, etc. (%)
Housing units in structures - Owners - 1, detached (%)
Housing units in structures - Owners - 1, attached (%)
Housing units in structures - Owners - 2 (%)
Housing units in structures - Owners - 3 or 4 (%)
Housing units in structures - Owners - 5 to 9 (%)
Housing units in structures - Owners - 10 to 19 (%)
Housing units in structures - Owners - 20 to 49 (%)
Housing units in structures - Owners - 50 or more (%)
Housing units in structures - Owners - Mobile home (%)
Housing units in structures - Owners - Boat, RV, van, etc. (%)
Housing units in structures - Renters - 1, detached (%)
Housing units in structures - Renters - 1, attached (%)
Housing units in structures - Renters - 2 (%)
Housing units in structures - Renters - 3 or 4 (%)
Housing units in structures - Renters - 5 to 9 (%)
Housing units in structures - Renters - 10 to 19 (%)
Housing units in structures - Renters - 20 to 49 (%)
Housing units in structures - Renters - 50 or more (%)
Housing units in structures - Renters - Mobile home (%)
Housing units in structures - Renters - Boat, RV, van, etc. (%)
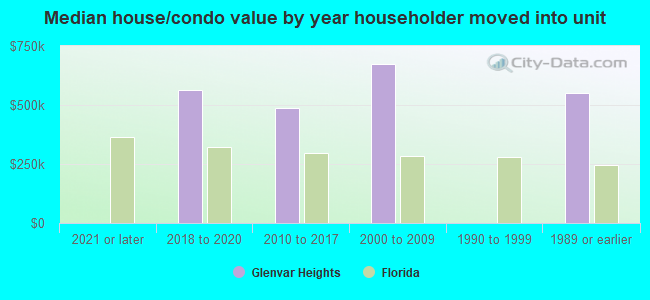
House/condo owner moved in on average (years ago)
Renter moved in on average (years ago)
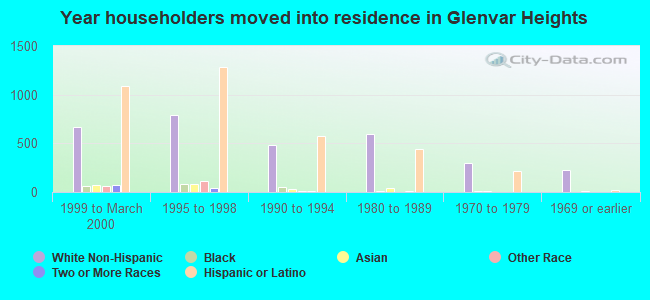
Year householder moved into unit - Moved in 1999 to March 2000 (%)
Year householder moved into unit - Moved in 1999 to March 2000 (%) - White
Year householder moved into unit - Moved in 1999 to March 2000 (%) - Black or African American
Year householder moved into unit - Moved in 1999 to March 2000 (%) - Asian
Year householder moved into unit - Moved in 1999 to March 2000 (%) - Hispanic or Latino
Year householder moved into unit - Moved in 1999 to March 2000 (%) - American Indian and Alaska Native
Year householder moved into unit - Moved in 1999 to March 2000 (%) - Multirace
Year householder moved into unit - Moved in 1999 to March 2000 (%) - Other Race
Year householder moved into unit - Moved in 1995 to 1998 (%)
Year householder moved into unit - Moved in 1995 to 1998 (%) - White
Year householder moved into unit - Moved in 1995 to 1998 (%) - Black or African American
Year householder moved into unit - Moved in 1995 to 1998 (%) - Asian
Year householder moved into unit - Moved in 1995 to 1998 (%) - Hispanic or Latino
Year householder moved into unit - Moved in 1995 to 1998 (%) - American Indian and Alaska Native
Year householder moved into unit - Moved in 1995 to 1998 (%) - Multirace
Year householder moved into unit - Moved in 1995 to 1998 (%) - Other Race
Year householder moved into unit - Moved in 1990 to 1994 (%)
Year householder moved into unit - Moved in 1990 to 1994 (%) - White
Year householder moved into unit - Moved in 1990 to 1994 (%) - Black or African American
Year householder moved into unit - Moved in 1990 to 1994 (%) - Asian
Year householder moved into unit - Moved in 1990 to 1994 (%) - Hispanic or Latino
Year householder moved into unit - Moved in 1990 to 1994 (%) - American Indian and Alaska Native
Year householder moved into unit - Moved in 1990 to 1994 (%) - Multirace
Year householder moved into unit - Moved in 1990 to 1994 (%) - Other Race
Year householder moved into unit - Moved in 1980 to 1989 (%)
Year householder moved into unit - Moved in 1980 to 1989 (%) - White
Year householder moved into unit - Moved in 1980 to 1989 (%) - Black or African American
Year householder moved into unit - Moved in 1980 to 1989 (%) - Asian
Year householder moved into unit - Moved in 1980 to 1989 (%) - Hispanic or Latino
Year householder moved into unit - Moved in 1980 to 1989 (%) - American Indian and Alaska Native
Year householder moved into unit - Moved in 1980 to 1989 (%) - Multirace
Year householder moved into unit - Moved in 1980 to 1989 (%) - Other Race
Year householder moved into unit - Moved in 1970 to 1979 (%)
Year householder moved into unit - Moved in 1970 to 1979 (%) - White
Year householder moved into unit - Moved in 1970 to 1979 (%) - Black or African American
Year householder moved into unit - Moved in 1970 to 1979 (%) - Asian
Year householder moved into unit - Moved in 1970 to 1979 (%) - Hispanic or Latino
Year householder moved into unit - Moved in 1970 to 1979 (%) - American Indian and Alaska Native
Year householder moved into unit - Moved in 1970 to 1979 (%) - Multirace
Year householder moved into unit - Moved in 1970 to 1979 (%) - Other Race
Year householder moved into unit - Moved in 1969 or earlier (%)
Year householder moved into unit - Moved in 1969 or earlier (%) - White
Year householder moved into unit - Moved in 1969 or earlier (%) - Black or African American
Year householder moved into unit - Moved in 1969 or earlier (%) - Asian
Year householder moved into unit - Moved in 1969 or earlier (%) - Hispanic or Latino
Year householder moved into unit - Moved in 1969 or earlier (%) - American Indian and Alaska Native
Year householder moved into unit - Moved in 1969 or earlier (%) - Multirace
Year householder moved into unit - Moved in 1969 or earlier (%) - Other Race
Housing units lacking complete plumbing facilities (%)
Housing units lacking complete kitchen facilities (%)
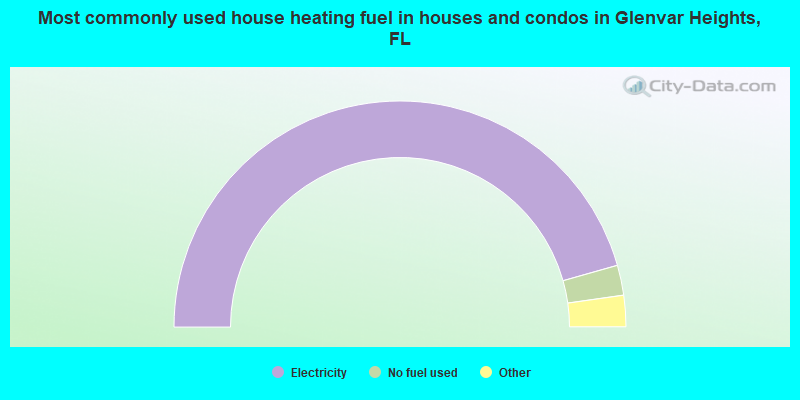
House heating fuel used in houses and condos - Utility gas (%)
House heating fuel used in houses and condos - Bottled, tank, or LP gas (%)
House heating fuel used in houses and condos - Electricity (%)
House heating fuel used in houses and condos - Fuel oil, kerosene, etc. (%)
House heating fuel used in houses and condos - Coal or coke (%)
House heating fuel used in houses and condos - Wood (%)
House heating fuel used in houses and condos - Solar energy (%)
House heating fuel used in houses and condos - Other fuel (%)
House heating fuel used in houses and condos - No fuel used (%)
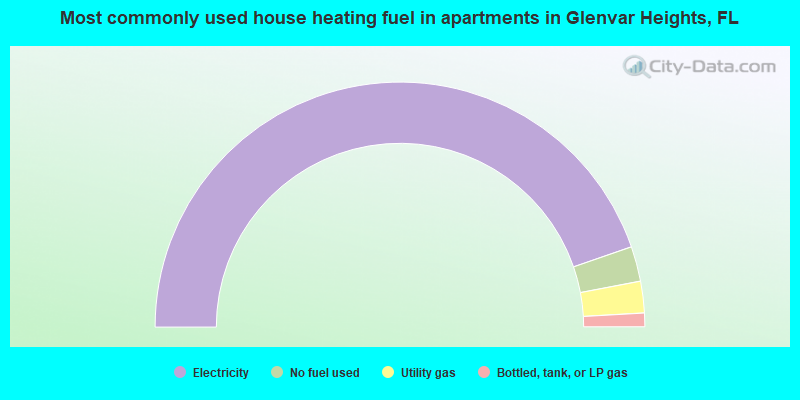
House heating fuel used in apartments - Utility gas (%)
House heating fuel used in apartments - Bottled, tank, or LP gas (%)
House heating fuel used in apartments - Electricity (%)
House heating fuel used in apartments - Fuel oil, kerosene, etc. (%)
House heating fuel used in apartments - Coal or coke (%)
House heating fuel used in apartments - Wood (%)
House heating fuel used in apartments - Solar energy (%)
House heating fuel used in apartments - Other fuel (%)
House heating fuel used in apartments - No fuel used (%)
Median year house/condo built: 1973Median year apartment built: 1981Household type by relationship:
Households: 17,806
Male householders: 3,759 (904 living alone ), Female householders: 4,449 (2,088 living alone )3,022 spouses (2,955 opposite-sex spouses ), 425 unmarried partners , (425 opposite-sex unmarried partners ), 4,575 children (4,448 natural , 88 adopted , 38 stepchildren ), 221 grandchildren , 185 brothers or sisters , 242 parents , 0 foster children , 305 other relatives , 563 non-relatives In group quarters: 53
Size of family households: 2,390 2-persons , 1,314 3-persons , 729 4-persons , 137 5-persons , 83 6-persons .
Size of nonfamily households: 3,207 1-person , 587 2-persons , 82 3-persons , 33 4-persons , 11 5-persons .
1,800 married couples with children. single-parent households (245 men , 894 women ).
29.2% of residents of Glenvar Heights speak English at home. of residents speak Spanish at home (68% speak English very well , 13% speak English well , 15% speak English not well , 4% don't speak English at all ).of residents speak other Indo-European language at home (75% speak English very well , 17% speak English well , 2% speak English not well , 7% don't speak English at all ).of residents speak Asian or Pacific Island language at home (45% speak English very well , 50% speak English well , 6% speak English not well ).of residents speak other language at home (89% speak English very well , 11% speak English well ).
Foreign born population: 8,265 (46.4%)of them are naturalized citizens )
Median number of rooms in houses and condos:
Median number of rooms in apartments
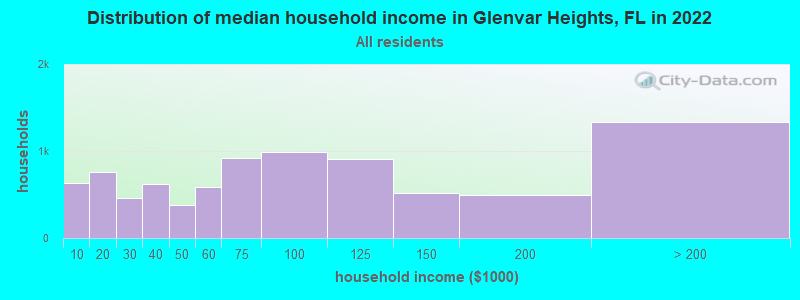
Glenvar Heights, FL household income distribution 636 Less than $10,000761 $10,000 to $19,999456 $20,000 to $29,999616 $30,000 to $39,999376 $40,000 to $49,999589 $50,000 to $59,999917 $60,000 to $74,999992 $75,000 to $99,999911 $100,000 to $124,999519 $125,000 to $149,999497 $150,000 to $199,9991,334 $200,000 or more
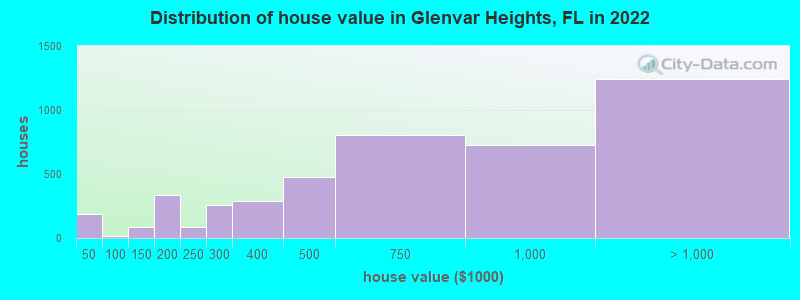
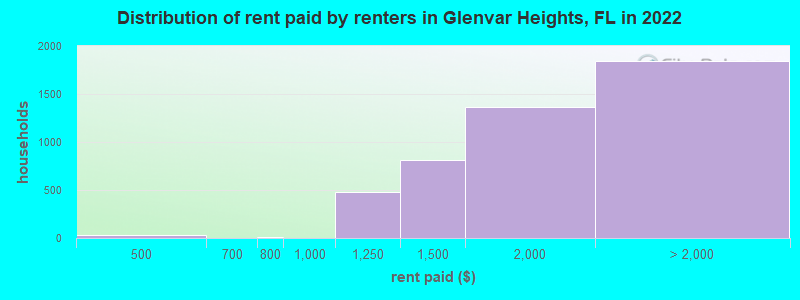
Home value of owner - occupied houses in 2022 in Glenvar Heights, FL 158 Less than $10,00029 $25,000 to $29,99912 $90,000 to $99,99918 $100,000 to $124,99969 $125,000 to $149,99946 $150,000 to $174,999287 $175,000 to $199,99982 $200,000 to $249,999258 $250,000 to $299,999290 $300,000 to $399,999480 $400,000 to $499,999803 $500,000 to $749,999729 $750,000 to $999,999462 $1,000,000 to $1,499,999451 $1,500,000 to $1,999,999327 $2,000,000 or moreRent paid by renters in 2022 in Glenvar Heights, FL 26 $450 to $49913 $750 to $799474 $1,000 to $1,249813 $1,250 to $1,4991,363 $1,500 to $1,999769 $2,000 to $2,499367 $2,500 to $2,999384 $3,000 to $3,499227 $3,500 or more92 No cash rent
Percentage of workers working in this county: 97.9%Number of people working at home: 1,693 (18.2% of all workers )
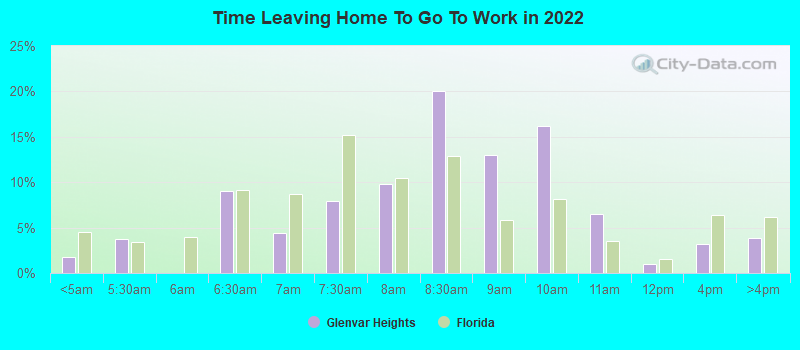
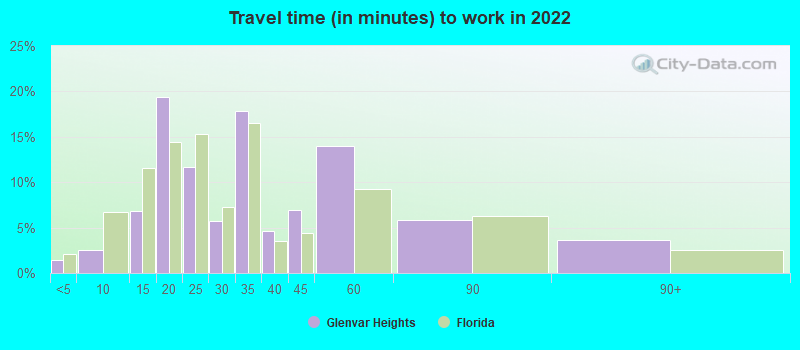
Travel time to work (commute)
Less than 5 minutes: 525 to 9 minutes: 42510 to 14 minutes: 75115 to 19 minutes: 1,33220 to 24 minutes: 1,10825 to 29 minutes: 68730 to 34 minutes: 1,51135 to 39 minutes: 27040 to 44 minutes: 47145 to 59 minutes: 74560 to 89 minutes: 35090 or more minutes: 40
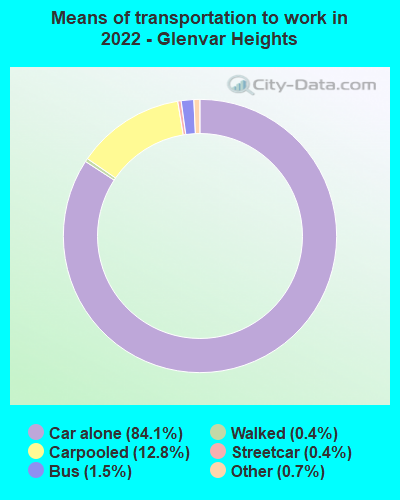
Means of transportation to work:
Drove a car alone: 7,489 (69.4%)Carpooled: 1,286 (11.9%)Bus : 128 (1.2%)Subway or elevated rail : 53 (0.5%)Taxi: 84 (0.8%)Bicycle: 7 (0.1%)Walked: 37 (0.3%)Worked at home: 1,693 (15.7%)
Unemployment by race in 2022
Unemployment rate for White non-Hispanic residents 0.2% MalesUnemployment rate for Black residents 17.8% Males4.1% FemalesUnemployment rate for other race residents 10.0% Males4.5% FemalesUnemployment rate for two or more race residents 8.2% Males0.6% FemalesUnemployment rate for Hispanic or Latino residents 5.1% Males1.7% Females
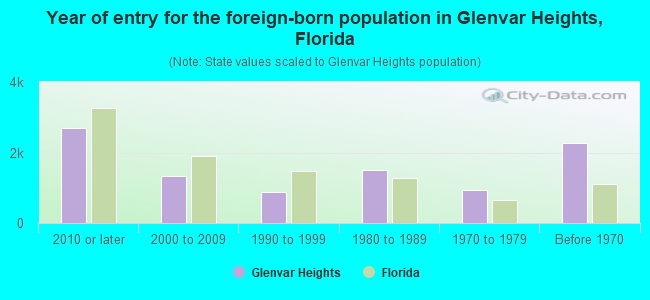
Year of entry for the foreign-born population in Glenvar Heights, Florida
2,684 2010 or later 1,347 2000 to 2009 888 1990 to 1999 1,512 1980 to 1989 930 1970 to 1979 2,263 Before 1970
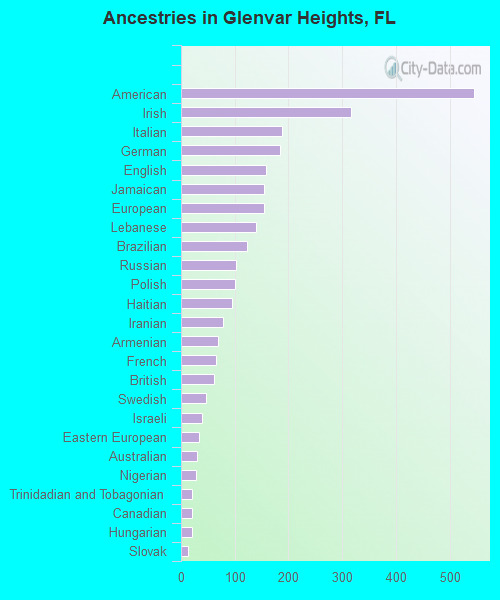
First ancestries reported:
American: 546 (5.0%)
Irish: 316 (2.9%)
Italian: 188 (1.7%)
German: 185 (1.7%)
English: 159 (1.5%)
Jamaican: 155 (1.4%)
European: 154 (1.4%)
Lebanese: 140 (1.3%)
Brazilian: 122 (1.1%)
Russian: 102 (0.9%)
Polish: 101 (0.9%)
Haitian: 94 (0.9%)
Iranian: 78 (0.7%)
Armenian: 69 (0.6%)
French: 66 (0.6%)
British: 61 (0.6%)
Swedish: 47 (0.4%)
Israeli: 40 (0.4%)
Eastern European: 34 (0.3%)
Australian: 29 (0.3%)
Nigerian: 27 (0.2%)
Trinidadian and Tobagonian: 21 (0.2%)
Canadian: 20 (0.2%)
Hungarian: 20 (0.2%)
Slovak: 13 (0.1%)
Scottish: 11 (0.1%)
Portuguese: 10 (0.09%)
Austrian: 8 (0.07%)
Palestinian: 6 (0.06%)
South African: 6 (0.06%) Most common places of birth for foreign-born residents (%): Cuba Glenvar Heights:
40.9% (3,378)Florida:
22.0% (1,006,576)
Colombia Glenvar Heights:
9.2% (764)Florida:
6.5% (298,669)
Nicaragua Glenvar Heights:
5.7% (472)Florida:
2.3% (105,066)
Venezuela Glenvar Heights:
5.6% (466)Florida:
5.7% (262,042)
Mexico Glenvar Heights:
4.4% (361)Florida:
5.6% (257,152)
Argentina Glenvar Heights:
2.7% (223)Florida:
1.3% (57,263)
Brazil Glenvar Heights:
2.6% (219)Florida:
2.7% (122,906)
China, excluding Hong Kong and Taiwan Glenvar Heights:
2.3% (193)Florida:
1.2% (56,071)
Dominican Republic Glenvar Heights:
2.3% (189)Florida:
3.0% (137,727)
Ecuador Glenvar Heights:
2.0% (168)Florida:
1.2% (54,585)
Peru Glenvar Heights:
1.9% (161)Florida:
2.1% (96,693)
Haiti Glenvar Heights:
1.5% (124)Florida:
7.5% (342,375)
Place of birth for U.S.-born residents:
This state: 5,753Other state: 2,943Northeast: 1,229Midwest: 648South: 790West: 274 87.8% of Glenvar Heights residents lived in the same house 1 years ago.
Out of people who lived in different houses, 38.8% lived in this county.
Out of people who lived in different counties, 29.7% lived in Florida.
Glenvar Heights:
87.8%State average:
86.3%
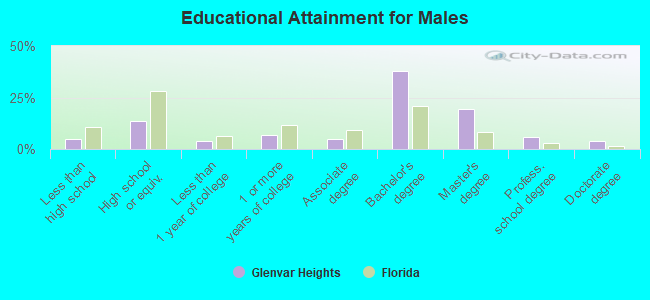
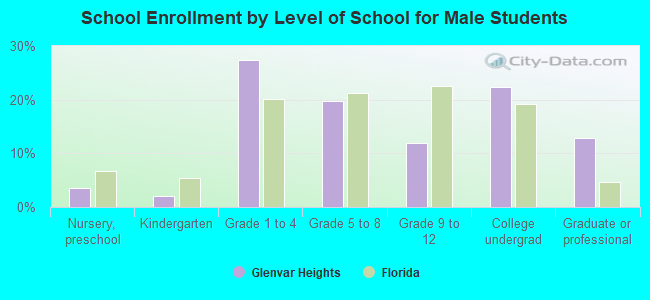
Education attainment for males 25 years and older:
No schooling: 125Nursery to 4th grade: 05th and 6th grade: 717th and 8th grade: 69th grade: 010th grade: 1811th grade: 012th grade, no diploma: 59High school graduate (or equivalency): 815Less than 1 year of college: 224Some college more than 1 year, no degree: 418Associate degree: 285Bachelor's degree: 2,262Master's degree: 1,159Professional school degree: 340Doctorate degree: 222
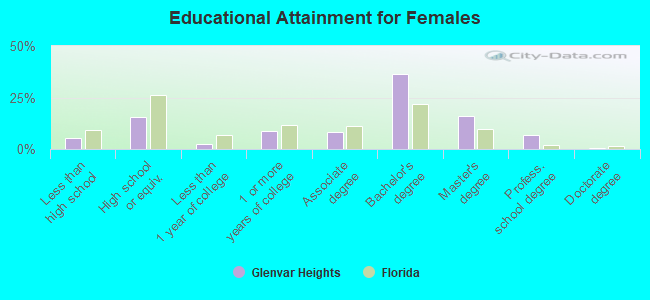
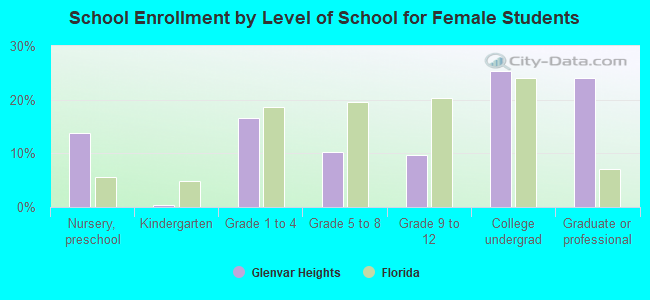
Education attainment for females 25 years and older:
No schooling: 196Nursery to 4th grade: 85th and 6th grade: 347th and 8th grade: 209th grade: 3510th grade: 1211th grade: 4912th grade, no diploma: 59High school graduate (or equivalency): 1,150Less than 1 year of college: 183Some college more than 1 year, no degree: 641Associate degree: 603Bachelor's degree: 2,725Master's degree: 1,201Professional school degree: 492Doctorate degree: 52
Housing units in structures:
One, detached: 2,326One, attached: 9193 or 4: 3265 to 9: 42910 to 19: 69720 to 49: 1,34650 or more: 3,289Mobile homes: 37Housing units lacking complete plumbing facilities in 2022: 0.2%Housing units lacking complete kitchen facilities in 2022: 0.6%House/condo owner moved in on average 14 years ago
Renter moved in on average 2 years ago
Private vs. public school enrollment:
Students in private schools in grades 1 to 8 (elementary and middle school): 419 Students in private schools in grades 9 to 12 (high school): 136 Students in private undergraduate colleges: 591