Housing density: 1,452 houses/condos per square mile
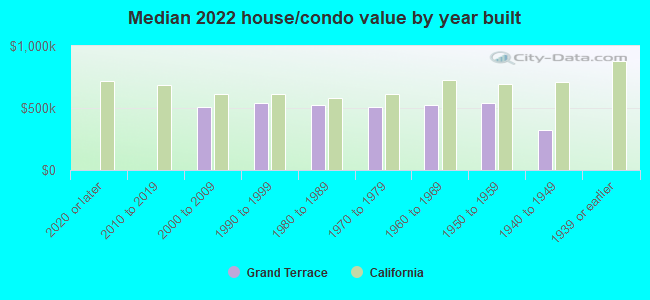
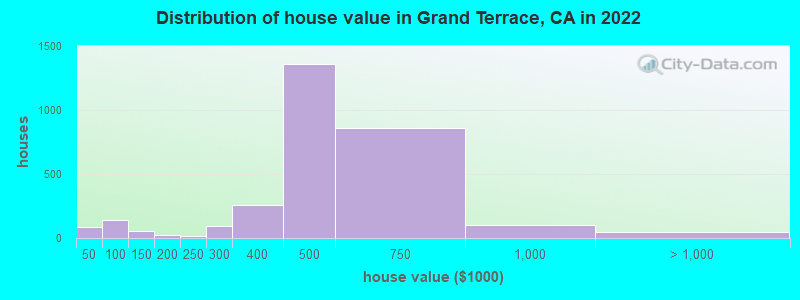
Median price asked for vacant for-sale houses and condos in 2022: $862,019.
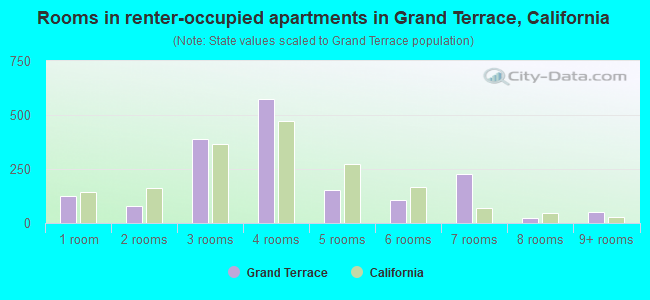
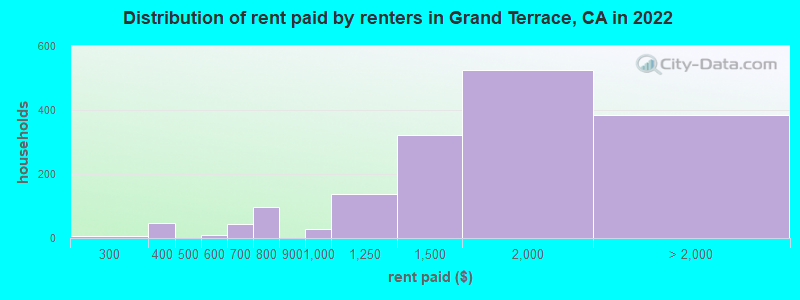
Median contract rent in 2022: $1,549 (lower quartile is $1,196, upper quartile is $1,935)
Median rent asked for vacant for-rent units in 2022: $1,387
Median gross rent in Grand Terrace, CA in 2022: $1,778
Housing units in Grand Terrace with a mortgage: 1,944 (189 second mortgage, 9 home equity loan, 148 both second mortgage and home equity loan) Houses without a mortgage: 27
Median household income for houses/condos with a mortgage: $127,278
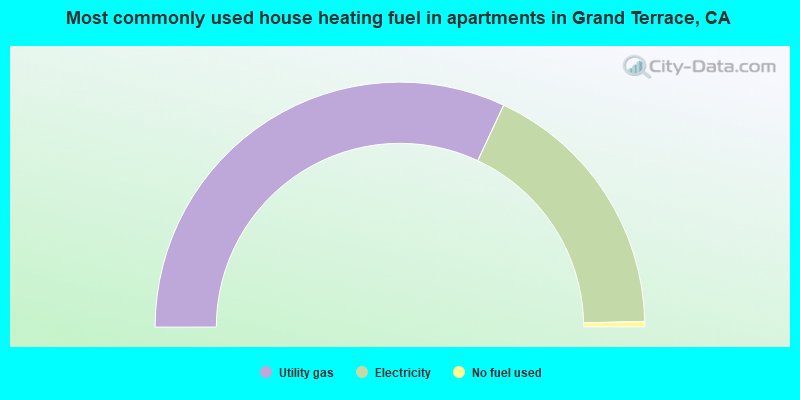
Median household income for apartments without a mortgage: $74,345
Median monthly housing costs: $1,680
Compare current foreclosures near Grand Terrace, CA:
1,256 married couples with children.
689 single-parent households (318 men, 371 women).
66.7% of residents of Grand Terrace speak English at home.
26.8% of residents speak Spanish at home (72% speak English very well, 13% speak English well, 8% speak English not well, 7% don't speak English at all).
1.6% of residents speak other Indo-European language at home (73% speak English very well, 27% speak English well).
3.3% of residents speak Asian or Pacific Island language at home (69% speak English very well, 23% speak English well, 6% speak English not well, 1% don't speak English at all).
0.6% of residents speak other language at home (58% speak English very well, 10% speak English well, 31% speak English not well).
Foreign born population: 1,560 (11.8%)
(62.2% of them are naturalized citizens)
Percentage of workers working in this county: 74.0% Number of people working at home: 557 (8.7% of all workers)
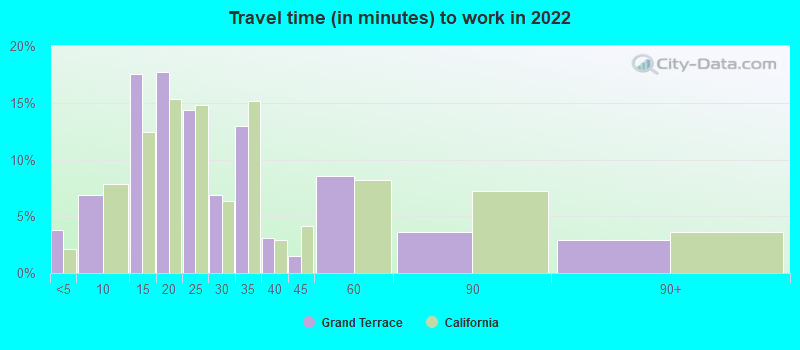
Travel time to work (commute)
Less than 5 minutes: 235
5 to 9 minutes: 357
10 to 14 minutes: 798
15 to 19 minutes: 997
20 to 24 minutes: 1,163
25 to 29 minutes: 273
30 to 34 minutes: 591
35 to 39 minutes: 121
40 to 44 minutes: 425
45 to 59 minutes: 439
60 to 89 minutes: 166
90 or more minutes: 256
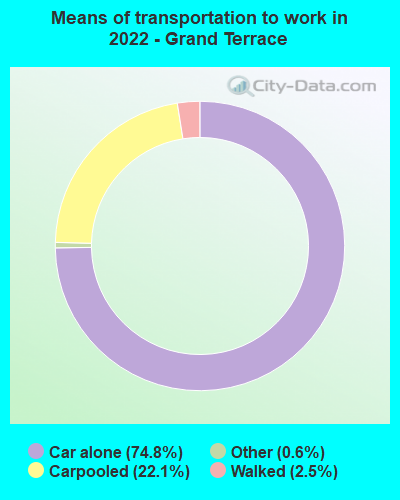
Means of transportation to work:
Drove a car alone: 2,389 (63.4%)
Carpooled: 759 (20.1%)
Subway or elevated rail: 1 (0.0%)
Taxi: 20 (0.5%)
Walked: 86 (2.3%)
Worked at home: 557 (14.8%)
Unemployment by race in 2022
Unemployment rate for White non-Hispanic residents
5.3%Males
3.5%Females
Unemployment rate for other race residents
6.8%Males
9.4%Females
Unemployment rate for two or more race residents
6.0%Males
35.8%Females
Unemployment rate for Hispanic or Latino residents
12.4%Males
10.5%Females
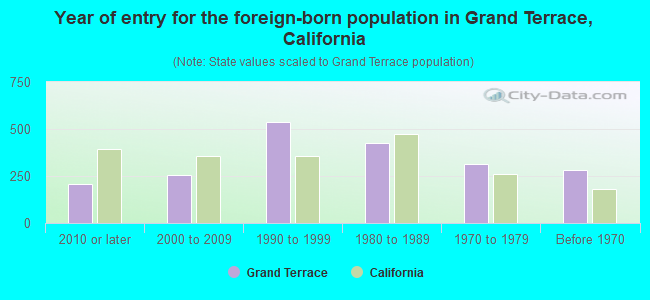
Year of entry for the foreign-born population in Grand Terrace, California
2052010 or later
2562000 to 2009
5351990 to 1999
4271980 to 1989
3131970 to 1979
282Before 1970
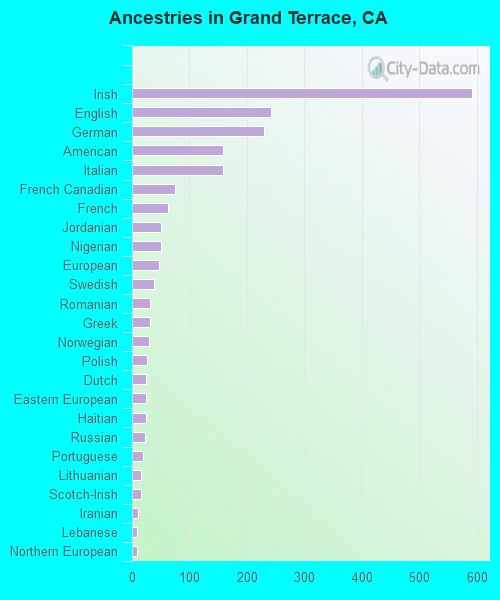
First ancestries reported:
Irish: 592 (7.8%)
English: 242 (3.2%)
German: 229 (3.0%)
American: 159 (2.1%)
Italian: 159 (2.1%)
French Canadian: 75 (1.0%)
French: 63 (0.8%)
Jordanian: 51 (0.7%)
Nigerian: 50 (0.7%)
European: 47 (0.6%)
Swedish: 38 (0.5%)
Romanian: 32 (0.4%)
Greek: 31 (0.4%)
Norwegian: 29 (0.4%)
Polish: 26 (0.3%)
Dutch: 25 (0.3%)
Eastern European: 25 (0.3%)
Haitian: 25 (0.3%)
Russian: 23 (0.3%)
Portuguese: 19 (0.3%)
Lithuanian: 15 (0.2%)
Scotch-Irish: 15 (0.2%)
Iranian: 11 (0.1%)
Lebanese: 9 (0.1%)
Northern European: 8 (0.1%)
British: 7 (0.09%)
Scottish: 7 (0.09%)
Scandinavian: 6 (0.08%)
Palestinian: 5 (0.07%)
African: 2 (0.03%)
Most common places of birth for foreign-born residents (%):
Mexico
Grand Terrace:
29.2% (444)
California:
37.2% (3,881,193)
Nicaragua
Grand Terrace:
9.5% (145)
California:
0.6% (58,161)
Guatemala
Grand Terrace:
8.6% (130)
California:
2.8% (290,436)
Oceania, n.e.c.
Grand Terrace:
6.3% (95)
California:
0.2% (18,925)
Other South America
Grand Terrace:
5.9% (90)
California:
0.0% (3,239)
El Salvador
Grand Terrace:
5.5% (83)
California:
4.2% (440,287)
Taiwan
Grand Terrace:
3.6% (55)
California:
1.7% (176,274)
Romania
Grand Terrace:
3.4% (51)
California:
0.2% (23,058)
China, excluding Hong Kong and Taiwan
Grand Terrace:
2.8% (43)
California:
6.6% (684,672)
Japan
Grand Terrace:
2.6% (39)
California:
1.0% (103,575)
Nigeria
Grand Terrace:
1.8% (28)
California:
0.3% (35,557)
India
Grand Terrace:
1.8% (27)
California:
5.2% (539,184)
Trinidad and Tobago
Grand Terrace:
1.8% (27)
California:
0.1% (5,643)
Sri Lanka
Grand Terrace:
1.6% (25)
California:
0.1% (11,287)
Germany
Grand Terrace:
1.6% (24)
California:
0.7% (73,304)
Philippines
Grand Terrace:
1.5% (23)
California:
7.8% (818,297)
Place of birth for U.S.-born residents:
This state: 9,814
Other state: 1,616
Northeast: 337
Midwest: 443
South: 406
West: 427
88.8% of Grand Terrace residents lived in the same house 1 years ago. Out of people who lived in different houses, 34.0% lived in this county. Out of people who lived in different counties, 76.1% lived in California.
Grand Terrace:
88.8%
State average:
88.9%
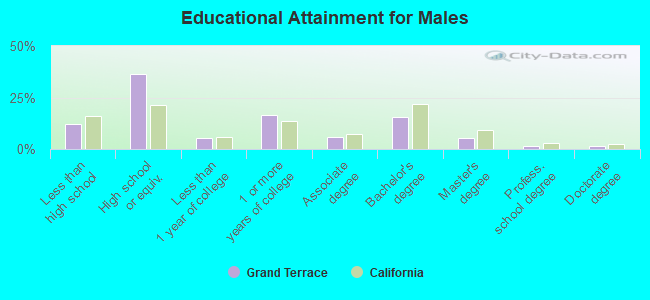
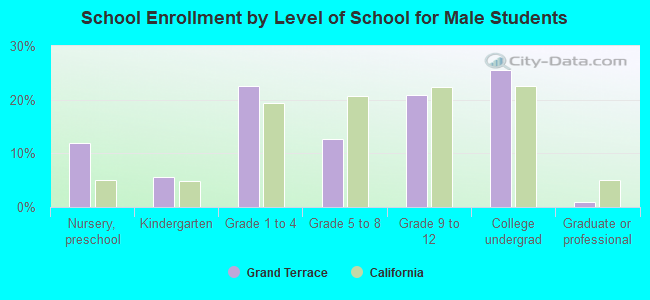
Education attainment for males 25 years and older:
No schooling: 228
Nursery to 4th grade: 0
5th and 6th grade: 42
7th and 8th grade: 21
9th grade: 10
10th grade: 90
11th grade: 49
12th grade, no diploma: 108
High school graduate (or equivalency): 1,655
Less than 1 year of college: 246
Some college more than 1 year, no degree: 762
Associate degree: 275
Bachelor's degree: 711
Master's degree: 242
Professional school degree: 60
Doctorate degree: 69
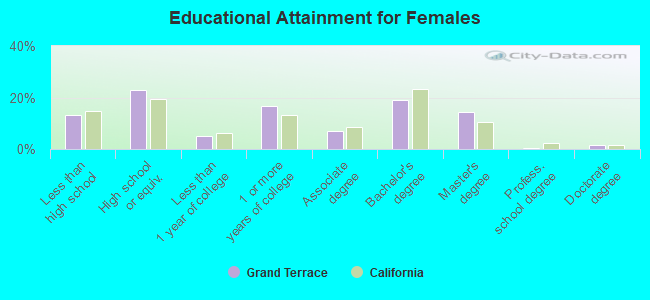
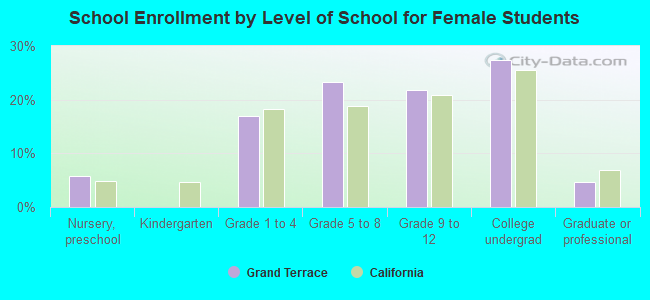
Education attainment for females 25 years and older:
No schooling: 133
Nursery to 4th grade: 12
5th and 6th grade: 67
7th and 8th grade: 27
9th grade: 69
10th grade: 61
11th grade: 195
12th grade, no diploma: 84
High school graduate (or equivalency): 1,119
Less than 1 year of college: 255
Some college more than 1 year, no degree: 811
Associate degree: 346
Bachelor's degree: 925
Master's degree: 702
Professional school degree: 22
Doctorate degree: 69
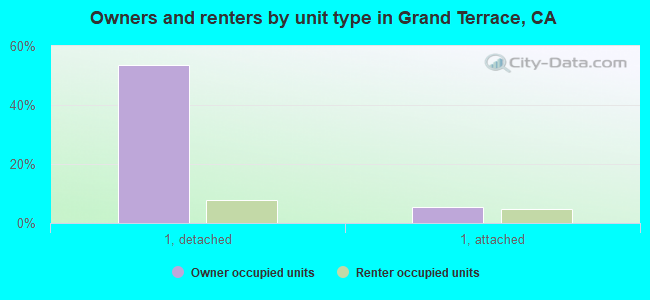
Housing units in structures:
One, detached: 2,971
One, attached: 360
3 or 4: 353
5 to 9: 188
10 to 19: 244
20 to 49: 206
50 or more: 334
Mobile homes: 375
Median worth of mobile homes: $69,736
Housing units lacking complete plumbing facilities in 2022: 2.1%
Housing units lacking complete kitchen facilities in 2022: 5.1%
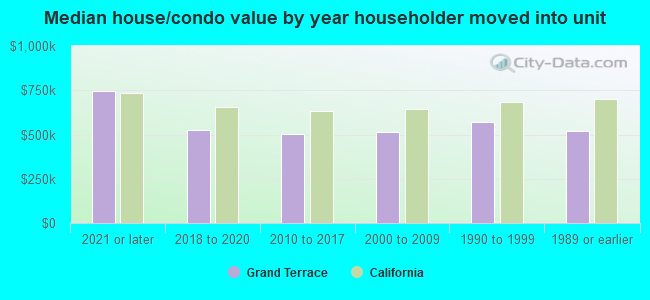
House/condo owner moved in on average 15 years ago