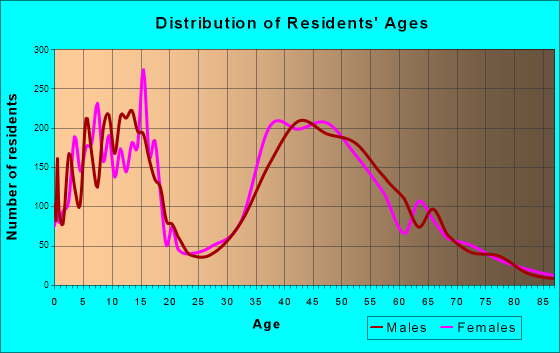
Granite Bay, CA (California) Houses and Residents
| Granite Bay: | $1,100,705 |
| California: | $715,900 |
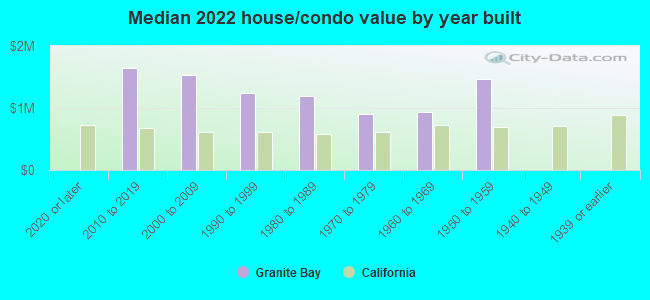
Mean price in 2022:
Detached houses: $1,220,936
Here: $1,220,936 State: $988,808 Townhouses or other attached units: $1,476,891
Here: $1,476,891 State: $838,546 Mobile homes: $50,720
Here: $50,720 State: $184,506
Total population: 20,402 (Urban population: 18,114, Rural population: 1,327 (all nonfarm))
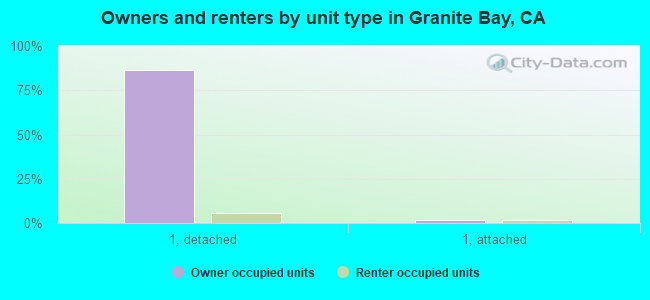
Houses: 8,250 (8,002 occupied: 7,440 owner occupied, 679 renter occupied)
| % of renters here: | 8% |
| State: | 44% |
Housing density: 382 houses/condos per square mile
Median price asked for vacant for-sale houses and condos in 2022: $6,307,838.
Median contract rent in 2022: $1,979 (lower quartile is $1,473, upper quartile is over $2,000)
Median rent asked for vacant for-rent units in 2022: $2,062
Median gross rent in Granite Bay, CA in 2022: over $2,000
Housing units in Granite Bay with a mortgage: 4,993 (752 second mortgage, 26 home equity loan, 696 both second mortgage and home equity loan)
Houses without a mortgage: 75
Median household income for houses/condos with a mortgage: $221,879
Median household income for apartments without a mortgage: $120,931
Median monthly housing costs: $2,948
Compare current foreclosures near Granite Bay, CA:
| Photo | Address | Area | Beds / Baths | Price | Details |
|---|---|---|---|---|---|

|
#1
S Lake Cir
Granite Bay, CA 95746
|
3,067 sq. feet
|
2 baths 4 beds |
show details | |

|
#2
Whispering Oak Cir
Granite Bay, CA 95746
|
2,277 sq. feet
|
2 baths 3 beds |
show details | |

|
#3
Ojai
Granite Bay, CA 95746
|
5,938 sq. feet
|
5 baths 4 beds |
show details | |

|
#4
Fenton Way
Granite Bay, CA 95746
|
3,957 sq. feet
|
3 baths 5 beds |
show details | |

|
#5
Barton Rd
Granite Bay, CA 95746
|
1,405 sq. feet
|
2 baths 3 beds |
show details | |

|
#6
Oak Creek Pl
Granite Bay, CA 95746
|
6,245 sq. feet
|
6 baths 6 beds |
show details | |

|
#7
Leona Way
Granite Bay, CA 95746
|
3,551 sq. feet
|
2 baths 3 beds |
show details | |

|
#8
Prewett Dr
Folsom, CA 95630
|
1,970 sq. feet
|
2 baths 4 beds |
$665,600
|
show details |

|
#9
Main Ave
Orangevale, CA 95662
|
1,160 sq. feet
|
2 baths 3 beds |
$535,000
|
show details |

|
#10
Marysville Blvd
Sacramento, CA 95838
|
1,314 sq. feet
|
1 baths 3 beds |
$298,000
|
show details |
| Photo | Address | Area | Beds / Baths | Price | Details |
|---|---|---|---|---|---|

|
#11
Vista De Lago Ct
Granite Bay, CA 95746
|
- sq. feet
|
- baths - beds |
show details | |

|
#12
Zachis Way
Antelope, CA 95843
|
1,577 sq. feet
|
2 baths 3 beds |
show details | |

|
#13
Mount Darwin Ct
Roseville, CA 95747
|
2,573 sq. feet
|
2 baths 4 beds |
show details | |

|
#14
Casa Alegre
Carmichael, CA 95608
|
1,166 sq. feet
|
2 baths 2 beds |
show details | |

|
#15
Sungarden Dr
Citrus Heights, CA 95610
|
1,643 sq. feet
|
2 baths 4 beds |
show details | |

|
#16
Hanks St
Sacramento, CA 95827
|
2,024 sq. feet
|
3 baths 5 beds |
show details | |

|
#17
Olivine Ave
Citrus Heights, CA 95610
|
2,464 sq. feet
|
3 baths 7 beds |
show details | |

|
#18
Hunters Glen Pl
Antelope, CA 95843
|
2,244 sq. feet
|
3 baths 4 beds |
show details | |

|
#19
Pine Nut Way
Sacramento, CA 95838
|
1,409 sq. feet
|
2 baths 3 beds |
show details | |

|
#20
Thores St
Rancho Cordova, CA 95670
|
1,652 sq. feet
|
2 baths 2 beds |
show details |
| Photo | Address | Area | Beds / Baths | Price | Details |
|---|---|---|---|---|---|

|
#21
Fair Oaks Blvd
Carmichael, CA 95608
|
2,221 sq. feet
|
2 baths 3 beds |
show details | |

|
#22
Oslo Ct
Antelope, CA 95843
|
1,765 sq. feet
|
3 baths 4 beds |
show details | |

|
#23
Talon Rd
Rocklin, CA 95765
|
1,806 sq. feet
|
2 baths 4 beds |
show details | |

|
#24
246 Lariat
Lincoln, CA 95648
|
1,815 sq. feet
|
2 baths 2 beds |
show details | |

|
#25
Singingwood Rd
Sacramento, CA 95864
|
1,494 sq. feet
|
2 baths 3 beds |
show details | |

|
#26
Vinci Ave
Sacramento, CA 95838
|
- sq. feet
|
2 baths 4 beds |
show details | |

|
#27
K St
Rio Linda, CA 95673
|
999 sq. feet
|
1 baths 2 beds |
show details | |

|
#28
Tanana River Ct
Citrus Heights, CA 95610
|
1,673 sq. feet
|
2 baths 3 beds |
show details | |

|
#29
Nawal Dr
El Dorado Hills, CA 95762
|
3,782 sq. feet
|
3 baths 4 beds |
show details | |

|
#30
Gaines Ave
Orangevale, CA 95662
|
1,740 sq. feet
|
2 baths 3 beds |
show details |
| Photo | Address | Area | Beds / Baths | Price | Details |
|---|---|---|---|---|---|

|
#31
Red Clover Way
Lincoln, CA 95648
|
1,343 sq. feet
|
2 baths 3 beds |
show details | |

|
#32
Muldrow Rd
Sacramento, CA 95841
|
1,449 sq. feet
|
2 baths 4 beds |
show details | |

|
#33
Zenith Dr
Citrus Heights, CA 95621
|
1,232 sq. feet
|
2 baths 3 beds |
show details | |

|
#34
Scotch Ct
Carmichael, CA 95608
|
2,086 sq. feet
|
3 baths 4 beds |
show details | |

|
#35
Meder Ct
Shingle Springs, CA 95682
|
3,572 sq. feet
|
3 baths 4 beds |
show details | |

|
#36
Greenberry Dr
Sacramento, CA 95841
|
1,449 sq. feet
|
2 baths 4 beds |
show details | |

|
#37
North Ave
Sacramento, CA 95838
|
828 sq. feet
|
1 baths 2 beds |
show details | |

|
#38
Meadow Creek Rd
Placerville, CA 95667
|
1,359 sq. feet
|
2 baths 3 beds |
show details | |

|
#39
Idle Creek Dr
Shingle Springs, CA 95682
|
1,360 sq. feet
|
2 baths 3 beds |
show details | |

|
#40
Perrara Ct
Roseville, CA 95747
|
- sq. feet
|
2 baths 4 beds |
show details |
| Photo | Address | Area | Beds / Baths | Price | Details |
|---|---|---|---|---|---|

|
#41
Immaculata Way
Sacramento, CA 95838
|
1,413 sq. feet
|
2 baths 4 beds |
show details | |

|
#42
Suffolk Way
Carmichael, CA 95608
|
1,875 sq. feet
|
2 baths 3 beds |
show details | |

|
#43
Westchester Way
Citrus Heights, CA 95621
|
1,464 sq. feet
|
2 baths 4 beds |
show details | |

|
#44
Fair Oaks Blvd
Fair Oaks, CA 95628
|
1,316 sq. feet
|
2 baths 3 beds |
show details | |

|
#45
Old Placerville Rd
Sacramento, CA 95827
|
1,092 sq. feet
|
2 baths 3 beds |
show details | |

|
#46
Pinehurst Dr
Roseville, CA 95747
|
4,723 sq. feet
|
3 baths 5 beds |
show details | |

|
#47
Silverton Way
Carmichael, CA 95608
|
1,164 sq. feet
|
1 baths 2 beds |
show details | |

|
#48
Remington Ave
Carmichael, CA 95608
|
1,273 sq. feet
|
1 baths 3 beds |
show details | |

|
#49
Jack London Ct
Roseville, CA 95747
|
2,015 sq. feet
|
3 baths 4 beds |
show details | |

|
Check over 1 million property listings on Foreclosure.com!
|
browse all offers | |||


 | Median Household Income Census Edition (33 replies) |
| Explain to me why highrise condos/apartments in Sacramento don't pencil out (87 replies) |
| Granite Bay Luxury Rentals / Executive Homes? (4 replies) |
| Suggestions for getting our first house (89 replies) |
| Folsom vs Granite Bay (22 replies) |
| High-Tech in Sacramento - Newcomers & Leaders (96 replies) |
Median year apartment built: 1991
Household type by relationship:
Households: 22,788- Male householders: 4,418 (422 living alone), Female householders: 3,525 (609 living alone)
5,955 spouses (5,938 opposite-sex spouses), 180 unmarried partners, (180 opposite-sex unmarried partners), 7,328 children (6,927 natural, 42 adopted, 359 stepchildren), 236 grandchildren, 45 brothers or sisters, 379 parents, 18 foster children, 256 other relatives, 302 non-relatives
- In group quarters: 142
Size of family households: 2,745 2-persons, 1,894 3-persons, 1,447 4-persons, 477 5-persons, 222 6-persons, 34 7-or-more-persons.
Size of nonfamily households: 1,088 1-person, 178 2-persons, 49 3-persons.
4,146 married couples with children.
591 single-parent households (311 men, 280 women).
87.4% of residents of Granite Bay speak English at home.
3.7% of residents speak Spanish at home (88% speak English very well, 4% speak English well, 7% speak English not well).
5.0% of residents speak other Indo-European language at home (84% speak English very well, 5% speak English well, 7% speak English not well, 3% don't speak English at all).
2.5% of residents speak Asian or Pacific Island language at home (82% speak English very well, 17% speak English well, 1% speak English not well).
1.4% of residents speak other language at home (80% speak English very well, 20% speak English well).
Foreign born population: 2,250 (9.9%)
(67.6% of them are naturalized citizens)
| Here: | 8.1 |
| State: | 6.0 |
| Here: | 5.2 |
| State: | 3.9 |
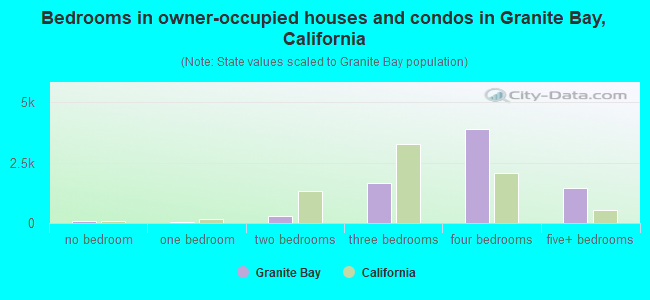
- Bedrooms in owner-occupied houses and condos in Granite Bay, California
- 77no bedroom
- 471 bedroom
- 2922 bedrooms
- 1,6723 bedrooms
- 3,8894 bedrooms
- 1,4635+ bedrooms
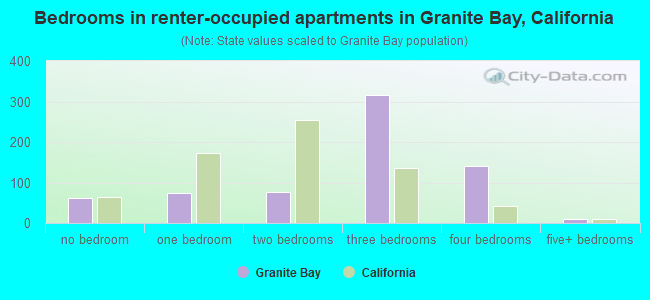
- Bedrooms in renter-occupied apartments in Granite Bay, California
- 62no bedroom
- 751 bedroom
- 772 bedrooms
- 3163 bedrooms
- 1414 bedrooms
- 95+ bedrooms
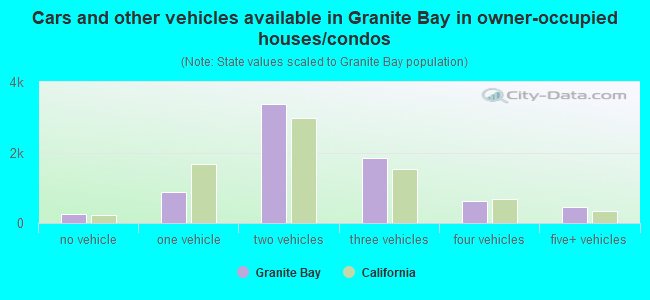
- Cars and other vehicles available in Granite Bay in owner-occupied houses/condos
- 243no vehicle
- 8861 vehicle
- 3,3702 vehicles
- 1,8553 vehicles
- 6384 vehicles
- 4485+ vehicles
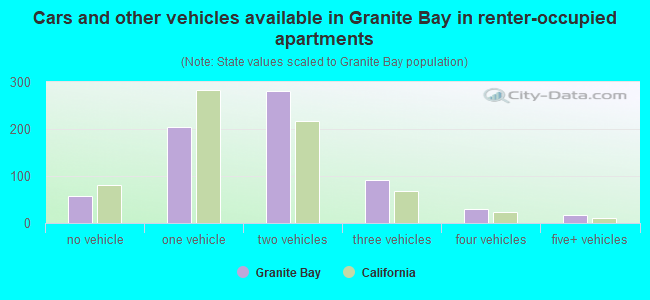
- Cars and other vehicles available in Granite Bay in renter-occupied apartments
- 58no vehicle
- 2041 vehicle
- 2802 vehicles
- 923 vehicles
- 294 vehicles
- 165+ vehicles
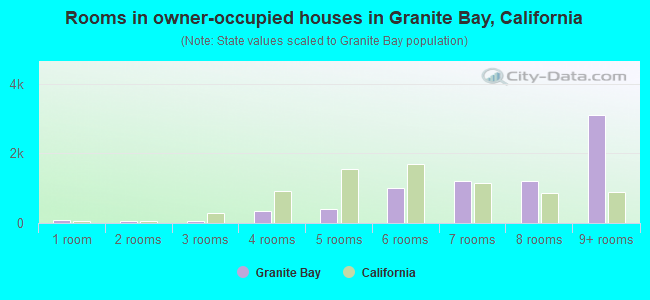
- Rooms in owner-occupied houses in Granite Bay, California
- 771 room
- 472 rooms
- 643 rooms
- 3384 rooms
- 4105 rooms
- 9926 rooms
- 1,2097 rooms
- 1,2058 rooms
- 3,0989+ rooms
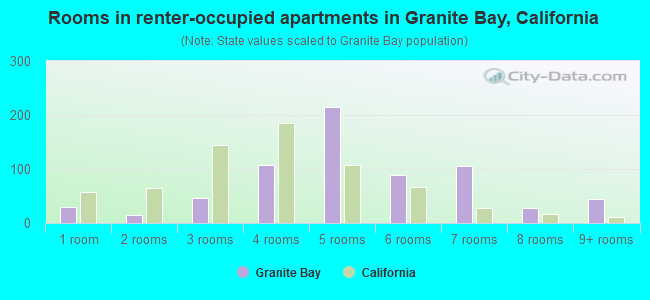
- Rooms in renter-occupied apartments in Granite Bay, California
- 291 room
- 152 rooms
- 473 rooms
- 1074 rooms
- 2145 rooms
- 886 rooms
- 1067 rooms
- 288 rooms
- 449+ rooms
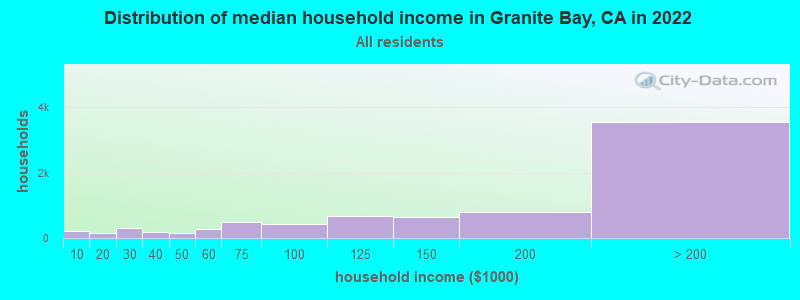
Granite Bay, CA household income distribution

- 227Less than $10,000
- 141$10,000 to $19,999
- 293$20,000 to $29,999
- 198$30,000 to $39,999
- 153$40,000 to $49,999
- 289$50,000 to $59,999
- 492$60,000 to $74,999
- 439$75,000 to $99,999
- 684$100,000 to $124,999
- 638$125,000 to $149,999
- 798$150,000 to $199,999
- 3,545$200,000 or more
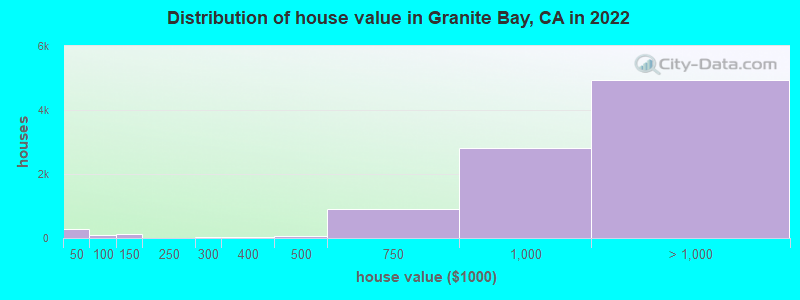
Home value of owner - occupied houses in 2022 in Granite Bay, CA
-
- 140Less than $10,000
- 45$10,000 to $14,999
- 19$15,000 to $19,999
- 13$30,000 to $34,999
- 43$35,000 to $39,999
- 24$40,000 to $49,999
- 61$50,000 to $59,999
- 18$90,000 to $99,999
- 133$100,000 to $124,999
- 23$250,000 to $299,999
- 29$300,000 to $399,999
- 72$400,000 to $499,999
- 914$500,000 to $749,999
- 2,813$750,000 to $999,999
- 2,872$1,000,000 to $1,499,999
- 1,355$1,500,000 to $1,999,999
- 724$2,000,000 or more
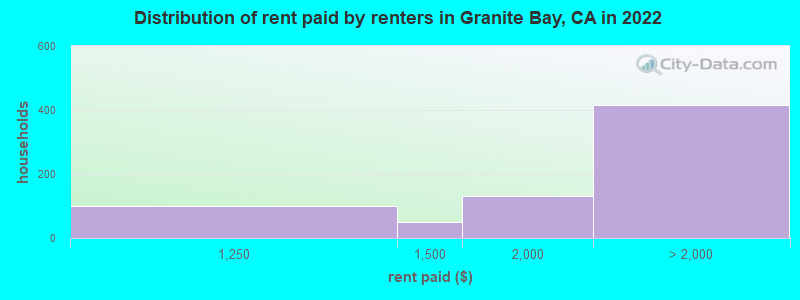
Rent paid by renters in 2022 in Granite Bay, CA
-
- 99$1,000 to $1,249
- 51$1,250 to $1,499
- 131$1,500 to $1,999
- 138$2,000 to $2,499
- 65$2,500 to $2,999
- 141$3,000 to $3,499
- 71No cash rent
Percentage of workers working in this county: 64.3%
Number of people working at home: 2,733 (26.5% of all workers)
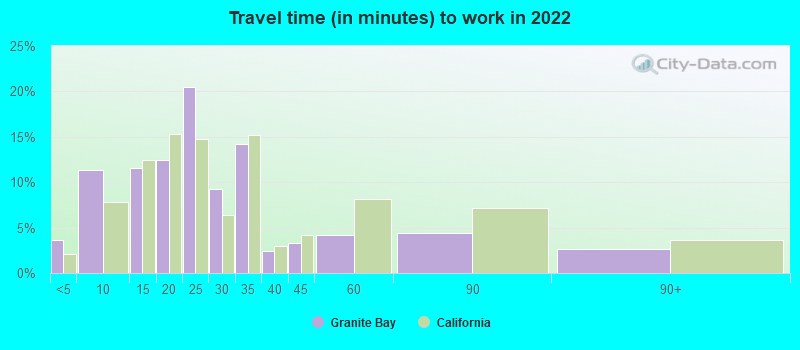
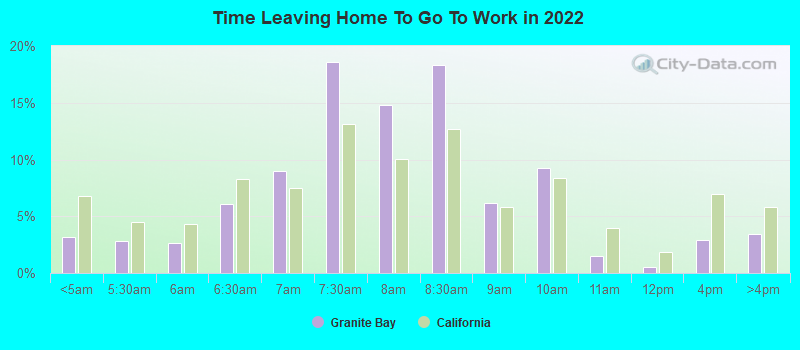
Travel time to work (commute)
- Less than 5 minutes: 199
- 5 to 9 minutes: 758
- 10 to 14 minutes: 790
- 15 to 19 minutes: 1,178
- 20 to 24 minutes: 1,087
- 25 to 29 minutes: 649
- 30 to 34 minutes: 952
- 35 to 39 minutes: 285
- 40 to 44 minutes: 296
- 45 to 59 minutes: 712
- 60 to 89 minutes: 294
- 90 or more minutes: 441
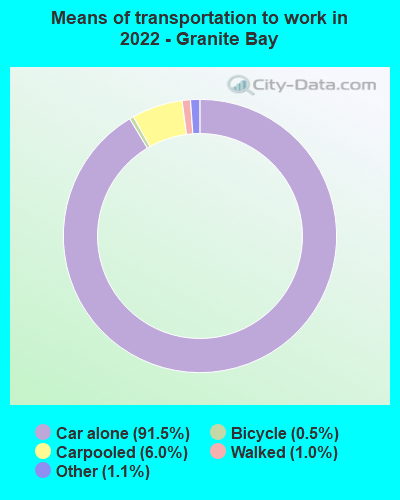
Means of transportation to work:
- Drove a car alone: 3,885 (56.1%)
- Carpooled: 314 (4.5%)
- Taxi: 61 (0.9%)
- Bicycle: 16 (0.2%)
- Walked: 75 (1.1%)
- Worked at home: 2,733 (39.5%)
- Unemployment by race in 2022
- Unemployment rate for White non-Hispanic residents
- 6.5%Males
- 2.6%Females
- Unemployment rate for Asian residents
- 4.8%Males
- Unemployment rate for other race residents
- 9.6%Males
- Unemployment rate for Hispanic or Latino residents
- 1.8%Males
- 2.3%Females
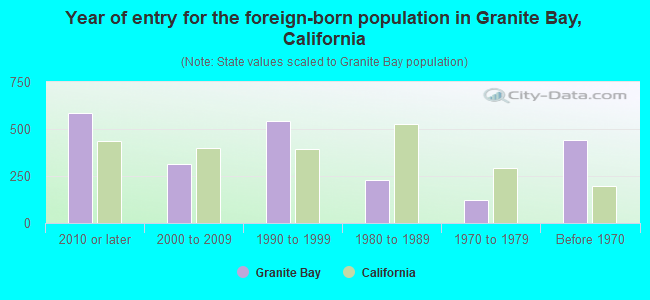
- Year of entry for the foreign-born population in Granite Bay, California
- 5832010 or later
- 3152000 to 2009
- 5451990 to 1999
- 2301980 to 1989
- 1241970 to 1979
- 444Before 1970
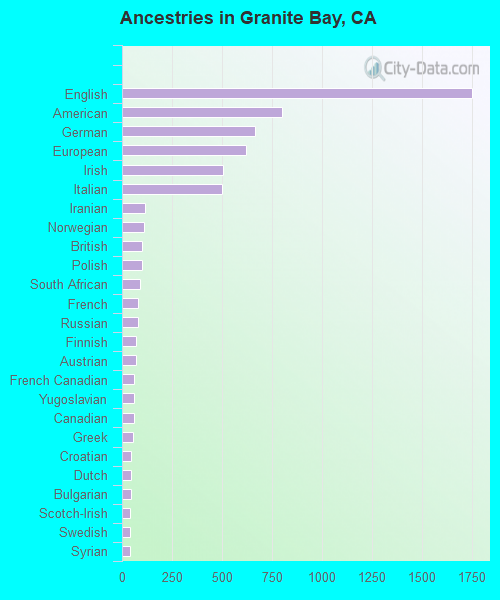
First ancestries reported:
- English: 1,748 (18.0%)
- American: 800 (8.2%)
- German: 663 (6.8%)
- European: 620 (6.4%)
- Irish: 504 (5.2%)
- Italian: 499 (5.1%)
- Iranian: 113 (1.2%)
- Norwegian: 109 (1.1%)
- British: 100 (1.0%)
- Polish: 100 (1.0%)
- South African: 92 (0.9%)
- French: 81 (0.8%)
- Russian: 78 (0.8%)
- Finnish: 72 (0.7%)
- Austrian: 72 (0.7%)
- French Canadian: 62 (0.6%)
- Yugoslavian: 62 (0.6%)
- Canadian: 61 (0.6%)
- Greek: 53 (0.5%)
- Croatian: 45 (0.5%)
- Dutch: 44 (0.5%)
- Bulgarian: 43 (0.4%)
- Scotch-Irish: 42 (0.4%)
- Swedish: 42 (0.4%)
- Syrian: 39 (0.4%)
- Serbian: 38 (0.4%)
- Ukrainian: 38 (0.4%)
- Scottish: 37 (0.4%)
- Danish: 31 (0.3%)
- Lithuanian: 25 (0.3%)
- Czech: 24 (0.2%)
- Portuguese: 23 (0.2%)
- Australian: 18 (0.2%)
- Scandinavian: 18 (0.2%)
- Eastern European: 17 (0.2%)
- Swiss: 15 (0.2%)
- Egyptian: 12 (0.1%)
- Hungarian: 11 (0.1%)
- Cypriot: 11 (0.1%)
- Northern European: 1 (0.01%)
- African: 1 (0.01%)
Most common places of birth for foreign-born residents (%):
| Granite Bay: | 16.8% (365) |
| California: | 5.2% (539,184) |
| Granite Bay: | 7.4% (162) |
| California: | 6.6% (684,672) |
| Granite Bay: | 4.9% (106) |
| California: | 2.0% (206,004) |
| Granite Bay: | 4.7% (103) |
| California: | 0.6% (57,953) |
| Granite Bay: | 4.6% (101) |
| California: | 7.8% (818,297) |
| Granite Bay: | 4.5% (99) |
| California: | 0.0% (1,613) |
| Granite Bay: | 4.3% (93) |
| California: | 0.2% (16,586) |
| Granite Bay: | 3.6% (78) |
| California: | 0.2% (20,614) |
| Granite Bay: | 3.5% (76) |
| California: | 37.2% (3,881,193) |
| Granite Bay: | 3.4% (74) |
| California: | 0.2% (20,997) |
| Granite Bay: | 3.3% (71) |
| California: | 3.0% (315,248) |
| Granite Bay: | 3.2% (69) |
| California: | 1.2% (127,477) |
| Granite Bay: | 3.1% (67) |
| California: | 4.9% (512,335) |
| Granite Bay: | 2.7% (58) |
| California: | 0.5% (49,399) |
| Granite Bay: | 2.6% (57) |
| California: | 0.1% (10,213) |
| Granite Bay: | 2.4% (53) |
| California: | 1.7% (176,274) |
| Granite Bay: | 2.3% (51) |
| California: | 0.7% (71,932) |
| Granite Bay: | 2.0% (43) |
| California: | 0.1% (9,442) |
| Granite Bay: | 1.6% (35) |
| California: | 0.2% (17,937) |
Place of birth for U.S.-born residents:
- This state: 13,994
- Other state: 6,059
- Northeast: 1,634
- Midwest: 1,930
- South: 869
- West: 1,567
89.5% of Granite Bay residents lived in the same house 1 years ago.
Out of people who lived in different houses, 21.2% lived in this county.
Out of people who lived in different counties, 94.2% lived in California.
| Granite Bay: | 89.5% |
| State average: | 88.9% |
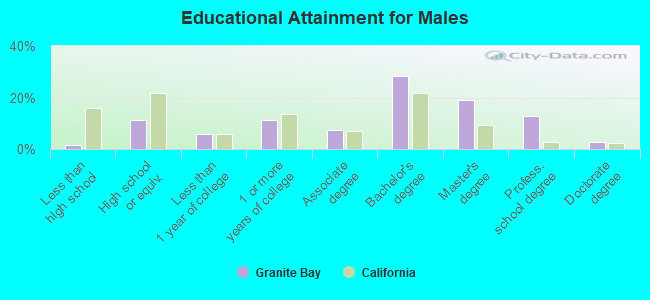
Education attainment for males 25 years and older:
- No schooling: 8
- Nursery to 4th grade: 0
- 5th and 6th grade: 0
- 7th and 8th grade: 4
- 9th grade: 1
- 10th grade: 6
- 11th grade: 60
- 12th grade, no diploma: 34
- High school graduate (or equivalency): 916
- Less than 1 year of college: 477
- Some college more than 1 year, no degree: 928
- Associate degree: 594
- Bachelor's degree: 2,324
- Master's degree: 1,573
- Professional school degree: 1,041
- Doctorate degree: 228
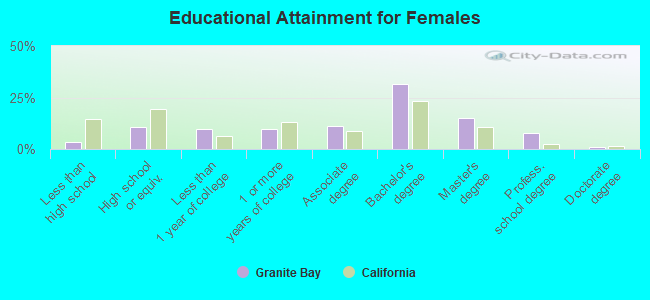
Education attainment for females 25 years and older:
- No schooling: 38
- Nursery to 4th grade: 0
- 5th and 6th grade: 25
- 7th and 8th grade: 0
- 9th grade: 0
- 10th grade: 0
- 11th grade: 16
- 12th grade, no diploma: 187
- High school graduate (or equivalency): 836
- Less than 1 year of college: 754
- Some college more than 1 year, no degree: 752
- Associate degree: 852
- Bachelor's degree: 2,436
- Master's degree: 1,155
- Professional school degree: 603
- Doctorate degree: 94
Housing units in structures:
- One, detached: 7,525
- One, attached: 233
- 3 or 4: 24
- 50 or more: 71
- Mobile homes: 395
Median worth of mobile homes: $50,326
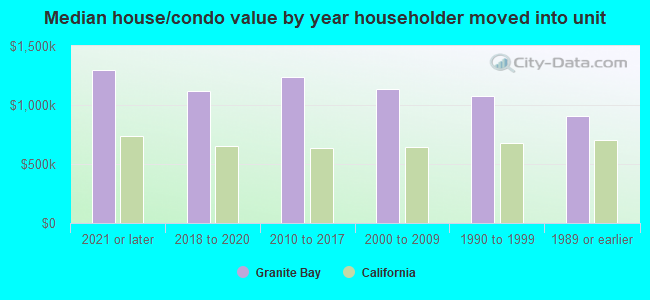
House/condo owner moved in on average 12 years ago
Renter moved in on average 2 years ago

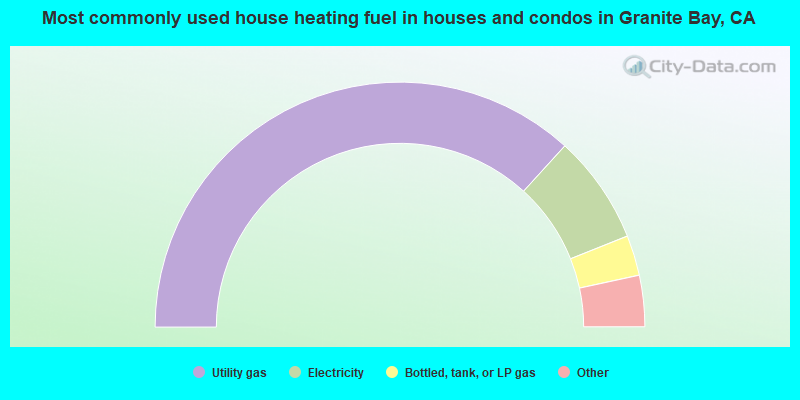
- 73.6%Utility gas
- 14.4%Electricity
- 5.3%Bottled, tank, or LP gas
- 2.6%Other fuel
- 2.3%Wood
- 1.9%Solar energy
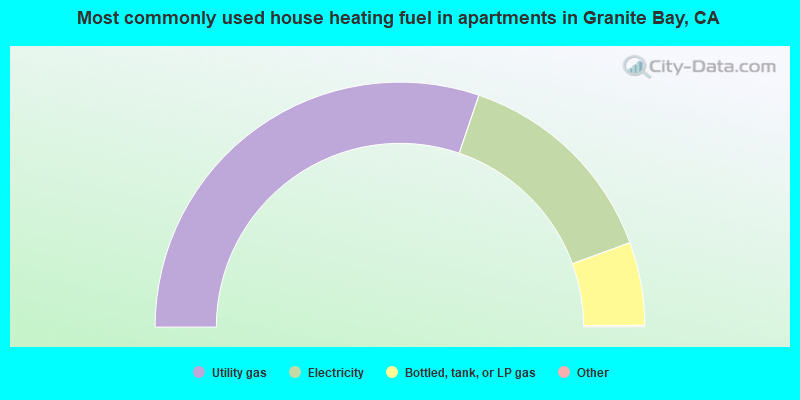
- 60.6%Utility gas
- 28.4%Electricity
- 11.0%Bottled, tank, or LP gas
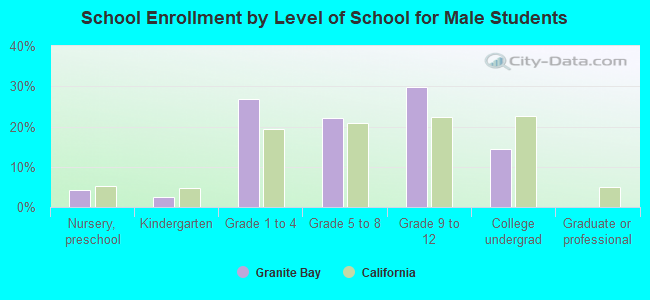
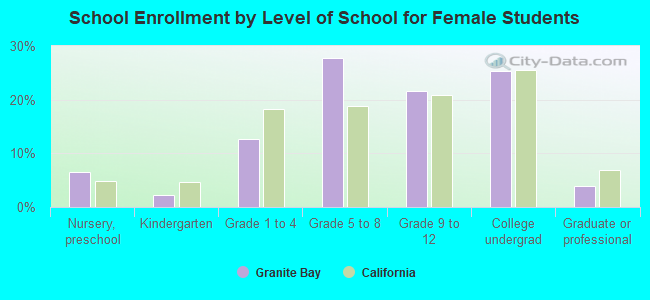
Private vs. public school enrollment:
| Here: | 16.3% |
| California: | 10.5% |
| Here: | 12.1% |
| California: | 8.5% |
| Here: | 27.2% |
| California: | 15.9% |