Greenacres, FL (Florida) Houses and Residents
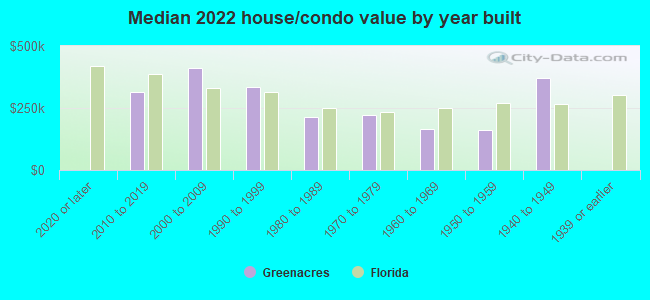
| Greenacres: | $263,425 |
| Florida: | $354,100 |
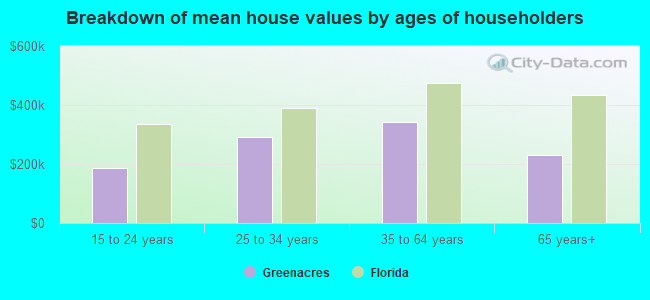
Mean price in 2022:
Detached houses: $410,938
Here: $410,938 State: $500,941 Townhouses or other attached units: $264,888
Here: $264,888 State: $370,869 In 2-unit structures: $257,359
Here: $257,359 State: $423,188 In 3-to-4-unit structures: $220,249
Here: $220,249 State: $309,944 In 5-or-more-unit structures: $150,539
Here: $150,539 State: $447,145 Mobile homes: $25,893
Here: $25,893 State: $113,202
Total population: 39,157 (Urban population: 27,269, Rural population: 0)
Houses: 18,096 (15,808 occupied: 10,197 owner occupied, 5,807 renter occupied)
| % of renters here: | 36% |
| State: | 33% |
Housing density: 3,884 houses/condos per square mile
Median price asked for vacant for-sale houses and condos in 2022: $153,102.
Median contract rent in 2022: $1,502 (lower quartile is $1,162, upper quartile is $1,915)
Median rent asked for vacant for-rent units in 2022: $2,729
Median gross rent in Greenacres, FL in 2022: $1,649
Housing units in Greenacres with a mortgage: 5,991 (348 second mortgage, 2 home equity loan, 221 both second mortgage and home equity loan)
Houses without a mortgage: 219
Median household income for houses/condos with a mortgage: $78,242
Median household income for apartments without a mortgage: $46,191
Median monthly housing costs: $1,376
Compare current foreclosures near Greenacres, FL:
| Photo | Address | Area | Beds / Baths | Price | Details |
|---|---|---|---|---|---|

|
#1
Poppy Pl 52-B
Delray Beach, FL 33484
|
1,220 sq. feet
|
2 baths 2 beds |
$204,000
|
show details |

|
#2
Northgreen Dr
Lake Worth, FL 33449
|
2,929 sq. feet
|
3 baths 3 beds |
$765,000
|
show details |

|
#3
Westgate Ln Apt D
Boynton Beach, FL 33436
|
1,808 sq. feet
|
2 baths 2 beds |
$165,000
|
show details |

|
#4
Briarwood Cir Apt 4
Boynton Beach, FL 33437
|
2,227 sq. feet
|
2 baths 2 beds |
$338,000
|
show details |

|
#5
Andros Rd
Lake Worth, FL 33461
|
1,100 sq. feet
|
1 baths 3 beds |
$1
|
show details |

|
#6
El Camino Real
West Palm Beach, FL 33409
|
2,122 sq. feet
|
2 baths 3 beds |
$1
|
show details |

|
#7
East Rd Apt 6j
Delray Beach, FL 33483
|
1,399 sq. feet
|
2 baths 2 beds |
show details | |

|
#8
Red Hibiscus Blvd Apt D
Delray Beach, FL 33445
|
1,167 sq. feet
|
2 baths 2 beds |
show details | |

|
#9
Lantern Key Dr
Lake Worth, FL 33463
|
2,242 sq. feet
|
2 baths 4 beds |
show details | |

|
#10
B Rd
Loxahatchee, FL 33470
|
1,427 sq. feet
|
2 baths - beds |
$1
|
show details |
| Photo | Address | Area | Beds / Baths | Price | Details |
|---|---|---|---|---|---|

|
#11
Alto Rd
Lake Worth, FL 33462
|
982 sq. feet
|
2 baths 3 beds |
show details | |

|
#12
2nd Ct
Palm Beach Gardens, FL 33410
|
1,236 sq. feet
|
2 baths 2 beds |
show details | |

|
#13
Tyringham Dr
West Palm Beach, FL 33406
|
1,656 sq. feet
|
2 baths 3 beds |
show details | |

|
#14
NW 7th St
Boynton Beach, FL 33426
|
1,678 sq. feet
|
2 baths 3 beds |
show details | |

|
#15
SW 8th Ave
Boynton Beach, FL 33435
|
928 sq. feet
|
2 baths 3 beds |
show details | |

|
#16
Concordia Ln
Boynton Beach, FL 33436
|
1,716 sq. feet
|
2 baths 3 beds |
show details | |

|
#17
Sabal Lake Dr
Boca Raton, FL 33434
|
1,104 sq. feet
|
1 baths 1 beds |
show details | |

|
#18
57th St
West Palm Beach, FL 33407
|
1,915 sq. feet
|
2 baths 4 beds |
show details | |

|
#19
SW 11th Ave
Delray Beach, FL 33444
|
1,196 sq. feet
|
2 baths 3 beds |
show details | |

|
#20
Paradise Trl
Loxahatchee, FL 33470
|
1,056 sq. feet
|
2 baths 3 beds |
show details |
| Photo | Address | Area | Beds / Baths | Price | Details |
|---|---|---|---|---|---|

|
#21
Alfred Dr
West Palm Beach, FL 33417
|
1,250 sq. feet
|
2 baths 2 beds |
show details | |

|
#22
Holly Lake Dr
Lake Worth, FL 33463
|
1,646 sq. feet
|
2 baths 3 beds |
show details | |

|
#23
W Prestwich Dr
Loxahatchee, FL 33470
|
1,964 sq. feet
|
2 baths 3 beds |
show details | |

|
#24
SW 16th St
Boynton Beach, FL 33426
|
1,427 sq. feet
|
2 baths 2 beds |
show details | |

|
#25
Glenmoor Dr
West Palm Beach, FL 33409
|
980 sq. feet
|
2 baths 2 beds |
show details | |

|
#26
Hillcrest Dr
Lake Worth, FL 33461
|
2,229 sq. feet
|
3 baths 5 beds |
show details | |

|
#27
Abbey Ln Apt 208
Delray Beach, FL 33446
|
1,006 sq. feet
|
2 baths 2 beds |
show details | |

|
#28
36th St
West Palm Beach, FL 33407
|
1,174 sq. feet
|
1 baths 2 beds |
show details | |

|
#29
Burgundy O
Delray Beach, FL 33484
|
907 sq. feet
|
2 baths 2 beds |
show details | |

|
#30
Palm Rd
West Palm Beach, FL 33406
|
- sq. feet
|
2 baths 3 beds |
show details |
| Photo | Address | Area | Beds / Baths | Price | Details |
|---|---|---|---|---|---|

|
#31
Forsythia Cir
Delray Beach, FL 33484
|
875 sq. feet
|
2 baths 1 beds |
show details | |

|
#32
Duval Ave
West Palm Beach, FL 33411
|
1,672 sq. feet
|
2 baths 3 beds |
show details | |

|
#33
Red Hibiscus Blvd 34-D
Delray Beach, FL 33445
|
1,167 sq. feet
|
2 baths 2 beds |
show details | |

|
#34
Executive Center Dr Apt 205
West Palm Beach, FL 33401
|
949 sq. feet
|
2 baths 2 beds |
show details | |

|
#35
140th Ave N
West Palm Beach, FL 33412
|
4,311 sq. feet
|
3 baths 4 beds |
show details | |

|
#36
Ambach Way
Lake Worth, FL 33462
|
1,243 sq. feet
|
2 baths 2 beds |
show details | |

|
#37
Commodore Ct
West Palm Beach, FL 33411
|
1,202 sq. feet
|
2 baths 3 beds |
show details | |

|
#38
Palm Forest Dr N
Delray Beach, FL 33445
|
1,342 sq. feet
|
2 baths 3 beds |
show details | |

|
#39
Paw Paw Cay
West Palm Beach, FL 33411
|
2,009 sq. feet
|
2 baths 3 beds |
show details | |

|
#40
Hickory Trl
West Palm Beach, FL 33414
|
1,554 sq. feet
|
2 baths 3 beds |
show details |
| Photo | Address | Area | Beds / Baths | Price | Details |
|---|---|---|---|---|---|

|
#41
Malayan Dr # 94d
Delray Beach, FL 33445
|
982 sq. feet
|
1 baths 2 beds |
show details | |

|
#42
Viburnum Cir
Delray Beach, FL 33484
|
948 sq. feet
|
2 baths 2 beds |
show details | |

|
#43
Bridgeport Dr
West Palm Beach, FL 33411
|
1,510 sq. feet
|
2 baths 3 beds |
show details | |

|
#44
Yacht Club Way Apt 305
Lake Worth, FL 33462
|
1,105 sq. feet
|
2 baths 2 beds |
show details | |

|
#45
Bobbie Ln
Royal Palm Beach, FL 33411
|
1,199 sq. feet
|
1 baths 2 beds |
show details | |

|
#46
Irma Lake Dr
West Palm Beach, FL 33411
|
2,084 sq. feet
|
2 baths 4 beds |
show details | |

|
#47
Hammock Park Rd
West Palm Beach, FL 33411
|
2,820 sq. feet
|
3 baths 3 beds |
show details | |

|
#48
Regal Ct S
West Palm Beach, FL 33414
|
1,577 sq. feet
|
2 baths 2 beds |
show details | |

|
#49
Bollard Rd
West Palm Beach, FL 33411
|
3,414 sq. feet
|
4 baths 4 beds |
show details | |

|
Check over 1 million property listings on Foreclosure.com!
|
browse all offers | |||

Latest news about housing in Greenacres, FL collected exclusively by city-data.com from local newspapers, TV, and radio stations


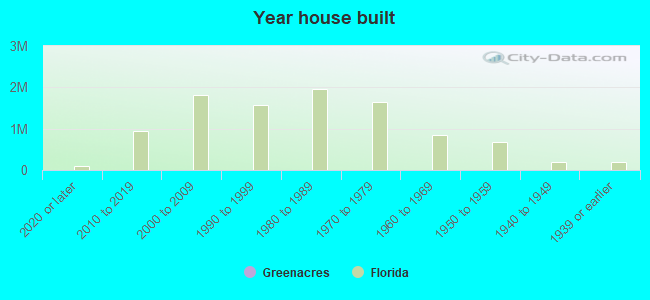
Median year apartment built: 1988
Household type by relationship:
Households: 44,342- Male householders: 7,371 (1,651 living alone), Female householders: 8,409 (2,258 living alone)
6,472 spouses (6,312 opposite-sex spouses), 1,030 unmarried partners, (1,015 opposite-sex unmarried partners), 13,877 children (13,106 natural, 311 adopted, 459 stepchildren), 578 grandchildren, 1,142 brothers or sisters, 1,447 parents, 107 foster children, 1,771 other relatives, 1,981 non-relatives
- In group quarters: 151
Size of family households: 4,558 2-persons, 2,994 3-persons, 1,942 4-persons, 1,116 5-persons, 173 6-persons, 265 7-or-more-persons.
Size of nonfamily households: 4,021 1-person, 718 2-persons, 95 3-persons, 13 4-persons, 176 5-persons.
4,569 married couples with children.
3,307 single-parent households (498 men, 2,809 women).
44.3% of residents of Greenacres speak English at home.
38.2% of residents speak Spanish at home (48% speak English very well, 20% speak English well, 20% speak English not well, 12% don't speak English at all).
15.8% of residents speak other Indo-European language at home (63% speak English very well, 17% speak English well, 11% speak English not well, 10% don't speak English at all).
1.2% of residents speak Asian or Pacific Island language at home (48% speak English very well, 29% speak English well, 20% speak English not well, 3% don't speak English at all).
0.5% of residents speak other language at home (29% speak English very well, 71% don't speak English at all).
Foreign born population: 19,152 (43.2%)
(58.3% of them are naturalized citizens)
| Here: | 5.3 |
| State: | 5.9 |
| Here: | 4.6 |
| State: | 4.2 |
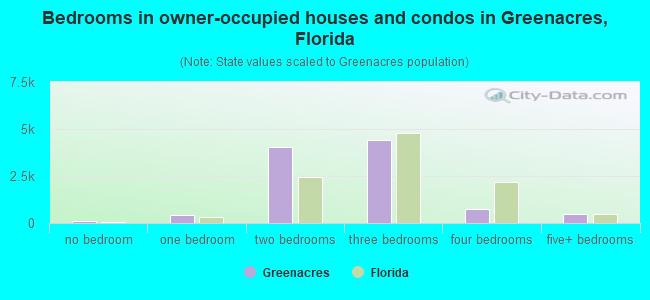
- Bedrooms in owner-occupied houses and condos in Greenacres, Florida
- 96no bedroom
- 4211 bedroom
- 4,0422 bedrooms
- 4,4363 bedrooms
- 7344 bedrooms
- 4695+ bedrooms
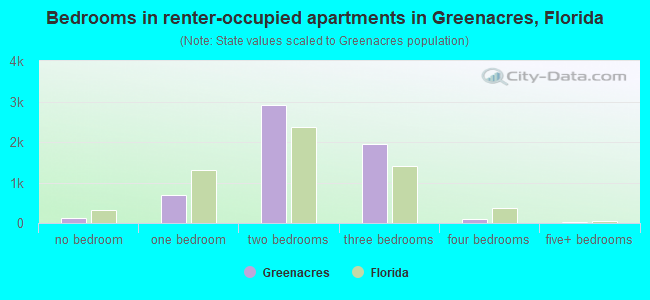
- Bedrooms in renter-occupied apartments in Greenacres, Florida
- 134no bedroom
- 6991 bedroom
- 2,9062 bedrooms
- 1,9513 bedrooms
- 914 bedrooms
- 275+ bedrooms
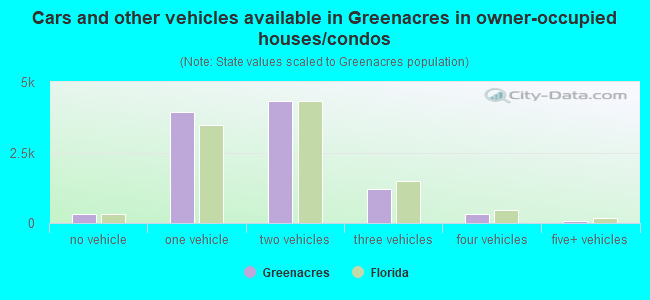
- Cars and other vehicles available in Greenacres in owner-occupied houses/condos
- 312no vehicle
- 3,9521 vehicle
- 4,3202 vehicles
- 1,2153 vehicles
- 3164 vehicles
- 825+ vehicles
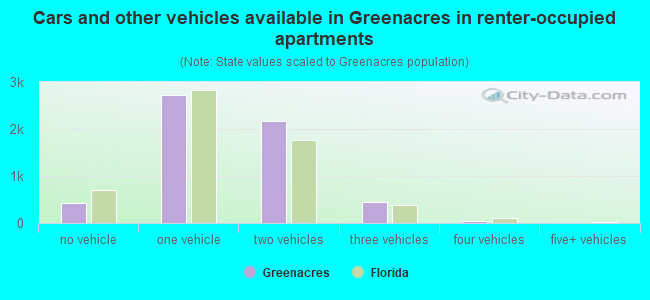
- Cars and other vehicles available in Greenacres in renter-occupied apartments
- 427no vehicle
- 2,7191 vehicle
- 2,1762 vehicles
- 4543 vehicles
- 324 vehicles
- 05+ vehicles
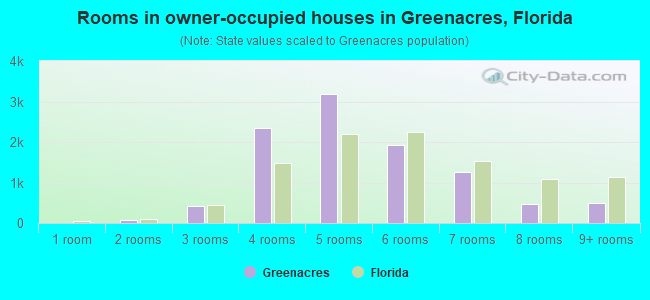
- Rooms in owner-occupied houses in Greenacres, Florida
- 121 room
- 782 rooms
- 4263 rooms
- 2,3454 rooms
- 3,1765 rooms
- 1,9346 rooms
- 1,2657 rooms
- 4588 rooms
- 5039+ rooms
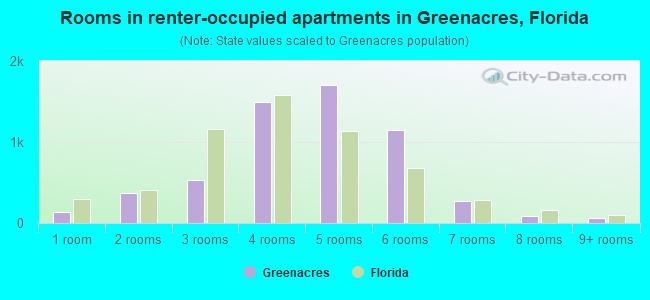
- Rooms in renter-occupied apartments in Greenacres, Florida
- 1341 room
- 3662 rooms
- 5343 rooms
- 1,4994 rooms
- 1,7085 rooms
- 1,1496 rooms
- 2777 rooms
- 838 rooms
- 589+ rooms
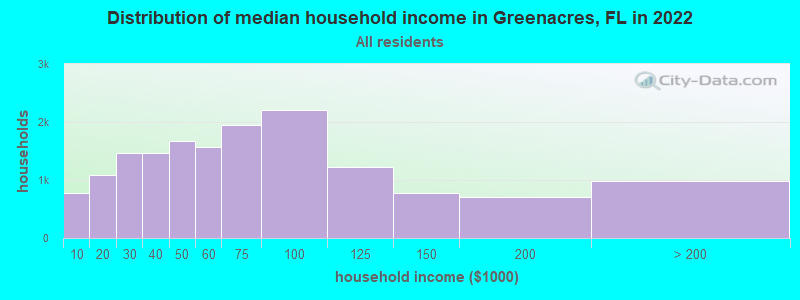
Greenacres, FL household income distribution

- 773Less than $10,000
- 1,094$10,000 to $19,999
- 1,465$20,000 to $29,999
- 1,473$30,000 to $39,999
- 1,674$40,000 to $49,999
- 1,573$50,000 to $59,999
- 1,952$60,000 to $74,999
- 2,203$75,000 to $99,999
- 1,216$100,000 to $124,999
- 782$125,000 to $149,999
- 706$150,000 to $199,999
- 984$200,000 or more
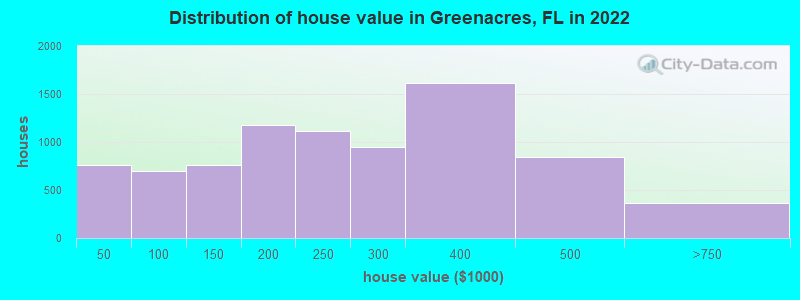
Home value of owner - occupied houses in 2022 in Greenacres, FL
-
- 190Less than $10,000
- 76$10,000 to $14,999
- 30$15,000 to $19,999
- 161$20,000 to $24,999
- 5$25,000 to $29,999
- 27$30,000 to $34,999
- 193$35,000 to $39,999
- 76$40,000 to $49,999
- 66$50,000 to $59,999
- 35$60,000 to $69,999
- 314$70,000 to $79,999
- 41$80,000 to $89,999
- 168$90,000 to $99,999
- 329$100,000 to $124,999
- 430$125,000 to $149,999
- 507$150,000 to $174,999
- 674$175,000 to $199,999
- 1,113$200,000 to $249,999
- 945$250,000 to $299,999
- 1,609$300,000 to $399,999
- 839$400,000 to $499,999
- 348$500,000 to $749,999
- 15$2,000,000 or more
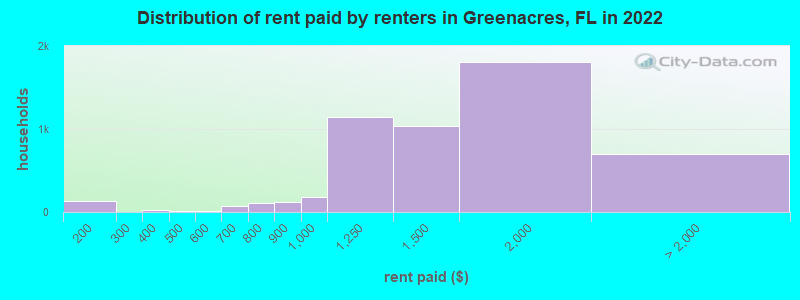
Rent paid by renters in 2022 in Greenacres, FL
-
- 85$100 to $149
- 48$150 to $199
- 20$300 to $349
- 9$400 to $449
- 8$550 to $599
- 24$600 to $649
- 46$650 to $699
- 58$700 to $749
- 52$750 to $799
- 122$800 to $899
- 178$900 to $999
- 1,143$1,000 to $1,249
- 1,037$1,250 to $1,499
- 1,810$1,500 to $1,999
- 282$2,000 to $2,499
- 92$2,500 to $2,999
- 111$3,500 or more
- 212No cash rent
Percentage of workers working in this county: 94.7%
Number of people working at home: 1,210 (5.5% of all workers)
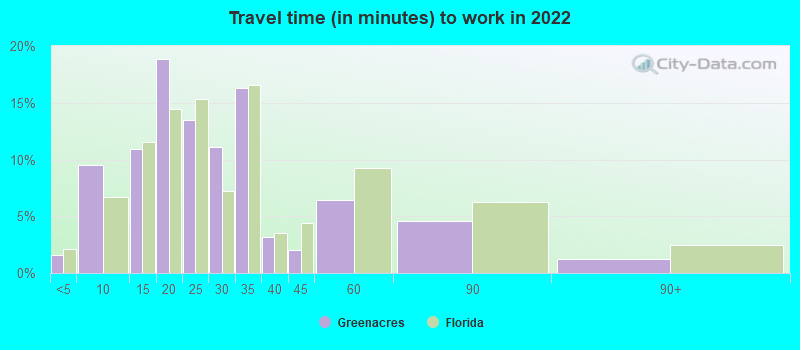
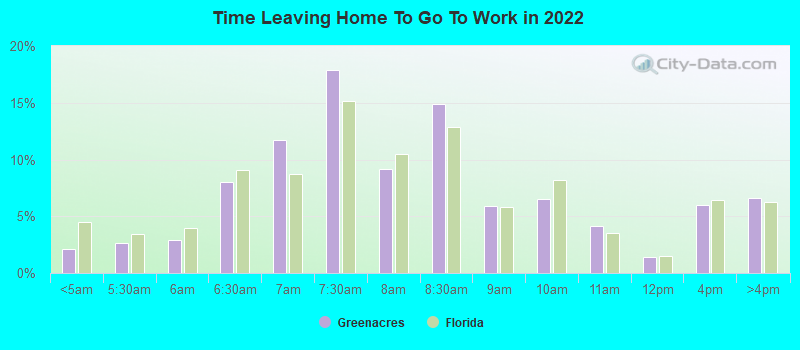
Travel time to work (commute)
- Less than 5 minutes: 158
- 5 to 9 minutes: 1,243
- 10 to 14 minutes: 1,138
- 15 to 19 minutes: 2,081
- 20 to 24 minutes: 3,282
- 25 to 29 minutes: 2,699
- 30 to 34 minutes: 4,554
- 35 to 39 minutes: 905
- 40 to 44 minutes: 948
- 45 to 59 minutes: 1,761
- 60 to 89 minutes: 1,300
- 90 or more minutes: 546
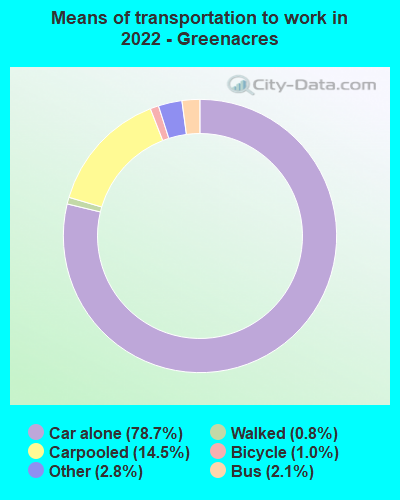
Means of transportation to work:
- Drove a car alone: 6,964 (69.1%)
- Carpooled: 1,220 (12.1%)
- Bus: 135 (1.3%)
- Taxi: 300 (3.0%)
- Bicycle: 93 (0.9%)
- Walked: 77 (0.8%)
- Worked at home: 1,210 (12.0%)
- Unemployment by race in 2022
- Unemployment rate for White non-Hispanic residents
- 5.6%Males
- 2.3%Females
- Unemployment rate for Black residents
- 8.3%Males
- 3.2%Females
- Unemployment rate for Asian residents
- 5.5%Males
- 5.0%Females
- Unemployment rate for other race residents
- 7.0%Males
- 5.3%Females
- Unemployment rate for two or more race residents
- 0.4%Females
- Unemployment rate for Hispanic or Latino residents
- 3.4%Males
- 2.6%Females
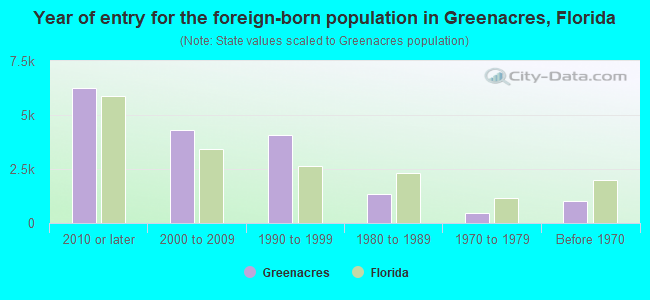
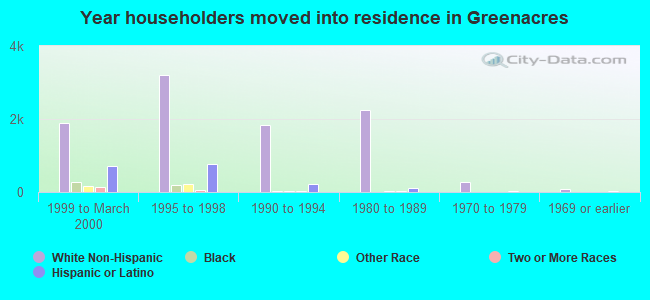
- Year of entry for the foreign-born population in Greenacres, Florida
- 6,2662010 or later
- 4,3022000 to 2009
- 4,0671990 to 1999
- 1,3261980 to 1989
- 4861970 to 1979
- 1,010Before 1970
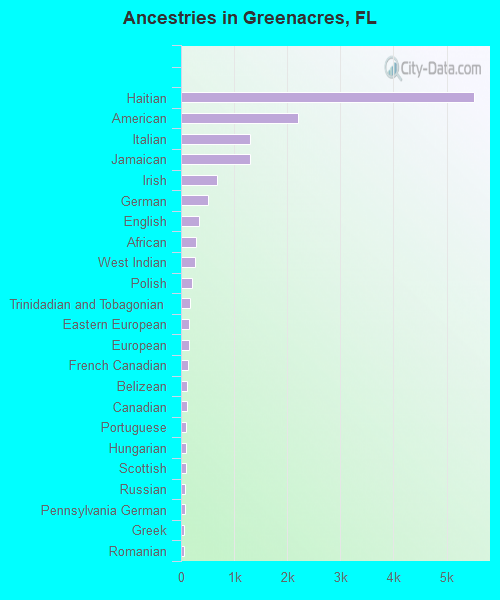
First ancestries reported:
- Haitian: 5,524 (17.8%)
- American: 2,211 (7.1%)
- Italian: 1,300 (4.2%)
- Jamaican: 1,292 (4.2%)
- Irish: 677 (2.2%)
- German: 509 (1.6%)
- English: 347 (1.1%)
- African: 275 (0.9%)
- West Indian: 257 (0.8%)
- Polish: 211 (0.7%)
- Trinidadian and Tobagonian: 164 (0.5%)
- Eastern European: 153 (0.5%)
- European: 145 (0.5%)
- French Canadian: 141 (0.5%)
- Belizean: 112 (0.4%)
- Canadian: 111 (0.4%)
- Portuguese: 98 (0.3%)
- Hungarian: 97 (0.3%)
- Scottish: 92 (0.3%)
- Russian: 81 (0.3%)
- Pennsylvania German: 73 (0.2%)
- Greek: 56 (0.2%)
- Romanian: 55 (0.2%)
- Armenian: 42 (0.1%)
- Brazilian: 40 (0.1%)
- Ghanaian: 37 (0.1%)
- Estonian: 34 (0.1%)
- Swedish: 33 (0.1%)
- Dutch: 30 (0.10%)
- Norwegian: 29 (0.09%)
- Iranian: 29 (0.09%)
- Macedonian: 28 (0.09%)
- French: 27 (0.09%)
- Lebanese: 26 (0.08%)
- Ukrainian: 25 (0.08%)
- Finnish: 20 (0.06%)
- British: 18 (0.06%)
- Scotch-Irish: 16 (0.05%)
- Austrian: 15 (0.05%)
- Celtic: 15 (0.05%)
- Turkish: 11 (0.04%)
- Barbadian: 11 (0.04%)
- Israeli: 10 (0.03%)
- Welsh: 10 (0.03%)
- Slovak: 6 (0.02%)
- Arab: 3 (0.01%)
- Bahamian: 2 (0.01%)
Most common places of birth for foreign-born residents (%):
| Greenacres: | 22.8% (4,362) |
| Florida: | 7.5% (342,375) |
| Greenacres: | 12.0% (2,304) |
| Florida: | 22.0% (1,006,576) |
| Greenacres: | 9.3% (1,772) |
| Florida: | 6.5% (298,669) |
| Greenacres: | 7.5% (1,428) |
| Florida: | 5.0% (227,319) |
| Greenacres: | 5.8% (1,114) |
| Florida: | 2.1% (96,693) |
| Greenacres: | 5.0% (955) |
| Florida: | 2.3% (107,160) |
| Greenacres: | 5.0% (952) |
| Florida: | 5.6% (257,152) |
| Greenacres: | 4.1% (776) |
| Florida: | 1.0% (43,642) |
| Greenacres: | 3.9% (744) |
| Florida: | 2.1% (97,632) |
| Greenacres: | 3.1% (601) |
| Florida: | 5.7% (262,042) |
| Greenacres: | 2.6% (494) |
| Florida: | 1.1% (49,838) |
| Greenacres: | 2.2% (423) |
| Florida: | 2.3% (105,066) |
| Greenacres: | 2.0% (380) |
| Florida: | 3.0% (137,727) |
| Greenacres: | 1.5% (288) |
| Florida: | 1.8% (84,403) |
Place of birth for U.S.-born residents:
- This state: 13,449
- Other state: 9,915
- Northeast: 6,438
- Midwest: 1,518
- South: 1,455
- West: 508
86.5% of Greenacres residents lived in the same house 1 years ago.
Out of people who lived in different houses, 39.7% lived in this county.
Out of people who lived in different counties, 54.1% lived in Florida.
| Greenacres: | 86.5% |
| State average: | 86.3% |
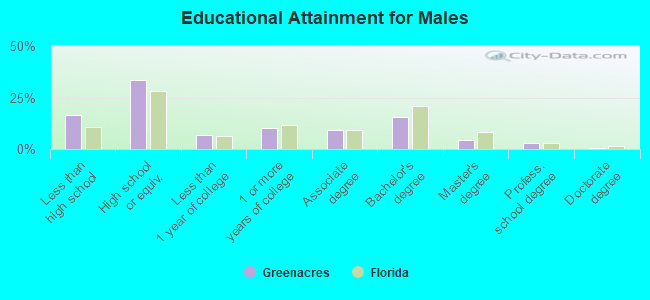
Education attainment for males 25 years and older:
- No schooling: 759
- Nursery to 4th grade: 157
- 5th and 6th grade: 439
- 7th and 8th grade: 72
- 9th grade: 339
- 10th grade: 123
- 11th grade: 80
- 12th grade, no diploma: 438
- High school graduate (or equivalency): 4,861
- Less than 1 year of college: 989
- Some college more than 1 year, no degree: 1,495
- Associate degree: 1,316
- Bachelor's degree: 2,246
- Master's degree: 661
- Professional school degree: 445
- Doctorate degree: 85
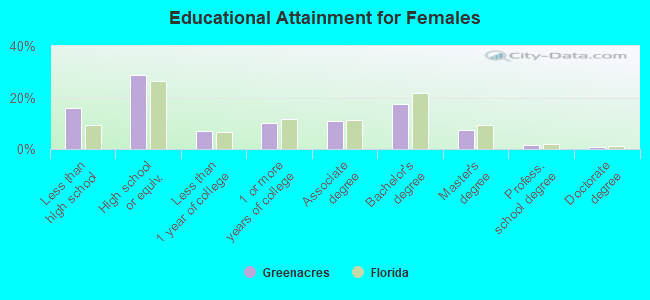
Education attainment for females 25 years and older:
- No schooling: 600
- Nursery to 4th grade: 197
- 5th and 6th grade: 603
- 7th and 8th grade: 284
- 9th grade: 182
- 10th grade: 190
- 11th grade: 292
- 12th grade, no diploma: 317
- High school graduate (or equivalency): 4,742
- Less than 1 year of college: 1,152
- Some college more than 1 year, no degree: 1,686
- Associate degree: 1,814
- Bachelor's degree: 2,900
- Master's degree: 1,189
- Professional school degree: 262
- Doctorate degree: 131
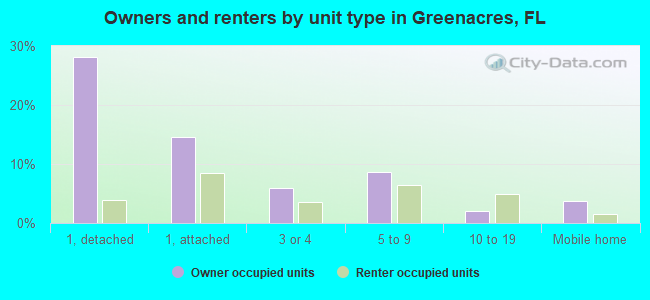
Housing units in structures:
- One, detached: 5,473
- One, attached: 3,915
- Two: 328
- 3 or 4: 1,626
- 5 to 9: 3,498
- 10 to 19: 1,293
- 20 to 49: 784
- 50 or more: 189
- Mobile homes: 958
- Boats, RVs, vans, etc.: 27
Median worth of mobile homes: $25,562
Housing units lacking complete kitchen facilities in 2022: 1.6%
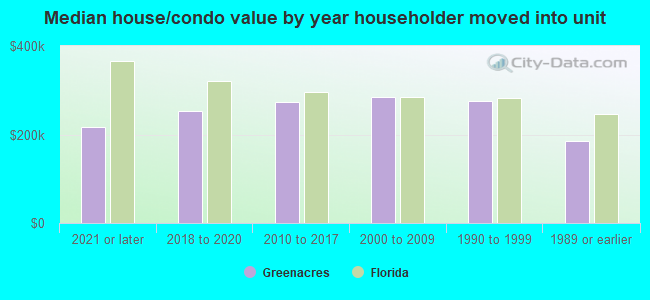
House/condo owner moved in on average 8 years ago
Renter moved in on average 1 years ago
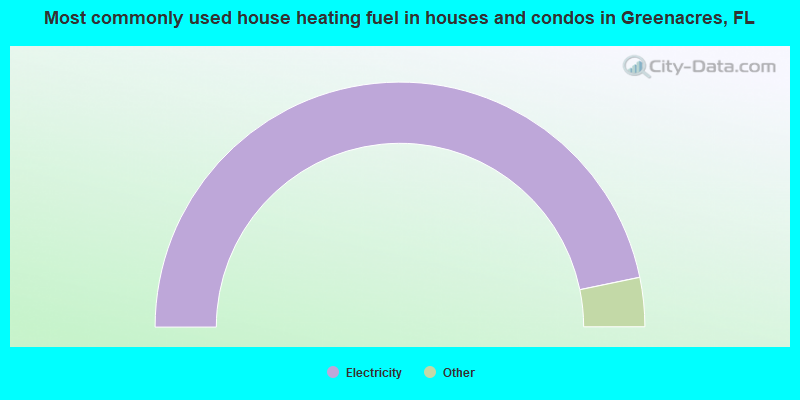
- 93.5%Electricity
- 2.9%Utility gas
- 2.1%No fuel used
- 0.6%Solar energy
- 0.5%Fuel oil, kerosene, etc.
- 0.3%Bottled, tank, or LP gas
- 0.1%Other fuel
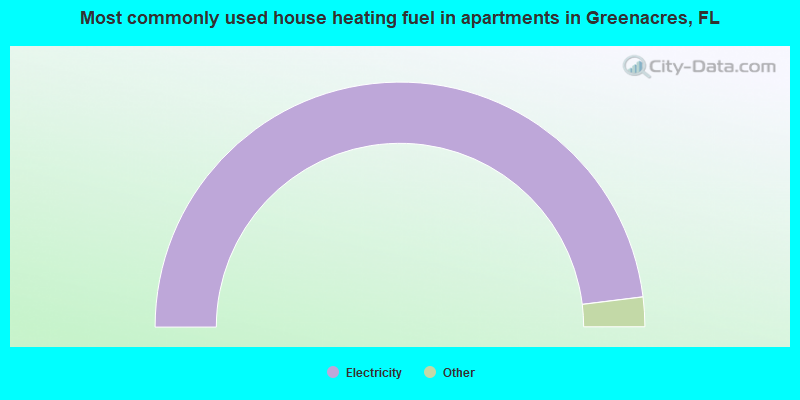
- 96.1%Electricity
- 1.8%No fuel used
- 1.5%Utility gas
- 0.6%Bottled, tank, or LP gas
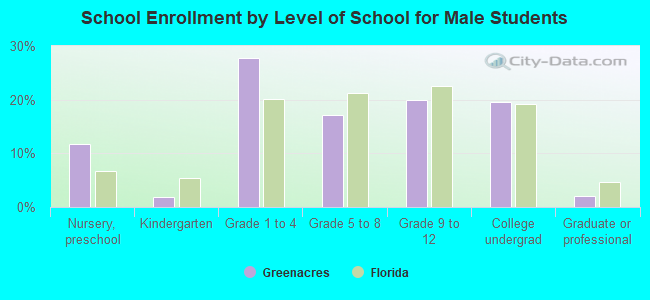
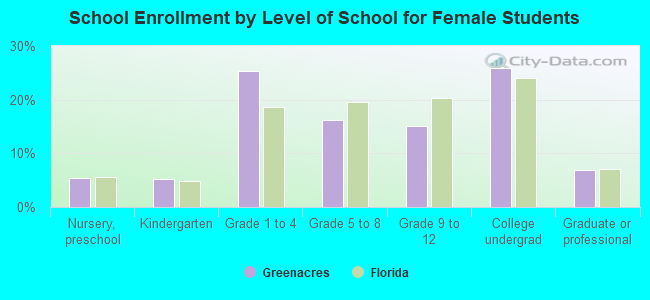
Private vs. public school enrollment:
| Here: | 5.5% |
| Florida: | 15.8% |
| Here: | 5.2% |
| Florida: | 12.9% |
| Here: | 28.4% |
| Florida: | 23.6% |