Housing density: 874 houses/condos per square mile
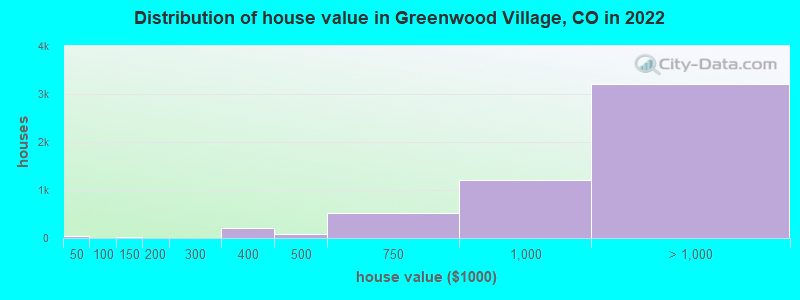
Median price asked for vacant for-sale houses and condos in 2022: $404,954.
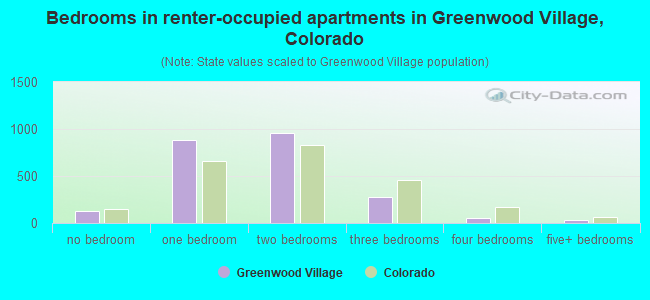
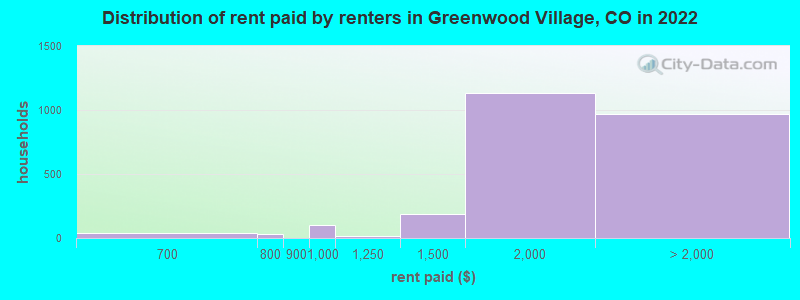
Median contract rent in 2022: $1,931 (lower quartile is $1,642, upper quartile is over $2,000)
Median rent asked for vacant for-rent units in 2022: $2,976
Median gross rent in Greenwood Village, CO in 2022: over $2,000
Housing units in Greenwood Village with a mortgage: 2,553 (487 second mortgage, 5 home equity loan, 445 both second mortgage and home equity loan) Houses without a mortgage: 44
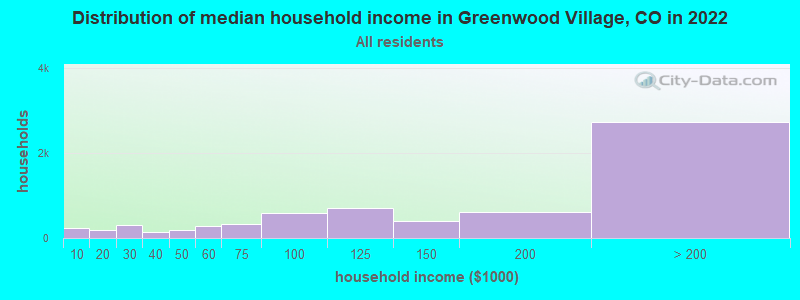
Median household income for houses/condos with a mortgage: $250,282
Median household income for apartments without a mortgage: $148,428
Median monthly housing costs: $2,213
Compare current foreclosures near Greenwood Village, CO:
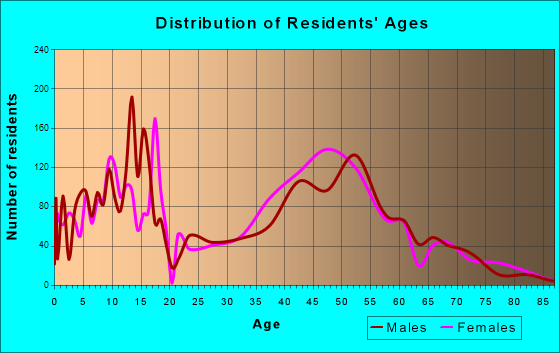
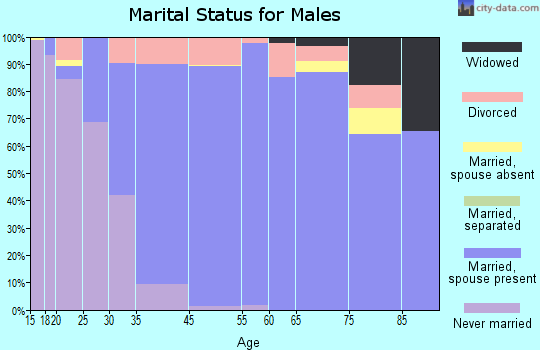
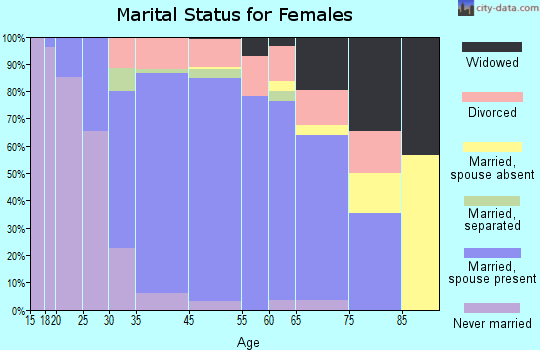
2,529 married couples with children.
288 single-parent households (61 men, 227 women).
81.0% of residents of Greenwood Village speak English at home.
3.5% of residents speak Spanish at home (78% speak English very well, 11% speak English well, 12% speak English not well).
7.9% of residents speak other Indo-European language at home (81% speak English very well, 16% speak English well, 2% speak English not well).
5.9% of residents speak Asian or Pacific Island language at home (61% speak English very well, 18% speak English well, 21% speak English not well).
1.0% of residents speak other language at home (35% speak English very well, 65% speak English well).
Foreign born population: 2,666 (17.1%)
(45.9% of them are naturalized citizens)
Percentage of workers working in this county: 69.8% Number of people working at home: 2,647 (32.7% of all workers)
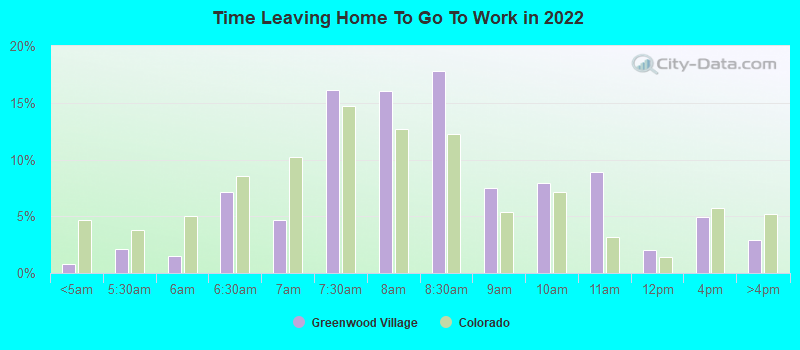
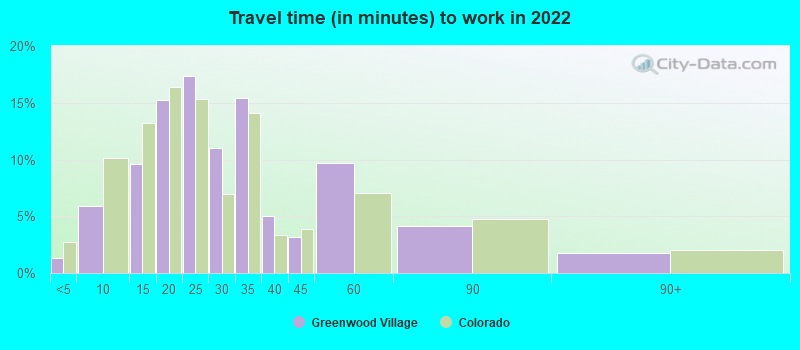
Travel time to work (commute)
Less than 5 minutes: 189
5 to 9 minutes: 847
10 to 14 minutes: 745
15 to 19 minutes: 1,401
20 to 24 minutes: 803
25 to 29 minutes: 272
30 to 34 minutes: 654
35 to 39 minutes: 103
40 to 44 minutes: 284
45 to 59 minutes: 325
60 to 89 minutes: 106
90 or more minutes: 14
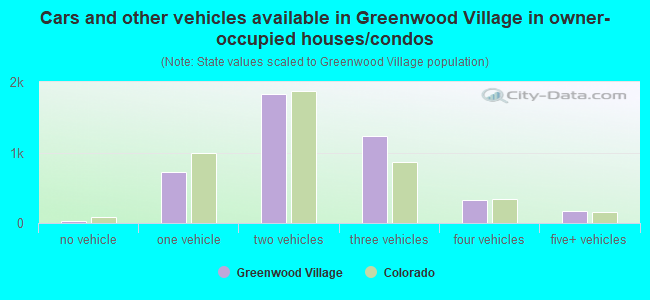
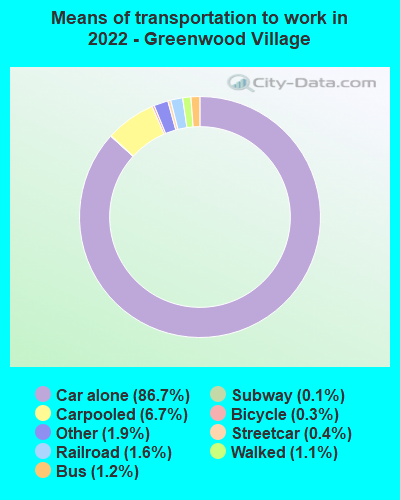
Means of transportation to work:
Drove a car alone: 31,953 (77.9%)
Carpooled: 2,428 (5.9%)
Bus: 372 (0.9%)
Subway or elevated rail: 68 (0.2%)
Long-distance train or commuter rail: 22 (0.1%)
Light rail, streetcar or trolley: 514 (1.3%)
Taxi: 933 (2.3%)
Bicycle: 108 (0.3%)
Walked: 436 (1.1%)
Worked at home: 2,647 (6.5%)
Unemployment by race in 2022
Unemployment rate for White non-Hispanic residents
1.5%Males
1.4%Females
Unemployment rate for Asian residents
10.1%Males
7.3%Females
Unemployment rate for two or more race residents
21.7%Males
Unemployment rate for Hispanic or Latino residents
10.7%Males
3.7%Females
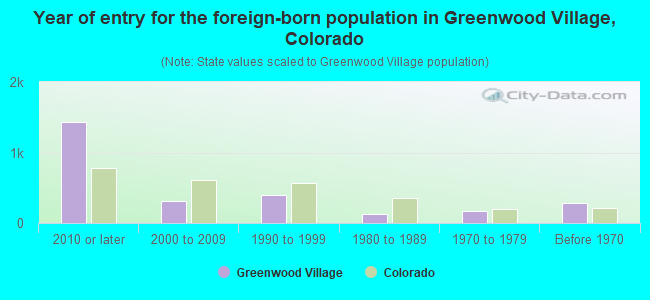
Year of entry for the foreign-born population in Greenwood Village, Colorado
1,4362010 or later
3132000 to 2009
3941990 to 1999
1231980 to 1989
1711970 to 1979
290Before 1970
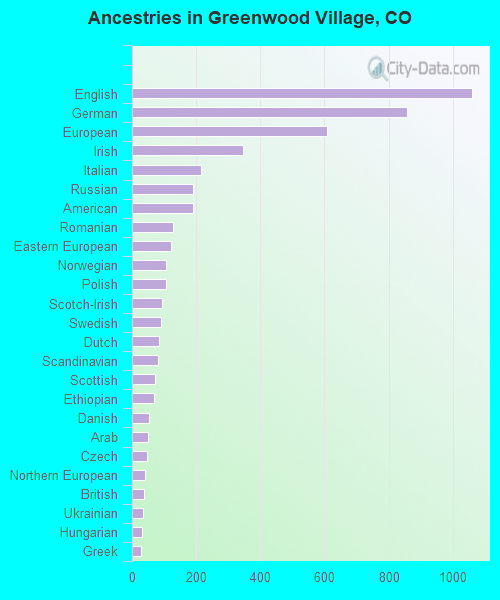
First ancestries reported:
English: 1,060 (14.0%)
German: 856 (11.3%)
European: 609 (8.0%)
Irish: 345 (4.5%)
Italian: 214 (2.8%)
Russian: 190 (2.5%)
American: 189 (2.5%)
Romanian: 127 (1.7%)
Eastern European: 121 (1.6%)
Norwegian: 106 (1.4%)
Polish: 105 (1.4%)
Scotch-Irish: 92 (1.2%)
Swedish: 89 (1.2%)
Dutch: 85 (1.1%)
Scandinavian: 81 (1.1%)
Scottish: 73 (1.0%)
Ethiopian: 69 (0.9%)
Danish: 52 (0.7%)
Arab: 50 (0.7%)
Czech: 47 (0.6%)
Northern European: 41 (0.5%)
British: 37 (0.5%)
Ukrainian: 33 (0.4%)
Hungarian: 30 (0.4%)
Greek: 29 (0.4%)
Canadian: 27 (0.4%)
Yugoslavian: 26 (0.3%)
Lebanese: 25 (0.3%)
French: 25 (0.3%)
Brazilian: 22 (0.3%)
Turkish: 21 (0.3%)
Welsh: 18 (0.2%)
Iranian: 17 (0.2%)
Palestinian: 16 (0.2%)
British West Indian: 14 (0.2%)
Nigerian: 13 (0.2%)
Austrian: 9 (0.1%)
Israeli: 9 (0.1%)
Maltese: 7 (0.09%)
South African: 7 (0.09%)
Belgian: 6 (0.08%)
Portuguese: 5 (0.07%)
Most common places of birth for foreign-born residents (%):
India
Greenwood Village:
31.5% (824)
Colorado:
4.0% (21,689)
Korea
Greenwood Village:
10.1% (265)
Colorado:
2.9% (15,981)
Canada
Greenwood Village:
8.0% (210)
Colorado:
2.7% (15,026)
Taiwan
Greenwood Village:
5.5% (143)
Colorado:
0.5% (2,651)
China, excluding Hong Kong and Taiwan
Greenwood Village:
5.2% (136)
Colorado:
3.3% (17,998)
Iraq
Greenwood Village:
4.0% (104)
Colorado:
0.6% (3,281)
Mexico
Greenwood Village:
3.2% (84)
Colorado:
38.3% (209,491)
Ethiopia
Greenwood Village:
2.9% (76)
Colorado:
1.9% (10,372)
Chile
Greenwood Village:
2.7% (70)
Colorado:
0.4% (1,938)
Russia
Greenwood Village:
2.6% (69)
Colorado:
1.4% (7,860)
Iran
Greenwood Village:
2.4% (62)
Colorado:
0.7% (3,568)
France
Greenwood Village:
2.3% (61)
Colorado:
0.5% (2,620)
Brazil
Greenwood Village:
1.8% (47)
Colorado:
1.0% (5,365)
Ukraine
Greenwood Village:
1.8% (46)
Colorado:
0.8% (4,267)
Other Eastern Europe
Greenwood Village:
1.6% (41)
Colorado:
0.4% (1,985)
Netherlands
Greenwood Village:
1.6% (41)
Colorado:
0.3% (1,640)
Place of birth for U.S.-born residents:
This state: 4,674
Other state: 8,019
Northeast: 1,747
Midwest: 2,695
South: 1,592
West: 1,946
84.0% of Greenwood Village residents lived in the same house 1 years ago. Out of people who lived in different houses, 28.7% lived in this county. Out of people who lived in different counties, 68.3% lived in Colorado.
Greenwood Village:
84.0%
State average:
83.6%
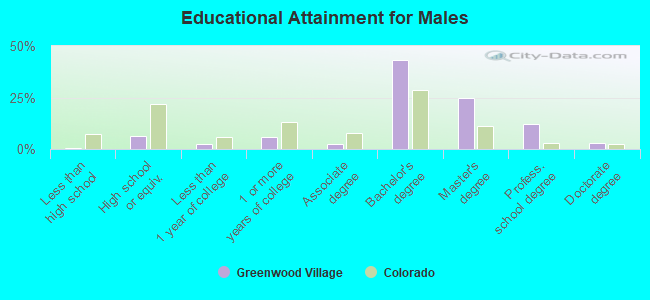
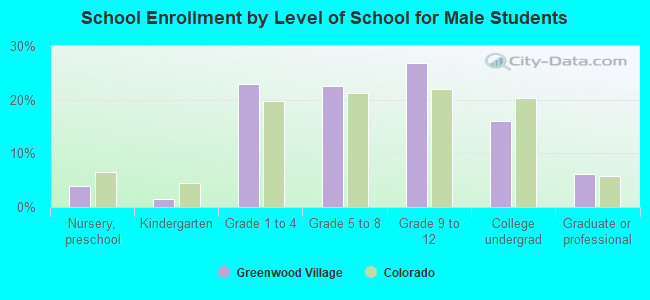
Education attainment for males 25 years and older:
No schooling: 5
Nursery to 4th grade: 4
5th and 6th grade: 0
7th and 8th grade: 0
9th grade: 7
10th grade: 0
11th grade: 0
12th grade, no diploma: 11
High school graduate (or equivalency): 369
Less than 1 year of college: 130
Some college more than 1 year, no degree: 331
Associate degree: 134
Bachelor's degree: 2,508
Master's degree: 1,431
Professional school degree: 712
Doctorate degree: 172
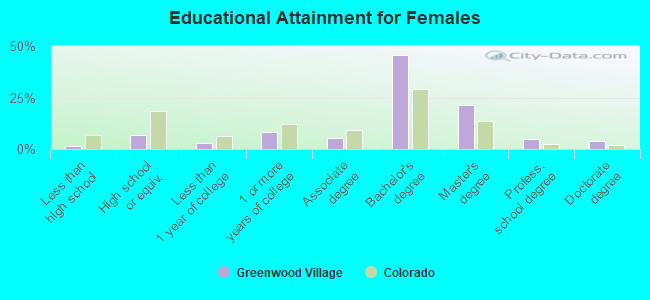
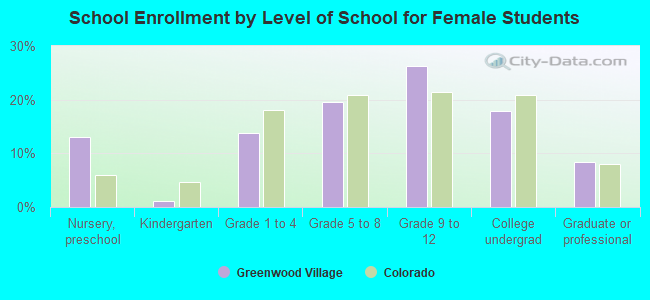
Education attainment for females 25 years and older:
No schooling: 47
Nursery to 4th grade: 0
5th and 6th grade: 0
7th and 8th grade: 0
9th grade: 0
10th grade: 33
11th grade: 0
12th grade, no diploma: 2
High school graduate (or equivalency): 389
Less than 1 year of college: 157
Some college more than 1 year, no degree: 481
Associate degree: 297
Bachelor's degree: 2,625
Master's degree: 1,221
Professional school degree: 287
Doctorate degree: 221
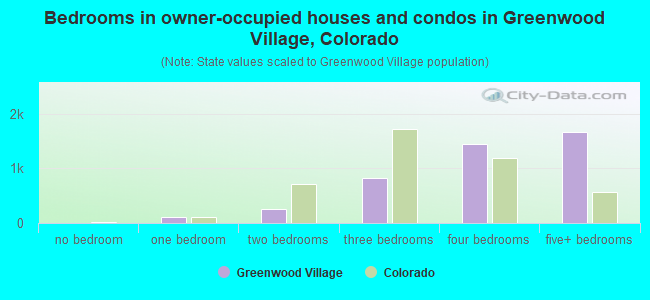
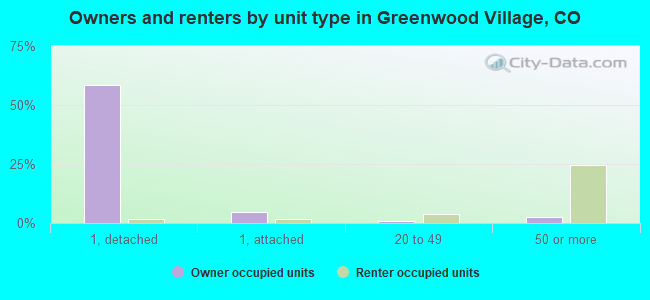
Housing units in structures:
One, detached: 3,792
One, attached: 619
Two: 22
3 or 4: 212
5 to 9: 460
10 to 19: 311
20 to 49: 253
50 or more: 1,411
Mobile homes: 3
Housing units lacking complete plumbing facilities in 2022: 0.4%
Housing units lacking complete kitchen facilities in 2022: 0.8%
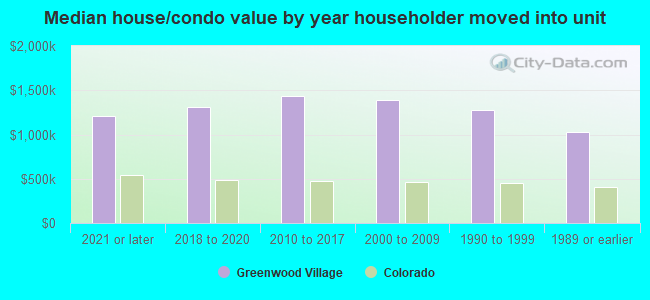
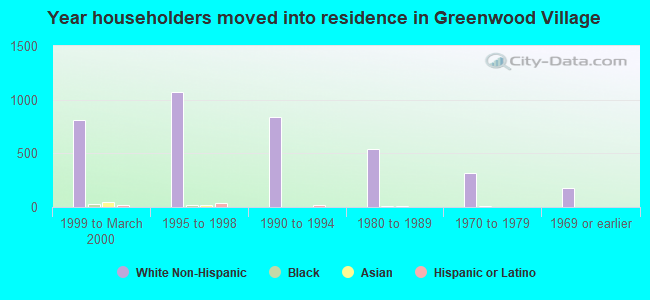
House/condo owner moved in on average 14 years ago