Gurnee, IL (Illinois) Houses and Residents
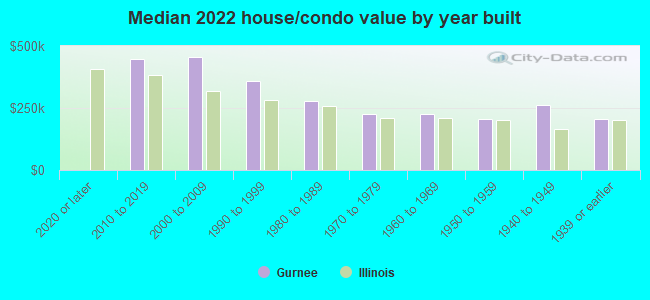
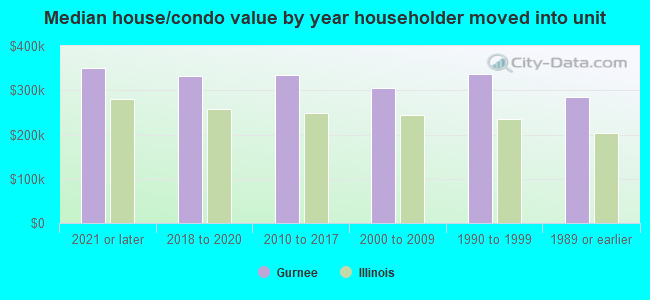
Estimated median house or condo value in 2022: $328,740 (it was $194,800 in 2000 )
Gurnee:
$328,740Illinois:
$251,600
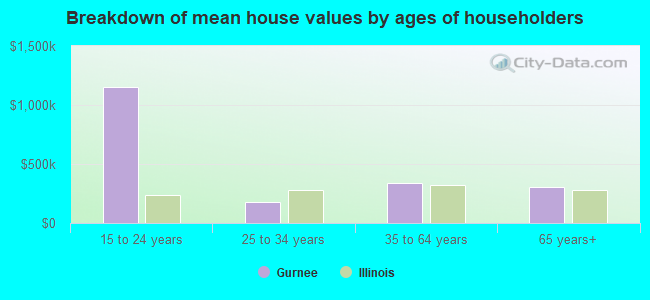
Lower value quartile - upper value quartile: $232,241 - $399,620Mean price in 2022: Detached houses: $399,042 Here:
$399,042State:
$310,164
Townhouses or other attached units: $196,320 Here:
$196,320State:
$286,230
In 3-to-4-unit structures: $212,966 Here:
$212,966State:
$330,907
In 5-or-more-unit structures: $95,110 Here:
$95,110State:
$318,887
Total population: 31,207 (Urban population: 28,276, Rural population: 339 (all nonfarm) )
Houses: 12,198 (11,797 occupied: 8,756 owner occupied, 3,265 renter occupied )
% of renters here:
27%State:
33%
Housing density: 910 houses/condos per square mile
Median price asked for vacant for-sale houses and condos in 2022: $212,560.
Median contract rent in 2022: $1,387 (lower quartile is $1,040, upper quartile is $1,795)
Median rent asked for vacant for-rent units in 2022: $1,519
Median gross rent in Gurnee, IL in 2022: $1,553
Housing units in Gurnee with a mortgage: 5,821 (645 second mortgage, 0 home equity loan, 523 both second mortgage and home equity loan )Houses without a mortgage: 60
Median household income for houses/condos with a mortgage: $147,475
Median household income for apartments without a mortgage: $110,243
Median monthly housing costs: $1,632
Data:
Median house or condo value ($)
Median house or condo value ($ change since 2000)
Median house or condo value ($) - White
Median house or condo value ($) - Black or African American
Median house or condo value ($) - Asian
Median house or condo value ($) - Hispanic or Latino
Median house or condo value ($) - American Indian and Alaska Native
Median house or condo value ($) - Multirace
Median house or condo value ($) - Other Race
Median price asked for mobile homes ($)
Household density (households per square mile)
Mean house or condo value by units in structure - 1, detached ($)
Mean house or condo value by units in structure - 1, attached ($)
Mean house or condo value by units in structure - 2 ($)
Mean house or condo value by units in structure by units in structure - 3 or 4 ($)
Mean house or condo value by units in structure - 5 or more ($)
Mean house or condo value by units in structure - Boat, RV, van, etc. ($)
Mean house or condo value by units in structure - Mobile home ($)
Median contract rent ($)
Median contract rent - Lower quartile ($)
Median contract rent - Upper quartile ($)
Median gross rent ($)
Urban houses (%)
Rural houses (%)
Houses occupied (%)
Houses occupied (% change since 2000)
Houses owner occupied (%)
Houses owner occupied (% change since 2000)
Houses renter occupied (%)
Houses renter occupied (% change since 2000)
Vacant housing units - For rent (%)
Vacant housing units - For rent (% change since 2000)
Vacant housing units - For sale only (%)
Vacant housing units - For sale only (% change since 2000)
Vacant housing units - Rented or sold, not occupied (%)
Vacant housing units - Rented or sold, not occupied (% change since 2000)
Vacant housing units - For seasonal, recreational, or occasional use (%)
Vacant housing units - For seasonal, recreational, or occasional use (% change since 2000)
Vacant housing units - For migrant workers (%)
Vacant housing units - For migrant workers (% change since 2000)
Vacant housing units - Other vacant (%)
Vacant housing units - Other vacant (% change since 2000)
Median monthly housing costs ($)
Median household income for houses/condos with a mortgage ($)
Median household income for houses/condos without a mortgage ($)
Median household income ($)
Median household income ($) - White
Median household income ($) - Black or African American
Median household income ($) - Asian
Median household income ($) - Hispanic or Latino
Median household income ($) - American Indian and Alaska Native
Median household income ($) - Multirace
Median household income ($) - Other Race
Mortgage status - with mortgage (%)
Mortgage status - with second mortgage (%)
Mortgage status - with home equity loan (%)
Mortgage status - with both second mortgage and home equity loan (%)
Mortgage status - without a mortgage (%)
Median year house/condo built
Median year apartment built
Household type by relationship - Male householder living alone (%)
Household type by relationship - Male householder not living alone (%)
Household type by relationship - Female householder living alone (%)
Household type by relationship - Female householder not living alone (%)
Household type by relationship - Opposite-Sex spouse (%)
Household type by relationship - Same-Sex spouse (%)
Household type by relationship - Opposite-Sex unmarried partner (%)
Household type by relationship - Same-Sex unmarried partner (%)
Household type by relationship - In group quarters (%)
Size of family households - 2-person household (%)
Size of family households - 3-person household (%)
Size of family households - 4-person household (%)
Size of family households - 5-person household (%)
Size of family households - 6-person household (%)
Size of family households - 7-or-more-person household (%)
Size of nonfamily households - 1-person household (%)
Size of nonfamily households - 2-person household (%)
Size of nonfamily households - 3-person household (%)
Size of nonfamily households - 4-person household (%)
Size of nonfamily households - 5-person household (%)
Size of nonfamily households - 6-person household (%)
Size of nonfamily households - 7-or-moreperson household (%)
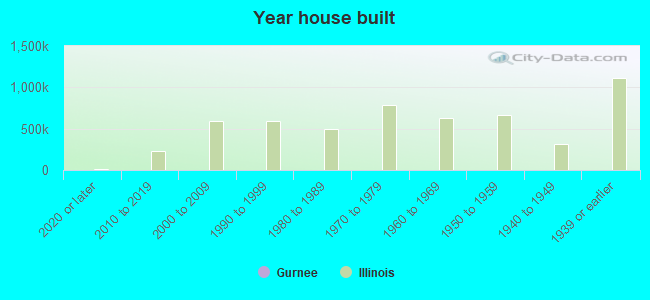
Year house built - Built 2010 or later (%)
Year house built - Built 2000 to 2009 (%)
Year house built - Built 1990 to 1999 (%)
Year house built - Built 1980 to 1989 (%)
Year house built - Built 1970 to 1979 (%)
Year house built - Built 1960 to 1969 (%)
Year house built - Built 1950 to 1959 (%)
Year house built - Built 1940 to 1949 (%)
Year house built - Built 1939 or earlier (%)
Median number of rooms in houses and condos
Median number of rooms in apartments
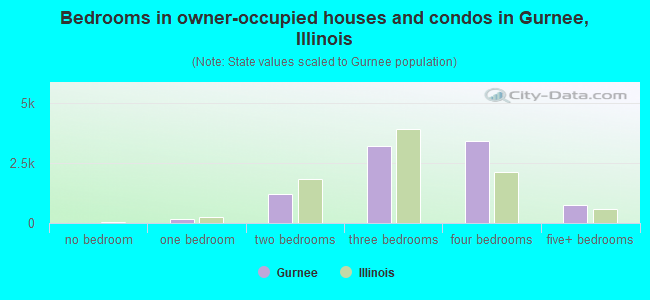
Median number of bedrooms in owner occupied houses
Mean number of bedrooms in owner occupied houses
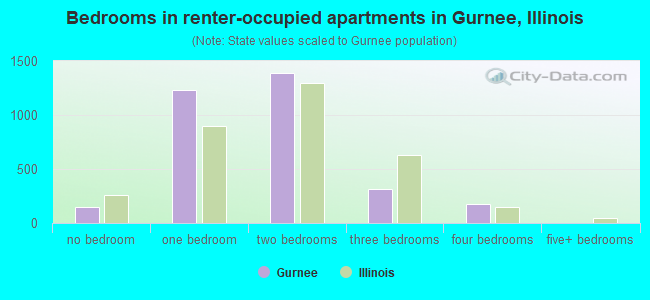
Median number of bedrooms in renter occupied houses
Mean number of bedrooms in renter occupied houses
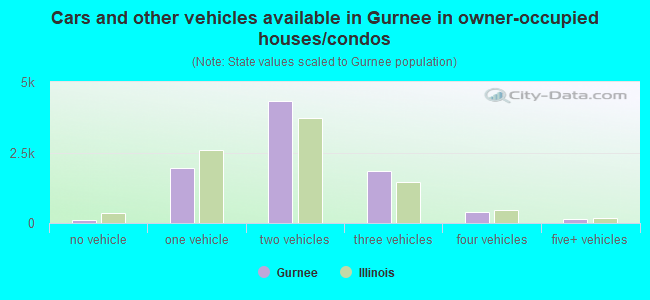
Median number of vehichles in owner occupied houses
Mean number of vehichles in owner occupied houses
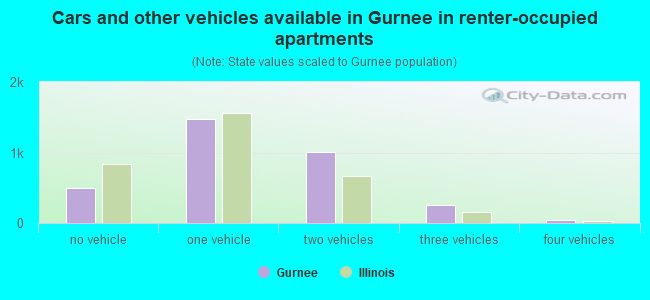
Median number of vehichles in renter occupied houses
Mean number of vehichles in renter occupied houses
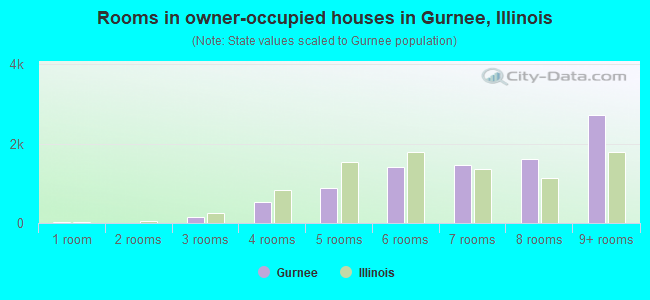
Rooms in owner-occupied houses - 1 room (%)
Rooms in owner-occupied houses - 2 rooms (%)
Rooms in owner-occupied houses - 3 rooms (%)
Rooms in owner-occupied houses - 4 rooms (%)
Rooms in owner-occupied houses - 5 rooms (%)
Rooms in owner-occupied houses - 6 rooms (%)
Rooms in owner-occupied houses - 7 rooms (%)
Rooms in owner-occupied houses - 8 rooms (%)
Rooms in owner-occupied houses - 9+ rooms (%)
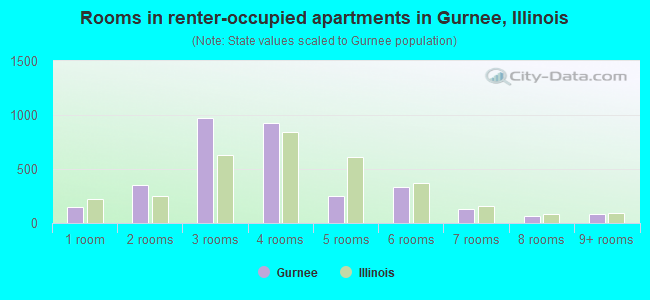
Rooms in renter-occupied houses - 1 room (%)
Rooms in renter-occupied houses - 2 rooms (%)
Rooms in renter-occupied houses - 3 rooms (%)
Rooms in renter-occupied houses - 4 rooms (%)
Rooms in renter-occupied houses - 5 rooms (%)
Rooms in renter-occupied houses - 6 rooms (%)
Rooms in renter-occupied houses - 7 rooms (%)
Rooms in renter-occupied houses - 8 rooms (%)
Rooms in renter-occupied houses - 9+ rooms (%)
Bedrooms in owner-occupied houses - no bedrooms (%)
Bedrooms in owner-occupied houses - 1 bedroom (%)
Bedrooms in owner-occupied houses - 2 bedrooms (%)
Bedrooms in owner-occupied houses - 3 bedrooms (%)
Bedrooms in owner-occupied houses - 4 bedrooms (%)
Bedrooms in owner-occupied houses - 5+ bedrooms (%)
Bedrooms in renter-occupied houses - no bedrooms (%)
Bedrooms in renter-occupied houses - 1 bedroom (%)
Bedrooms in renter-occupied houses - 2 bedrooms (%)
Bedrooms in renter-occupied houses - 3 bedrooms (%)
Bedrooms in renter-occupied houses - 4 bedrooms (%)
Bedrooms in renter-occupied houses - 5+ bedrooms (%)
Vehicles available in owner-occupied houses - no vehicle available (%)
Vehicles available in owner-occupied houses - 1 vehicle available(%)
Vehicles available in owner-occupied houses - 2 Vehicles available (%)
Vehicles available in owner-occupied houses - 3 Vehicles available (%)
Vehicles available in owner-occupied houses - 4 Vehicles available (%)
Vehicles available in owner-occupied houses - 5+ Vehicles available (%)
Vehicles available in renter-occupied houses - no vehicle available (%)
Vehicles available in renter-occupied houses - 1 vehicle available (%)
Vehicles available in renter-occupied houses - 2 Vehicles available (%)
Vehicles available in renter-occupied houses - 3 Vehicles available (%)
Vehicles available in renter-occupied houses - 4 Vehicles available (%)
Vehicles available in renter-occupied houses - 5+ Vehicles available (%)
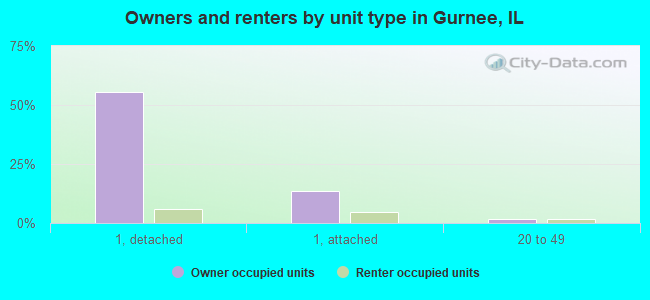
Housing units in structures - 1, detached (%)
Housing units in structures - 1, attached (%)
Housing units in structures - 2 (%)
Housing units in structures - 3 or 4 (%)
Housing units in structures - 5 to 9 (%)
Housing units in structures - 10 to 19 (%)
Housing units in structures - 20 to 49 (%)
Housing units in structures - 50 or more (%)
Housing units in structures - Mobile home (%)
Housing units in structures - Boat, RV, van, etc. (%)
Housing units in structures - Owners - 1, detached (%)
Housing units in structures - Owners - 1, attached (%)
Housing units in structures - Owners - 2 (%)
Housing units in structures - Owners - 3 or 4 (%)
Housing units in structures - Owners - 5 to 9 (%)
Housing units in structures - Owners - 10 to 19 (%)
Housing units in structures - Owners - 20 to 49 (%)
Housing units in structures - Owners - 50 or more (%)
Housing units in structures - Owners - Mobile home (%)
Housing units in structures - Owners - Boat, RV, van, etc. (%)
Housing units in structures - Renters - 1, detached (%)
Housing units in structures - Renters - 1, attached (%)
Housing units in structures - Renters - 2 (%)
Housing units in structures - Renters - 3 or 4 (%)
Housing units in structures - Renters - 5 to 9 (%)
Housing units in structures - Renters - 10 to 19 (%)
Housing units in structures - Renters - 20 to 49 (%)
Housing units in structures - Renters - 50 or more (%)
Housing units in structures - Renters - Mobile home (%)
Housing units in structures - Renters - Boat, RV, van, etc. (%)
House/condo owner moved in on average (years ago)
Renter moved in on average (years ago)
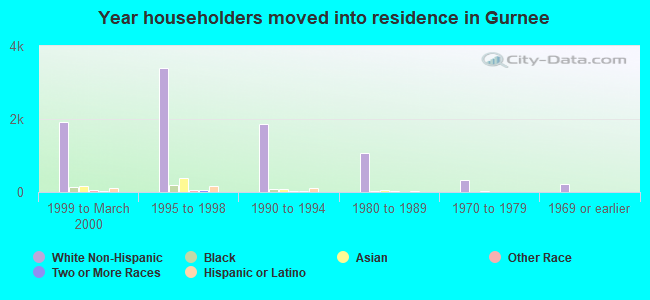
Year householder moved into unit - Moved in 1999 to March 2000 (%)
Year householder moved into unit - Moved in 1999 to March 2000 (%) - White
Year householder moved into unit - Moved in 1999 to March 2000 (%) - Black or African American
Year householder moved into unit - Moved in 1999 to March 2000 (%) - Asian
Year householder moved into unit - Moved in 1999 to March 2000 (%) - Hispanic or Latino
Year householder moved into unit - Moved in 1999 to March 2000 (%) - American Indian and Alaska Native
Year householder moved into unit - Moved in 1999 to March 2000 (%) - Multirace
Year householder moved into unit - Moved in 1999 to March 2000 (%) - Other Race
Year householder moved into unit - Moved in 1995 to 1998 (%)
Year householder moved into unit - Moved in 1995 to 1998 (%) - White
Year householder moved into unit - Moved in 1995 to 1998 (%) - Black or African American
Year householder moved into unit - Moved in 1995 to 1998 (%) - Asian
Year householder moved into unit - Moved in 1995 to 1998 (%) - Hispanic or Latino
Year householder moved into unit - Moved in 1995 to 1998 (%) - American Indian and Alaska Native
Year householder moved into unit - Moved in 1995 to 1998 (%) - Multirace
Year householder moved into unit - Moved in 1995 to 1998 (%) - Other Race
Year householder moved into unit - Moved in 1990 to 1994 (%)
Year householder moved into unit - Moved in 1990 to 1994 (%) - White
Year householder moved into unit - Moved in 1990 to 1994 (%) - Black or African American
Year householder moved into unit - Moved in 1990 to 1994 (%) - Asian
Year householder moved into unit - Moved in 1990 to 1994 (%) - Hispanic or Latino
Year householder moved into unit - Moved in 1990 to 1994 (%) - American Indian and Alaska Native
Year householder moved into unit - Moved in 1990 to 1994 (%) - Multirace
Year householder moved into unit - Moved in 1990 to 1994 (%) - Other Race
Year householder moved into unit - Moved in 1980 to 1989 (%)
Year householder moved into unit - Moved in 1980 to 1989 (%) - White
Year householder moved into unit - Moved in 1980 to 1989 (%) - Black or African American
Year householder moved into unit - Moved in 1980 to 1989 (%) - Asian
Year householder moved into unit - Moved in 1980 to 1989 (%) - Hispanic or Latino
Year householder moved into unit - Moved in 1980 to 1989 (%) - American Indian and Alaska Native
Year householder moved into unit - Moved in 1980 to 1989 (%) - Multirace
Year householder moved into unit - Moved in 1980 to 1989 (%) - Other Race
Year householder moved into unit - Moved in 1970 to 1979 (%)
Year householder moved into unit - Moved in 1970 to 1979 (%) - White
Year householder moved into unit - Moved in 1970 to 1979 (%) - Black or African American
Year householder moved into unit - Moved in 1970 to 1979 (%) - Asian
Year householder moved into unit - Moved in 1970 to 1979 (%) - Hispanic or Latino
Year householder moved into unit - Moved in 1970 to 1979 (%) - American Indian and Alaska Native
Year householder moved into unit - Moved in 1970 to 1979 (%) - Multirace
Year householder moved into unit - Moved in 1970 to 1979 (%) - Other Race
Year householder moved into unit - Moved in 1969 or earlier (%)
Year householder moved into unit - Moved in 1969 or earlier (%) - White
Year householder moved into unit - Moved in 1969 or earlier (%) - Black or African American
Year householder moved into unit - Moved in 1969 or earlier (%) - Asian
Year householder moved into unit - Moved in 1969 or earlier (%) - Hispanic or Latino
Year householder moved into unit - Moved in 1969 or earlier (%) - American Indian and Alaska Native
Year householder moved into unit - Moved in 1969 or earlier (%) - Multirace
Year householder moved into unit - Moved in 1969 or earlier (%) - Other Race
Housing units lacking complete plumbing facilities (%)
Housing units lacking complete kitchen facilities (%)
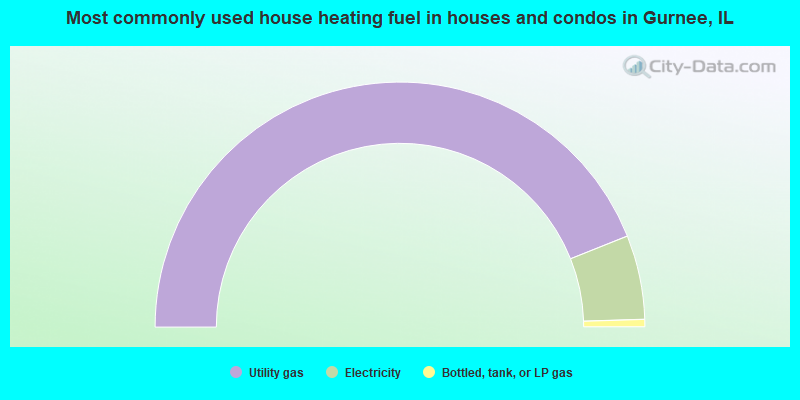
House heating fuel used in houses and condos - Utility gas (%)
House heating fuel used in houses and condos - Bottled, tank, or LP gas (%)
House heating fuel used in houses and condos - Electricity (%)
House heating fuel used in houses and condos - Fuel oil, kerosene, etc. (%)
House heating fuel used in houses and condos - Coal or coke (%)
House heating fuel used in houses and condos - Wood (%)
House heating fuel used in houses and condos - Solar energy (%)
House heating fuel used in houses and condos - Other fuel (%)
House heating fuel used in houses and condos - No fuel used (%)
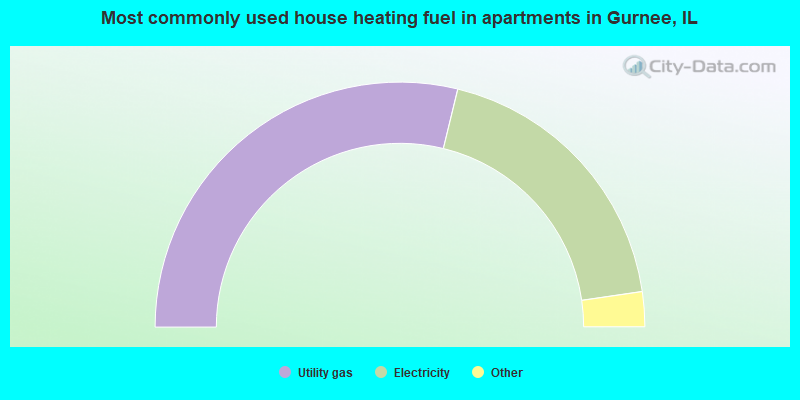
House heating fuel used in apartments - Utility gas (%)
House heating fuel used in apartments - Bottled, tank, or LP gas (%)
House heating fuel used in apartments - Electricity (%)
House heating fuel used in apartments - Fuel oil, kerosene, etc. (%)
House heating fuel used in apartments - Coal or coke (%)
House heating fuel used in apartments - Wood (%)
House heating fuel used in apartments - Solar energy (%)
House heating fuel used in apartments - Other fuel (%)
House heating fuel used in apartments - No fuel used (%)
Latest news about housing in Gurnee, IL collected exclusively by city-data.com from local newspapers, TV, and radio stations
Median year house/condo built: 1993Median year apartment built: 1993Household type by relationship:
Households: 30,456
Male householders: 6,404 (1,051 living alone ), Female householders: 5,272 (1,860 living alone )6,941 spouses (6,915 opposite-sex spouses ), 707 unmarried partners , (707 opposite-sex unmarried partners ), 9,734 children (9,459 natural , 91 adopted , 183 stepchildren ), 121 grandchildren , 139 brothers or sisters , 368 parents , 9 foster children , 340 other relatives , 353 non-relatives In group quarters: 62
Size of family households: 3,449 2-persons , 1,953 3-persons , 2,018 4-persons , 487 5-persons , 307 6-persons , 37 7-or-more-persons .
Size of nonfamily households: 3,074 1-person , 730 2-persons , 4 3-persons , 12 5-persons .
5,012 married couples with children. single-parent households (282 men , 649 women ).
74.4% of residents of Gurnee speak English at home. of residents speak Spanish at home (70% speak English very well , 21% speak English well , 8% speak English not well ).of residents speak other Indo-European language at home (75% speak English very well , 20% speak English well , 5% speak English not well ).of residents speak Asian or Pacific Island language at home (70% speak English very well , 23% speak English well , 7% speak English not well ).of residents speak other language at home (52% speak English very well , 38% speak English well , 10% speak English not well ).
Foreign born population: 5,135 (16.9%)of them are naturalized citizens )
Median number of rooms in houses and condos:
Median number of rooms in apartments
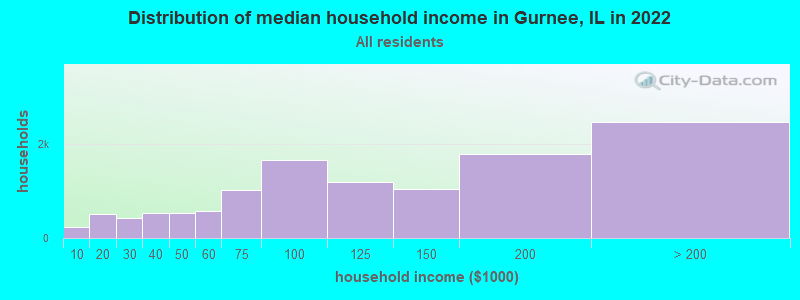
Gurnee, IL household income distribution 226 Less than $10,000500 $10,000 to $19,999420 $20,000 to $29,999527 $30,000 to $39,999537 $40,000 to $49,999579 $50,000 to $59,9991,019 $60,000 to $74,9991,651 $75,000 to $99,9991,196 $100,000 to $124,9991,040 $125,000 to $149,9991,776 $150,000 to $199,9992,466 $200,000 or more
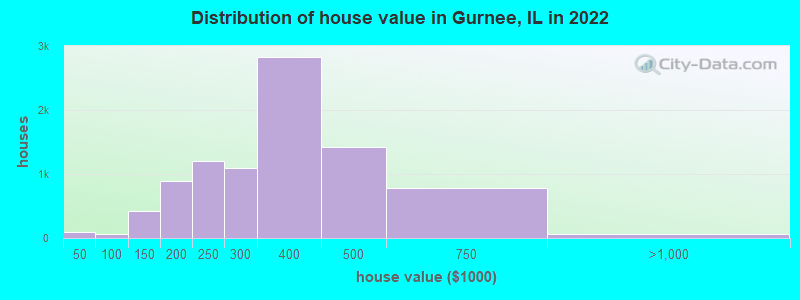
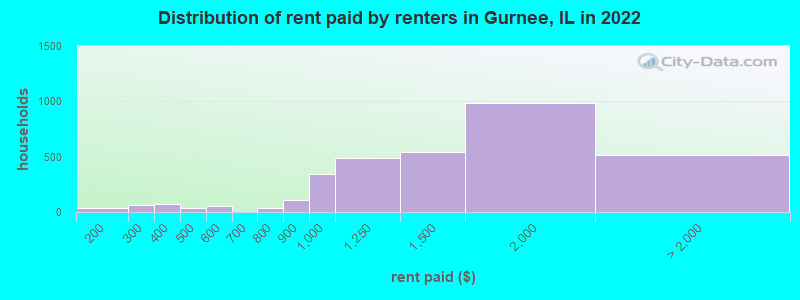
Home value of owner - occupied houses in 2022 in Gurnee, IL 38 Less than $10,00020 $20,000 to $24,99940 $30,000 to $34,99956 $70,000 to $79,999207 $100,000 to $124,999221 $125,000 to $149,999360 $150,000 to $174,999535 $175,000 to $199,9991,202 $200,000 to $249,9991,097 $250,000 to $299,9992,834 $300,000 to $399,9991,422 $400,000 to $499,999779 $500,000 to $749,99924 $750,000 to $999,99935 $2,000,000 or moreRent paid by renters in 2022 in Gurnee, IL 10 $100 to $14923 $150 to $19927 $200 to $24931 $250 to $29941 $300 to $34929 $350 to $39935 $450 to $4998 $500 to $54944 $550 to $59913 $700 to $74923 $750 to $799111 $800 to $899340 $900 to $999485 $1,000 to $1,249539 $1,250 to $1,499983 $1,500 to $1,999300 $2,000 to $2,49931 $2,500 to $2,99965 $3,500 or more112 No cash rent
Percentage of workers working in this county: 79.7%Number of people working at home: 3,108 (18.4% of all workers )
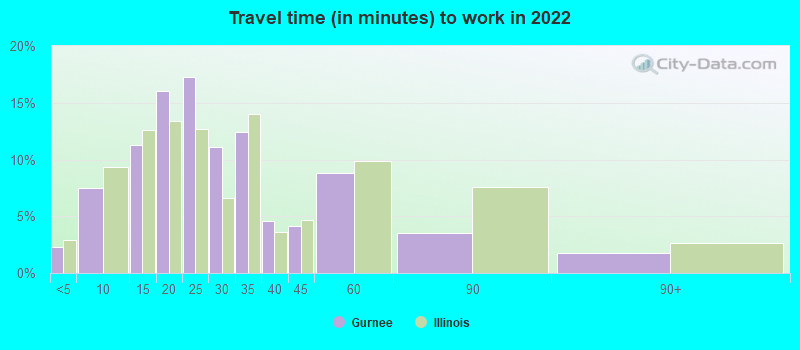
Travel time to work (commute)
Less than 5 minutes: 2755 to 9 minutes: 1,19510 to 14 minutes: 1,58615 to 19 minutes: 2,05820 to 24 minutes: 2,03625 to 29 minutes: 1,60430 to 34 minutes: 1,80935 to 39 minutes: 47140 to 44 minutes: 67545 to 59 minutes: 1,14560 to 89 minutes: 55090 or more minutes: 476
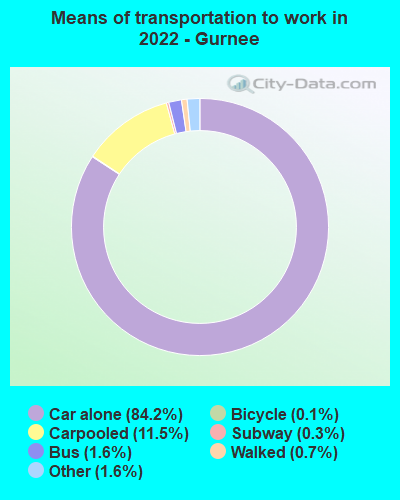
Means of transportation to work:
Drove a car alone: 15,901 (71.3%)Carpooled: 2,201 (9.9%)Bus : 329 (1.5%)Long-distance train or commuter rail : 48 (0.2%)Taxi: 312 (1.4%)Bicycle: 36 (0.2%)Walked: 140 (0.6%)Worked at home: 3,108 (13.9%)
Unemployment by race in 2022
Unemployment rate for White non-Hispanic residents 2.9% Males3.3% FemalesUnemployment rate for Black residents 0.6% Males4.4% FemalesUnemployment rate for Asian residents 5.7% Males0.9% FemalesUnemployment rate for other race residents 1.2% Males5.7% FemalesUnemployment rate for two or more race residents 0.3% Males3.6% FemalesUnemployment rate for Hispanic or Latino residents 1.4% Males3.8% Females
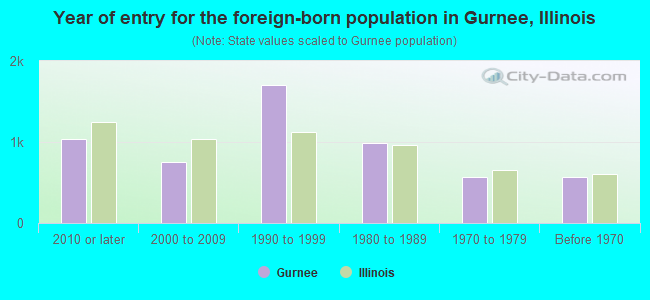
Year of entry for the foreign-born population in Gurnee, Illinois
1,042 2010 or later 749 2000 to 2009 1,705 1990 to 1999 987 1980 to 1989 572 1970 to 1979 563 Before 1970
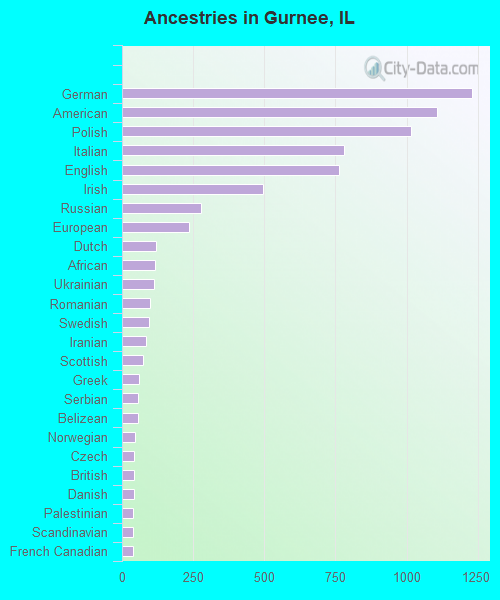
First ancestries reported:
German: 1,228 (8.4%)
American: 1,105 (7.6%)
Polish: 1,016 (7.0%)
Italian: 781 (5.3%)
English: 761 (5.2%)
Irish: 496 (3.4%)
Russian: 276 (1.9%)
European: 236 (1.6%)
Dutch: 120 (0.8%)
African: 117 (0.8%)
Ukrainian: 114 (0.8%)
Romanian: 100 (0.7%)
Swedish: 95 (0.7%)
Iranian: 85 (0.6%)
Scottish: 73 (0.5%)
Greek: 61 (0.4%)
Serbian: 55 (0.4%)
Belizean: 55 (0.4%)
Norwegian: 47 (0.3%)
Czech: 43 (0.3%)
British: 41 (0.3%)
Danish: 41 (0.3%)
Palestinian: 40 (0.3%)
Scandinavian: 40 (0.3%)
French Canadian: 38 (0.3%)
Northern European: 37 (0.3%)
Croatian: 36 (0.2%)
French: 34 (0.2%)
Brazilian: 33 (0.2%)
Lithuanian: 29 (0.2%)
Ethiopian: 26 (0.2%)
Lebanese: 21 (0.1%)
Scotch-Irish: 19 (0.1%)
Eastern European: 17 (0.1%)
Hungarian: 15 (0.1%)
Canadian: 14 (0.10%)
Swiss: 10 (0.07%)
Armenian: 9 (0.06%)
Belgian: 8 (0.05%)
Welsh: 7 (0.05%)
Yugoslavian: 5 (0.03%) Most common places of birth for foreign-born residents (%): India Gurnee:
18.8% (924)Illinois:
9.2% (166,409)
Philippines Gurnee:
17.1% (839)Illinois:
5.2% (93,003)
Mexico Gurnee:
14.0% (687)Illinois:
34.7% (626,958)
Pakistan Gurnee:
4.1% (200)Illinois:
1.6% (29,519)
Colombia Gurnee:
4.0% (198)Illinois:
0.9% (16,553)
Korea Gurnee:
3.8% (187)Illinois:
2.2% (40,393)
Bangladesh Gurnee:
3.7% (180)Illinois:
0.2% (2,731)
Ukraine Gurnee:
3.2% (156)Illinois:
1.6% (29,316)
Poland Gurnee:
2.9% (141)Illinois:
6.9% (124,474)
Germany Gurnee:
2.7% (131)Illinois:
1.0% (18,753)
Belize Gurnee:
2.3% (115)Illinois:
0.3% (4,639)
Vietnam Gurnee:
2.0% (100)Illinois:
1.2% (22,269)
China, excluding Hong Kong and Taiwan Gurnee:
1.8% (89)Illinois:
4.1% (74,364)
Romania Gurnee:
1.8% (87)Illinois:
0.8% (14,736)
Canada Gurnee:
1.6% (80)Illinois:
1.1% (19,306)
Russia Gurnee:
1.6% (79)Illinois:
0.9% (16,308)
England Gurnee:
1.5% (76)Illinois:
0.5% (8,551)
Venezuela Gurnee:
1.5% (76)Illinois:
0.5% (9,688)
Asia, n.e.c. Gurnee:
1.5% (74)Illinois:
0.4% (7,117)
Place of birth for U.S.-born residents:
This state: 18,376Other state: 6,258Northeast: 1,238Midwest: 2,690South: 1,408West: 891 88.0% of Gurnee residents lived in the same house 1 years ago.
Out of people who lived in different houses, 33.1% lived in this county.
Out of people who lived in different counties, 48.4% lived in Illinois.
Gurnee:
88.0%State average:
88.3%
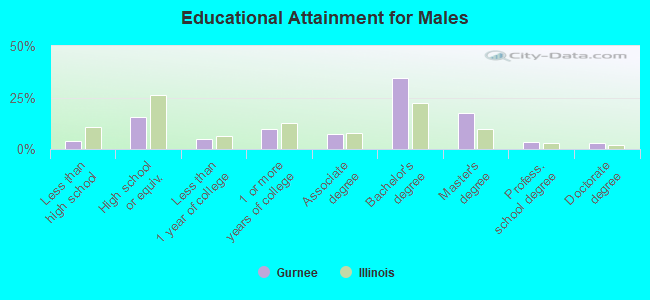
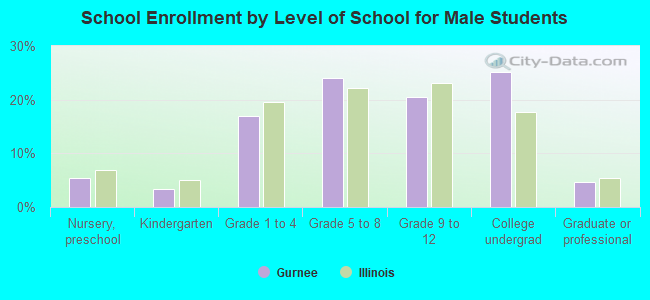
Education attainment for males 25 years and older:
No schooling: 103Nursery to 4th grade: 155th and 6th grade: 107th and 8th grade: 319th grade: 010th grade: 6311th grade: 2212th grade, no diploma: 162High school graduate (or equivalency): 1,566Less than 1 year of college: 498Some college more than 1 year, no degree: 997Associate degree: 762Bachelor's degree: 3,524Master's degree: 1,802Professional school degree: 344Doctorate degree: 278
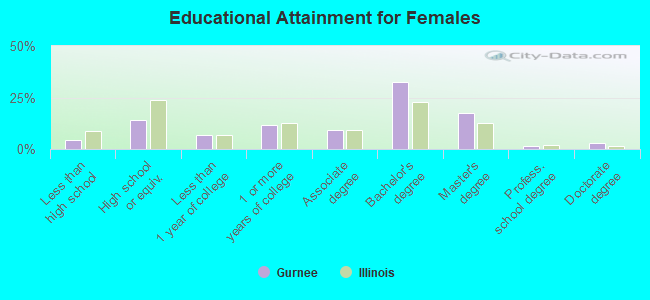
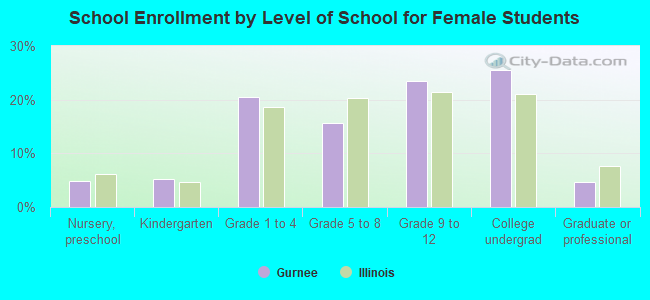
Education attainment for females 25 years and older:
No schooling: 202Nursery to 4th grade: 135th and 6th grade: 147th and 8th grade: 79th grade: 810th grade: 4511th grade: 5912th grade, no diploma: 121High school graduate (or equivalency): 1,521Less than 1 year of college: 749Some college more than 1 year, no degree: 1,250Associate degree: 992Bachelor's degree: 3,526Master's degree: 1,906Professional school degree: 175Doctorate degree: 327
Housing units in structures:
One, detached: 7,105One, attached: 1,875Two: 1753 or 4: 3475 to 9: 49010 to 19: 76620 to 49: 47350 or more: 959Boats, RVs, vans, etc.: 4Housing units lacking complete plumbing facilities in 2022: 0.1%Housing units lacking complete kitchen facilities in 2022: 2.4%House/condo owner moved in on average 10 years ago
Renter moved in on average 2 years ago
Private vs. public school enrollment:
Students in private schools in grades 1 to 8 (elementary and middle school): 183 Students in private schools in grades 9 to 12 (high school): 220 Students in private undergraduate colleges: 498