Hampden, MA (Massachusetts) Houses and Residents
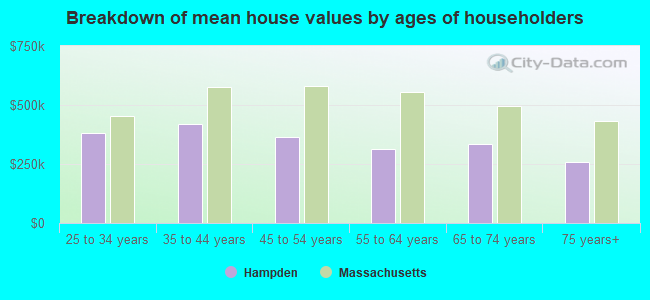
| Hampden: | $399,207 |
| Massachusetts: | $534,700 |
Total population: 5,139 (Urban population: 2,841, Rural population: 2,330 (52 farm, 2,278 nonfarm))
Houses: 1,846 (1,818 occupied: 1,648 owner occupied, 170 renter occupied)
| % of renters here: | 9% |
| State: | 38% |
Housing density: 94 houses/condos per square mile
Median price asked for vacant for-sale houses and condos in 2022 in this county: $294,896.
Median contract rent in 2022: $777 (lower quartile is $450, upper quartile is $1,167)
Median gross rent in Hampden, MA in 2022: $1,008
Housing units in Hampden with a mortgage: 1,049 (69 second mortgage, 155 home equity loan, 0 both second mortgage and home equity loan)
Houses without a mortgage: 404
Compare current foreclosures near Hampden, MA:
| Photo | Address | Area | Beds / Baths | Price | Details |
|---|---|---|---|---|---|

|
#1
Woodland Dr
Hampden, MA 01036
|
972 sq. feet
|
1 baths 3 beds |
show details | |

|
#2
E Longmeadow Rd
Hampden, MA 01036
|
616 sq. feet
|
1 baths 2 beds |
show details | |

|
#3
Wehr Rd
Hampden, MA 01036
|
864 sq. feet
|
1 baths 3 beds |
show details | |

|
#4
Main St
Hampden, MA 01036
|
- sq. feet
|
- baths - beds |
show details | |

|
#5
Hickory La
Hampden, MA 01036
|
- sq. feet
|
- baths - beds |
show details | |

|
#6
Tolland Ave
Stafford Springs, CT 06076
|
896 sq. feet
|
1 baths 3 beds |
$100,000
|
show details |

|
#7
State St
Bondsville, MA 01009
|
1,381 sq. feet
|
1 baths 3 beds |
$135,000
|
show details |

|
#8
Walnut Street
Springfield, MA 01105
|
2,850 sq. feet
|
2 baths 6 beds |
$110,000
|
show details |

|
#9
Jondot Dr
Enfield, CT 06082
|
1,385 sq. feet
|
1 baths 3 beds |
$299,900
|
show details |

|
#10
W Franklin St
Holyoke, MA 01040
|
1,558 sq. feet
|
1 baths 2 beds |
$234,900
|
show details |
| Photo | Address | Area | Beds / Baths | Price | Details |
|---|---|---|---|---|---|

|
#11
Talcott Ave
Vernon Rockville, CT 06066
|
1,832 sq. feet
|
2 baths 4 beds |
$148,000
|
show details |

|
#12
Mountain Rd
Stafford Springs, CT 06076
|
1,235 sq. feet
|
2 baths 3 beds |
$299,900
|
show details |

|
#13
Sanford Ave
Enfield, CT 06082
|
21 sq. feet
|
1 baths 4 beds |
$225,000
|
show details |

|
#14
Daytona St
Springfield, MA 01108
|
1,825 sq. feet
|
2 baths 6 beds |
$166,400
|
show details |

|
#15
Newman St
Springfield, MA 01105
|
1,676 sq. feet
|
2 baths 3 beds |
$45,900
|
show details |

|
#16
Anthony Rd
Tolland, CT 06084
|
1,584 sq. feet
|
3 baths 4 beds |
show details | |

|
#17
Foster St
Springfield, MA 01105
|
1,512 sq. feet
|
2 baths 4 beds |
show details | |

|
#18
Reed St
Warren, MA 01083
|
1,152 sq. feet
|
2 baths 3 beds |
show details | |

|
#19
Pleasant St
Holyoke, MA 01040
|
4,057 sq. feet
|
3 baths 6 beds |
show details | |

|
#20
Finch Rd
Springfield, MA 01119
|
864 sq. feet
|
1 baths 3 beds |
show details |
| Photo | Address | Area | Beds / Baths | Price | Details |
|---|---|---|---|---|---|

|
#21
Westford Ave
Springfield, MA 01109
|
3,358 sq. feet
|
2 baths 6 beds |
show details | |

|
#22
Glendale Cir
Windsor Locks, CT 06096
|
1,277 sq. feet
|
1 baths 2 beds |
show details | |

|
#23
Newbury St
Springfield, MA 01104
|
1,308 sq. feet
|
1 baths 3 beds |
show details | |

|
#24
Worthy Ave
West Springfield, MA 01089
|
1,501 sq. feet
|
1 baths 3 beds |
show details | |

|
#25
Main St
Palmer, MA 01069
|
1,114 sq. feet
|
2 baths 3 beds |
show details | |

|
#26
Wendover Rd
Suffield, CT 06078
|
3,204 sq. feet
|
2 baths 4 beds |
show details | |

|
#27
Royal St
Chicopee, MA 01020
|
3,296 sq. feet
|
4 baths 7 beds |
show details | |

|
#28
Brookfield Rd
Brimfield, MA 01010
|
1,482 sq. feet
|
3 baths 3 beds |
show details | |

|
#29
Johnson St
Springfield, MA 01108
|
2,432 sq. feet
|
2 baths 6 beds |
show details | |

|
#30
Stuart St
Springfield, MA 01119
|
864 sq. feet
|
1 baths 3 beds |
show details |
| Photo | Address | Area | Beds / Baths | Price | Details |
|---|---|---|---|---|---|

|
#31
Silver St
Agawam, MA 01001
|
1,262 sq. feet
|
1 baths 3 beds |
show details | |

|
#32
Empire St
Chicopee, MA 01013
|
960 sq. feet
|
1 baths 3 beds |
show details | |

|
#33
Fieldston St
Springfield, MA 01119
|
848 sq. feet
|
1 baths 1 beds |
show details | |

|
#34
Putnam St
Springfield, MA 01109
|
2,017 sq. feet
|
2 baths 4 beds |
show details | |

|
#35
Hovey Rd
Monson, MA 01057
|
2,256 sq. feet
|
1 baths 4 beds |
show details | |

|
#36
Eldbert Street
Springfield, MA 01109
|
1,218 sq. feet
|
1 baths 3 beds |
show details | |

|
#37
Fountain St
Springfield, MA 01108
|
1,540 sq. feet
|
1 baths 3 beds |
show details | |

|
#38
Amber Rd
Holland, MA 01521
|
1,363 sq. feet
|
1 baths 3 beds |
show details | |

|
#39
Catherine St
Chicopee, MA 01013
|
1,073 sq. feet
|
1 baths 2 beds |
show details | |

|
#40
Ontario St
Springfield, MA 01104
|
1,405 sq. feet
|
1 baths 3 beds |
show details |
| Photo | Address | Area | Beds / Baths | Price | Details |
|---|---|---|---|---|---|

|
#41
Ontario St
Springfield, MA 01104
|
1,260 sq. feet
|
1 baths 3 beds |
show details | |

|
#42
Laroche St
Ludlow, MA 01056
|
1,321 sq. feet
|
1 baths 3 beds |
show details | |

|
#43
Phoenix Ter
Springfield, MA 01104
|
1,067 sq. feet
|
1 baths 3 beds |
show details | |

|
#44
Colburn Rd
Stafford Springs, CT 06076
|
1,114 sq. feet
|
1 baths 2 beds |
show details | |

|
#45
Arthur St
Springfield, MA 01104
|
823 sq. feet
|
1 baths 2 beds |
show details | |

|
#46
Poole Rd
Belchertown, MA 01007
|
800 sq. feet
|
1 baths 2 beds |
show details | |

|
#47
Newbury St
Springfield, MA 01104
|
1,504 sq. feet
|
1 baths 3 beds |
show details | |

|
#48
Notre Dame St
Springfield, MA 01104
|
1,310 sq. feet
|
2 baths 4 beds |
show details | |

|
#49
Dunn Rd
Longmeadow, MA 01106
|
2,400 sq. feet
|
3 baths 3 beds |
show details | |

|
Check over 1 million property listings on Foreclosure.com!
|
browse all offers | |||
Latest news about housing in Hampden, MA collected exclusively by city-data.com from local newspapers, TV, and radio stations


Household type by relationship:
Households: 448,699- In family households: 370,558 (69,901 male householders, 46,060 female householders)
75,335 spouses, 139,777 children (131,178 natural, 3,169 adopted, 5,430 stepchildren), 9,761 grandchildren, 4,611 brothers or sisters, 4,384 parents, foster children, 5,451 other relatives, 12,672 non-relatives
- In nonfamily households: 78,141 (28,658 male householders (22,507 living alone)), 35,308 female householders (30,105 living alone)), 14,175 nonrelatives
- In group quarters: 14,791 (5,845 institutionalized population)
67,791 married couples with children.
39,215 single-parent households (5,649 men, 33,566 women).
96.3% of residents of Hampden speak English at home.
0.4% of residents speak Spanish at home (75% speak English very well, 25% speak English well).
3.2% of residents speak other Indo-European language at home (65% speak English very well, 28% speak English well, 6% speak English not well).
0.2% of residents speak Asian or Pacific Island language at home (100% speak English very well).
Foreign born population: 206 (3.9%)
(76.7% of them are naturalized citizens)
| Here: | 6.1 |
| State: | 6.5 |
| Here: | 3.2 |
| State: | 4.0 |
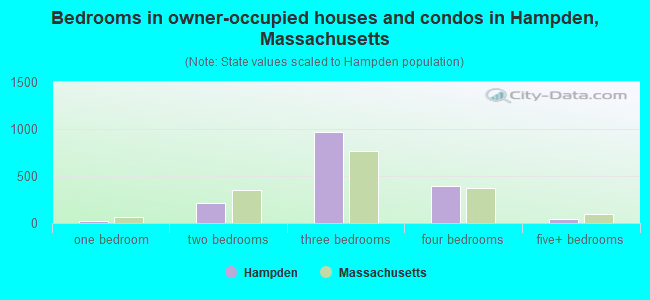
- Bedrooms in owner-occupied houses and condos in Hampden, Massachusetts
- 0no bedroom
- 221 bedroom
- 2132 bedrooms
- 9723 bedrooms
- 3944 bedrooms
- 475+ bedrooms
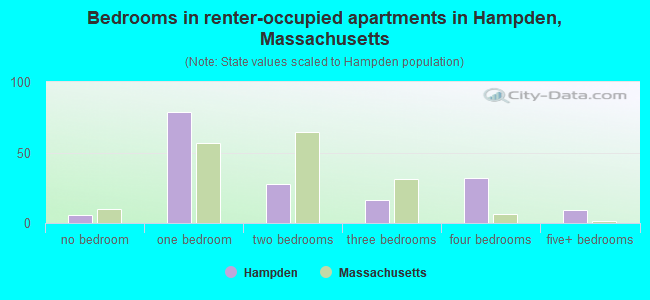
- Bedrooms in renter-occupied apartments in Hampden, Massachusetts
- 6no bedroom
- 791 bedroom
- 282 bedrooms
- 163 bedrooms
- 324 bedrooms
- 95+ bedrooms
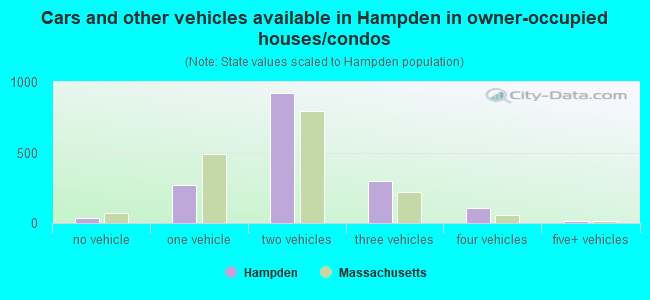
- Cars and other vehicles available in Hampden in owner-occupied houses/condos
- 37no vehicle
- 2701 vehicle
- 9252 vehicles
- 2953 vehicles
- 1084 vehicles
- 135+ vehicles
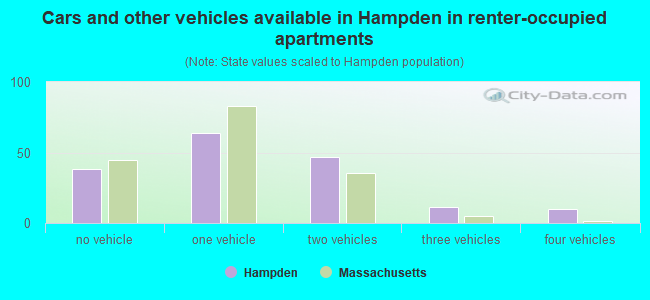
- Cars and other vehicles available in Hampden in renter-occupied apartments
- 38no vehicle
- 641 vehicle
- 472 vehicles
- 113 vehicles
- 104 vehicles
- 05+ vehicles
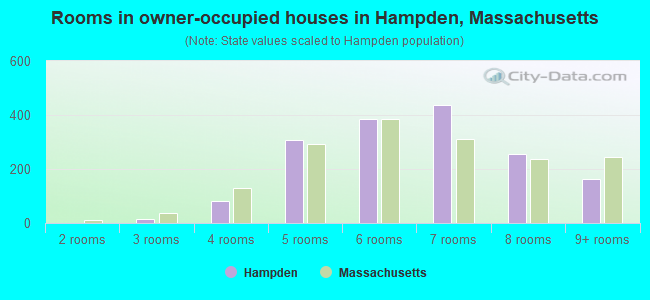
- Rooms in owner-occupied houses in Hampden, Massachusetts
- 01 room
- 02 rooms
- 143 rooms
- 834 rooms
- 3095 rooms
- 3856 rooms
- 4377 rooms
- 2578 rooms
- 1639+ rooms
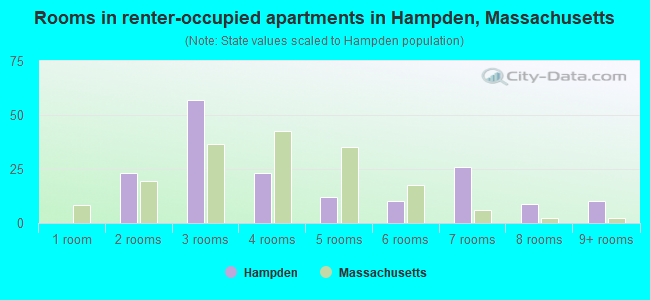
- Rooms in renter-occupied apartments in Hampden, Massachusetts
- 01 room
- 232 rooms
- 573 rooms
- 234 rooms
- 125 rooms
- 106 rooms
- 267 rooms
- 98 rooms
- 109+ rooms
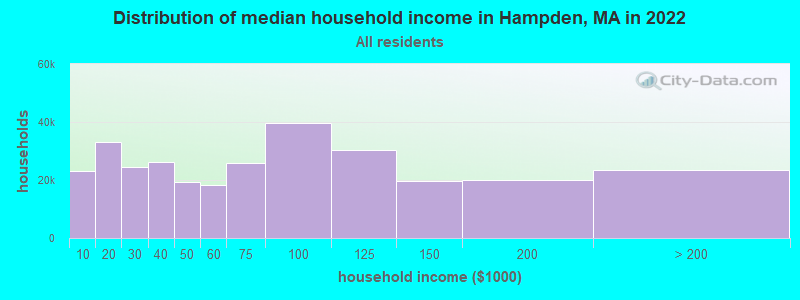
Hampden, MA household income distribution

- 23,165Less than $10,000
- 32,943$10,000 to $19,999
- 24,370$20,000 to $29,999
- 26,149$30,000 to $39,999
- 19,159$40,000 to $49,999
- 18,336$50,000 to $59,999
- 25,830$60,000 to $74,999
- 39,774$75,000 to $99,999
- 30,376$100,000 to $124,999
- 19,506$125,000 to $149,999
- 20,067$150,000 to $199,999
- 23,591$200,000 or more
Percentage of workers working in this county: 82.4%
Number of people working at home: 261 (9.8% of all workers)
Travel time to work (commute)
- Less than 5 minutes: 64
- 5 to 9 minutes: 117
- 10 to 14 minutes: 292
- 15 to 19 minutes: 334
- 20 to 24 minutes: 508
- 25 to 29 minutes: 312
- 30 to 34 minutes: 406
- 35 to 39 minutes: 83
- 40 to 44 minutes: 134
- 45 to 59 minutes: 168
- 60 to 89 minutes: 84
- 90 or more minutes: 49
Means of transportation to work:
- Drove a car alone: 2,368 (91.0%)
- Carpooled: 159 (6.1%)
- Bus or trolley bus: 13 (0.5%)
- Walked: 11 (0.4%)
- Worked at home: 52 (2.0%)
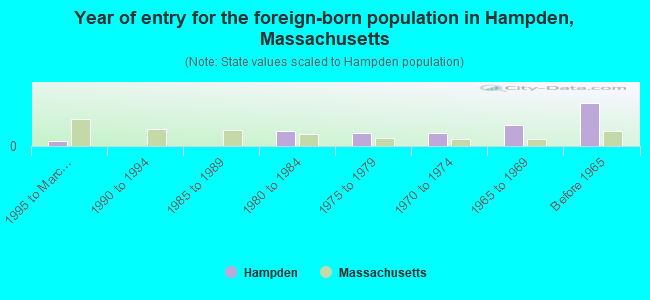
- Year of entry for the foreign-born population in Hampden, Massachusetts
- 71995 to March 2000
- 01990 to 1994
- 01985 to 1989
- 211980 to 1984
- 191975 to 1979
- 181970 to 1974
- 301965 to 1969
- 61Before 1965
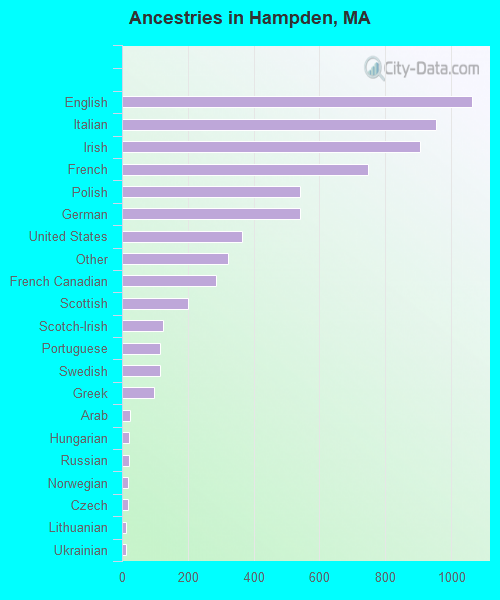
First ancestries reported:
- English: 1,062 (16.3%)
- Italian: 955 (14.6%)
- Irish: 906 (13.9%)
- French: 747 (11.4%)
- Polish: 542 (8.3%)
- German: 541 (8.3%)
- United States: 366 (5.6%)
- Other: 323 (4.9%)
- French Canadian: 285 (4.4%)
- Scottish: 201 (3.1%)
- Scotch-Irish: 125 (1.9%)
- Portuguese: 115 (1.8%)
- Swedish: 115 (1.8%)
- Greek: 97 (1.5%)
- Arab: 25 (0.4%)
- Hungarian: 22 (0.3%)
- Russian: 21 (0.3%)
- Norwegian: 19 (0.3%)
- Czech: 17 (0.3%)
- Lithuanian: 13 (0.2%)
- Ukrainian: 13 (0.2%)
- Danish: 7 (0.1%)
- Welsh: 6 (0.09%)
- Dutch: 5 (0.08%)
- Swiss: 5 (0.08%)
Most common places of birth for foreign-born residents (%):
| Hampden: | 23.1% (36) |
| Massachusetts: | 5.2% (40,247) |
| Hampden: | 19.9% (31) |
| Massachusetts: | 3.3% (25,403) |
| Hampden: | 17.3% (27) |
| Massachusetts: | 3.7% (28,319) |
| Hampden: | 9.0% (14) |
| Massachusetts: | 1.8% (13,543) |
| Hampden: | 8.3% (13) |
| Massachusetts: | 8.6% (66,627) |
| Hampden: | 5.1% (8) |
| Massachusetts: | 1.0% (7,414) |
| Hampden: | 3.8% (6) |
| Massachusetts: | 0.8% (5,895) |
| Hampden: | 3.8% (6) |
| Massachusetts: | 1.7% (12,975) |
| Hampden: | 3.2% (5) |
| Massachusetts: | 0.2% (1,418) |
| Hampden: | 3.2% (5) |
| Massachusetts: | 1.9% (14,883) |
| Hampden: | 3.2% (5) |
| Massachusetts: | 0.3% (2,242) |
Place of birth for U.S.-born residents:
- This state: 3,959
- Other state: 1,051
- Northeast: 761
- Midwest: 117
- South: 156
- West: 17
75% of Hampden residents lived in the same house 5 years ago.
Out of people who lived in different houses, 79% lived in this county.
Out of people who lived in different counties, 19% lived in Massachusetts.
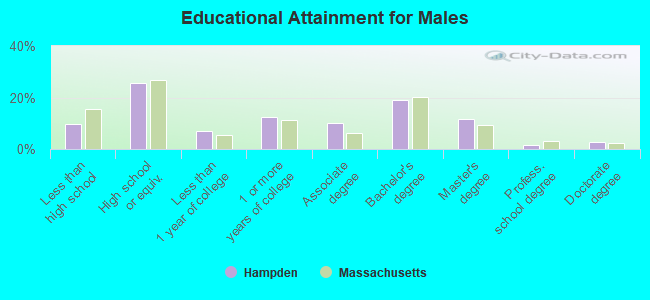
Education attainment for males 25 years and older:
- No schooling: 16
- Nursery to 4th grade: 0
- 5th and 6th grade: 0
- 7th and 8th grade: 23
- 9th grade: 11
- 10th grade: 32
- 11th grade: 56
- 12th grade, no diploma: 28
- High school graduate (or equivalency): 431
- Less than 1 year of college: 116
- Some college more than 1 year, no degree: 207
- Associate degree: 171
- Bachelor's degree: 322
- Master's degree: 196
- Professional school degree: 24
- Doctorate degree: 48
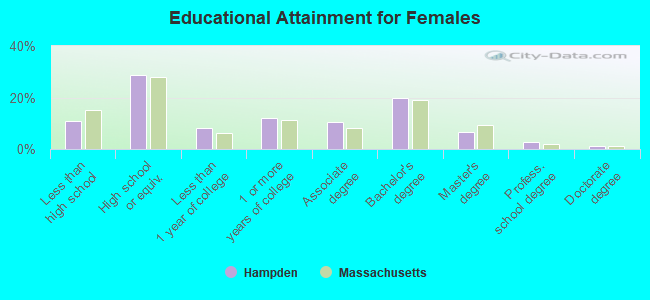
Education attainment for females 25 years and older:
- No schooling: 21
- Nursery to 4th grade: 8
- 5th and 6th grade: 0
- 7th and 8th grade: 32
- 9th grade: 0
- 10th grade: 23
- 11th grade: 72
- 12th grade, no diploma: 43
- High school graduate (or equivalency): 530
- Less than 1 year of college: 149
- Some college more than 1 year, no degree: 223
- Associate degree: 198
- Bachelor's degree: 367
- Master's degree: 122
- Professional school degree: 48
- Doctorate degree: 20
Housing units in structures:
- One, detached: 1,743
- One, attached: 12
- Two: 18
- 3 or 4: 28
- 5 to 9: 23
- 20 to 49: 17
- 50 or more: 5
Housing units lacking complete kitchen facilities: 0.4%

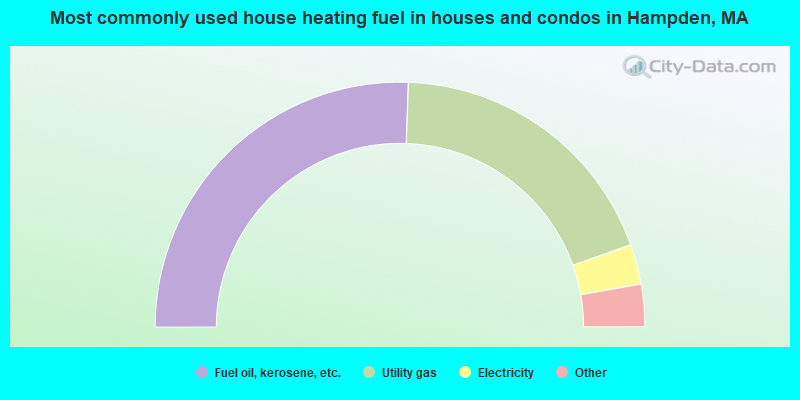
- 51.1%Fuel oil, kerosene, etc.
- 38.0%Utility gas
- 5.3%Electricity
- 2.7%Bottled, tank, or LP gas
- 2.6%Wood
- 0.3%Other fuel
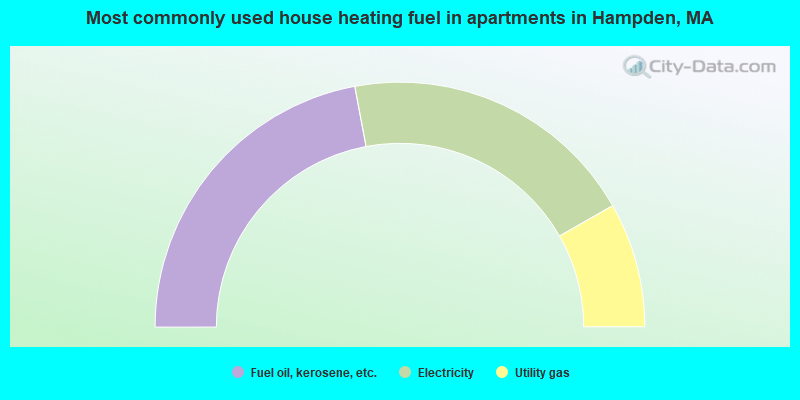
- 44.1%Fuel oil, kerosene, etc.
- 39.4%Electricity
- 16.5%Utility gas
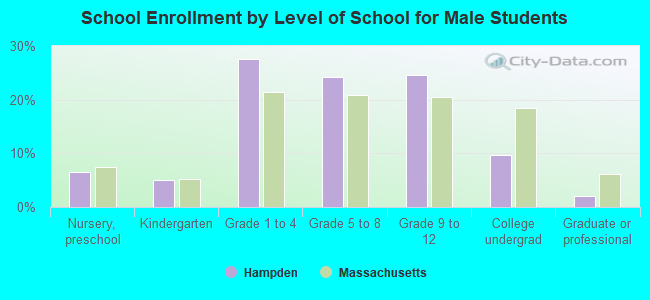
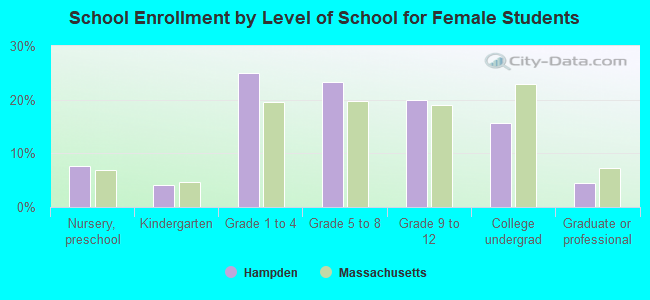
Private vs. public school enrollment:
| Here: | 6.0% |
| Massachusetts: | 10.8% |
| Here: | 9.1% |
| Massachusetts: | 12.2% |
| Here: | 12.4% |
| Massachusetts: | 48.2% |