Hanover, NH (New Hampshire) Houses and Residents
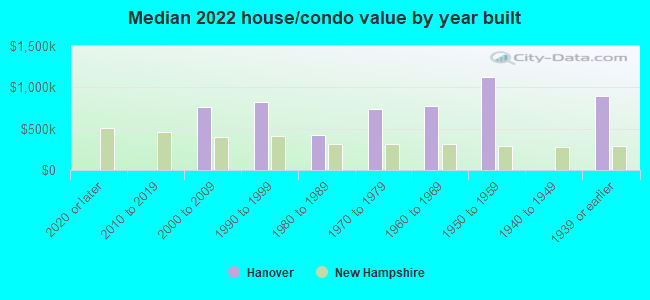
| Hanover: | $809,101 |
| New Hampshire: | $384,700 |
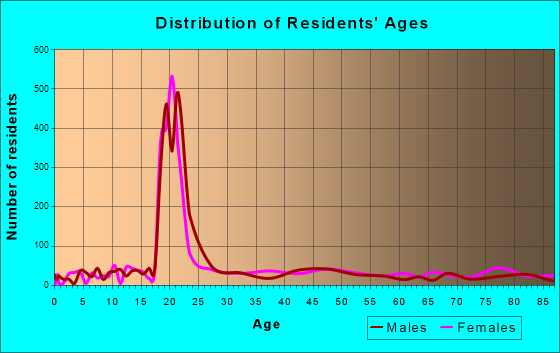
Total population: 8,636 (Urban population: 8,116 (all inside urban clusters), Rural population: 56 (all nonfarm))
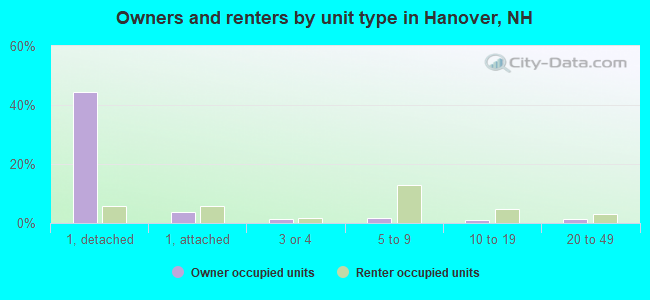
Houses: 2,539 (1,994 occupied: 1,197 owner occupied, 928 renter occupied)
| % of renters here: | 44% |
| State: | 28% |
Housing density: 558 houses/condos per square mile
Median price asked for vacant for-sale houses and condos in 2022: $1,617,000.
Median contract rent in 2022: $1,844 (lower quartile is $1,315, upper quartile is over $2,000)
Median rent asked for vacant for-rent units in 2022: $4,554
Median gross rent in Hanover, NH in 2022: $1,995
Housing units in Hanover with a mortgage: 619 (9 second mortgage, 0 home equity loan, 10 both second mortgage and home equity loan)
Houses without a mortgage: 0
Median household income for houses/condos with a mortgage: $244,415
Median household income for apartments without a mortgage: $233,845
Median monthly housing costs: $2,054
Compare current foreclosures near Hanover, NH:
| Photo | Address | Area | Beds / Baths | Price | Details |
|---|---|---|---|---|---|

|
#1
Doe Hill Way
Woodstock, VT 05091
|
1,264 sq. feet
|
1 baths 1 beds |
$262,900
|
show details |

|
#2
Downing Rd
Hanover, NH 03755
|
- sq. feet
|
- baths - beds |
show details | |

|
#3
Winter St W
West Lebanon, NH 03784
|
894 sq. feet
|
1 baths 2 beds |
show details | |

|
#4
Benton St
Lebanon, NH 03766
|
1,234 sq. feet
|
1 baths 3 beds |
show details | |

|
#5
Bank Street Ext
Lebanon, NH 03766
|
1,232 sq. feet
|
1 baths 4 beds |
show details | |

|
#6
Orchard Rd
Enfield, NH 03748
|
1,056 sq. feet
|
2 baths 2 beds |
show details | |

|
#7
Prospect Hill Rd
Canaan, NH 03741
|
- sq. feet
|
1 baths 4 beds |
show details | |

|
#8
Renihan Mdws
Lebanon, NH 03766
|
- sq. feet
|
- baths - beds |
show details | |

|
#9
Seminary Hl Apt 3a
West Lebanon, NH 03784
|
- sq. feet
|
- baths - beds |
show details | |

|
#10
S Main St Apt 2
White River Junction, VT 05001
|
- sq. feet
|
- baths - beds |
show details |
| Photo | Address | Area | Beds / Baths | Price | Details |
|---|---|---|---|---|---|

|
#11
Us Route 4, Unit 5
Enfield, NH 03748
|
- sq. feet
|
- baths - beds |
show details | |

|
#12
Dawn Dr
White River Junction, VT 05001
|
- sq. feet
|
- baths - beds |
show details | |

|
#13
Dairy Hill Rd
South Royalton, VT 05068
|
- sq. feet
|
- baths - beds |
show details | |

|
Check over 1 million property listings on Foreclosure.com!
|
browse all offers | |||

Latest news about housing in Hanover, NH collected exclusively by city-data.com from local newspapers, TV, and radio stations

 | $4,400 apartment rental in Lebanon, NH (32 replies) |
| Why are houses cheaper in NH than in VT? (13 replies) |
| Emerson Place Apartments, MeadowBrook Village or Stone Farm Apartments? (1 reply) |
| Gile Hill apartments in Hanover (0 replies) |
| Apartments on Pine Street, Manchester? (13 replies) |
| Living between Hanover and Boston (5 replies) |
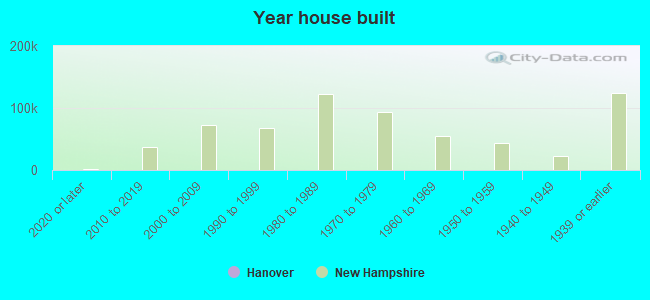
Median year apartment built: 1982
Household type by relationship:
Households: 8,260- Male householders: 816 (306 living alone), Female householders: 1,160 (462 living alone)
974 spouses (957 opposite-sex spouses), 91 unmarried partners, (91 opposite-sex unmarried partners), 846 children (824 natural, 7 adopted, 15 stepchildren), 50 grandchildren, 0 brothers or sisters, 0 parents, 0 foster children, 95 other relatives, 419 non-relatives
- In group quarters: 3,806
Size of family households: 544 2-persons, 156 3-persons, 269 4-persons, 97 5-persons, 9 6-persons.
Size of nonfamily households: 764 1-person, 176 2-persons, 58 3-persons, 40 4-persons.
577 married couples with children.
86 single-parent households (23 men, 63 women).
84.5% of residents of Hanover speak English at home.
2.3% of residents speak Spanish at home (96% speak English very well, 4% speak English well).
4.8% of residents speak other Indo-European language at home (96% speak English very well, 1% speak English well, 2% speak English not well, 2% don't speak English at all).
5.7% of residents speak Asian or Pacific Island language at home (83% speak English very well, 17% speak English well).
1.9% of residents speak other language at home (93% speak English very well, 7% speak English well).
Foreign born population: 1,505 (18.2%)
(43.7% of them are naturalized citizens)
| Here: | 7.8 |
| State: | 6.4 |
| Here: | 3.8 |
| State: | 4.0 |
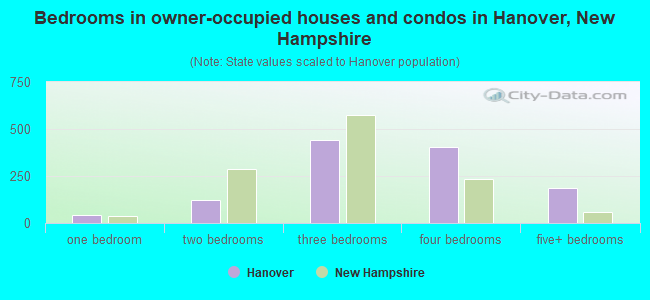
- Bedrooms in owner-occupied houses and condos in Hanover, New Hampshire
- 0no bedroom
- 451 bedroom
- 1212 bedrooms
- 4403 bedrooms
- 4064 bedrooms
- 1865+ bedrooms
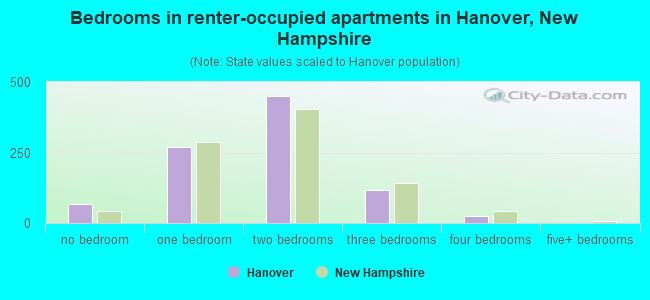
- Bedrooms in renter-occupied apartments in Hanover, New Hampshire
- 69no bedroom
- 2691 bedroom
- 4502 bedrooms
- 1173 bedrooms
- 254 bedrooms
- 05+ bedrooms
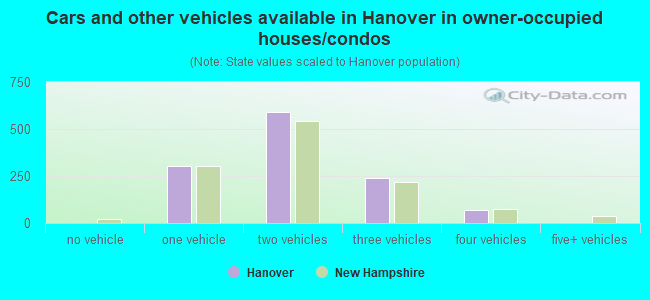
- Cars and other vehicles available in Hanover in owner-occupied houses/condos
- 0no vehicle
- 3021 vehicle
- 5882 vehicles
- 2393 vehicles
- 684 vehicles
- 05+ vehicles
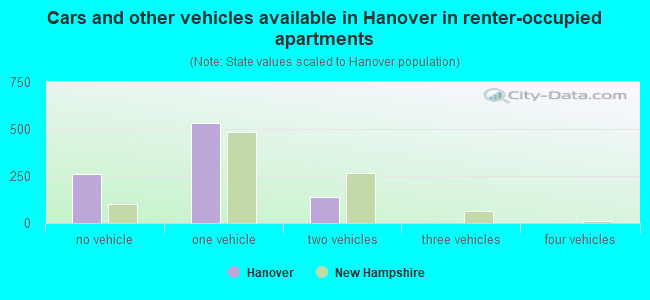
- Cars and other vehicles available in Hanover in renter-occupied apartments
- 260no vehicle
- 5311 vehicle
- 1382 vehicles
- 03 vehicles
- 04 vehicles
- 05+ vehicles
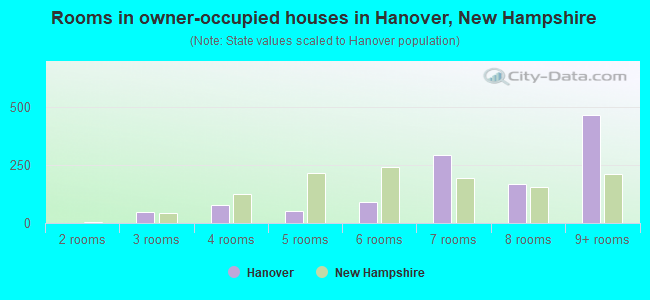
- Rooms in owner-occupied houses in Hanover, New Hampshire
- 01 room
- 02 rooms
- 493 rooms
- 764 rooms
- 535 rooms
- 926 rooms
- 2927 rooms
- 1708 rooms
- 4669+ rooms
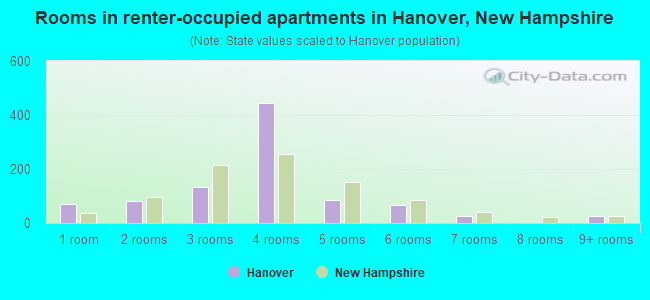
- Rooms in renter-occupied apartments in Hanover, New Hampshire
- 691 room
- 812 rooms
- 1323 rooms
- 4444 rooms
- 875 rooms
- 666 rooms
- 257 rooms
- 08 rooms
- 259+ rooms
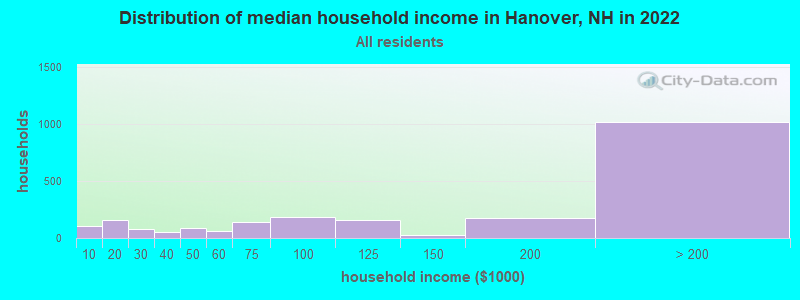
Hanover, NH household income distribution

- 105Less than $10,000
- 162$10,000 to $19,999
- 76$20,000 to $29,999
- 55$30,000 to $39,999
- 92$40,000 to $49,999
- 62$50,000 to $59,999
- 138$60,000 to $74,999
- 183$75,000 to $99,999
- 159$100,000 to $124,999
- 27$125,000 to $149,999
- 176$150,000 to $199,999
- 1,017$200,000 or more
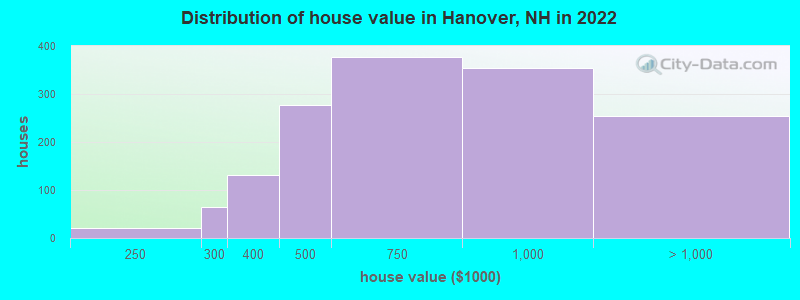
Home value of owner - occupied houses in 2022 in Hanover, NH
-
- 3$125,000 to $149,999
- 21$200,000 to $249,999
- 65$250,000 to $299,999
- 131$300,000 to $399,999
- 277$400,000 to $499,999
- 377$500,000 to $749,999
- 354$750,000 to $999,999
- 127$1,000,000 to $1,499,999
- 7$1,500,000 to $1,999,999
- 120$2,000,000 or more
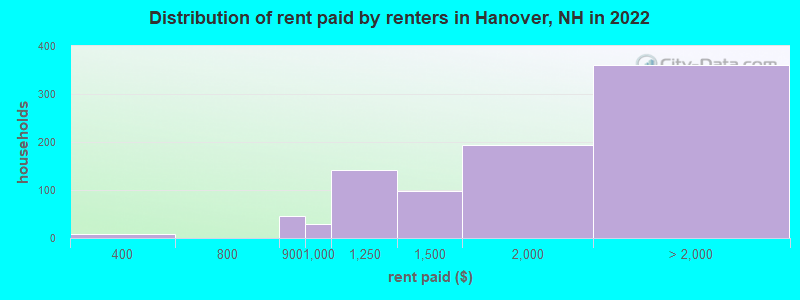
Rent paid by renters in 2022 in Hanover, NH
-
- 8$300 to $349
- 46$800 to $899
- 29$900 to $999
- 142$1,000 to $1,249
- 96$1,250 to $1,499
- 194$1,500 to $1,999
- 74$2,000 to $2,499
- 20$2,500 to $2,999
- 46$3,000 to $3,499
- 133$3,500 or more
- 86No cash rent
Percentage of workers working in this county: 92.0%
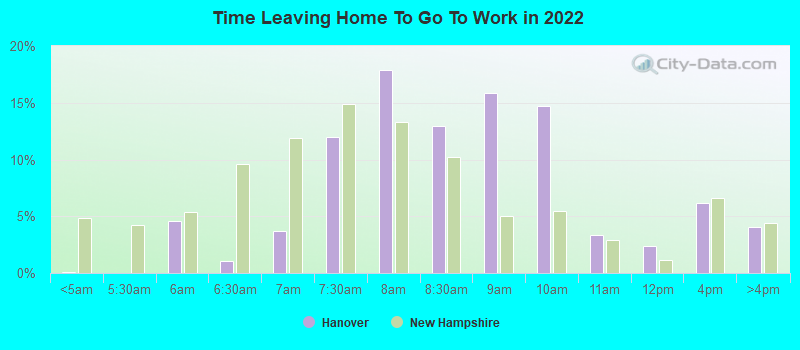
Number of people working at home: 898 (30.8% of all workers)
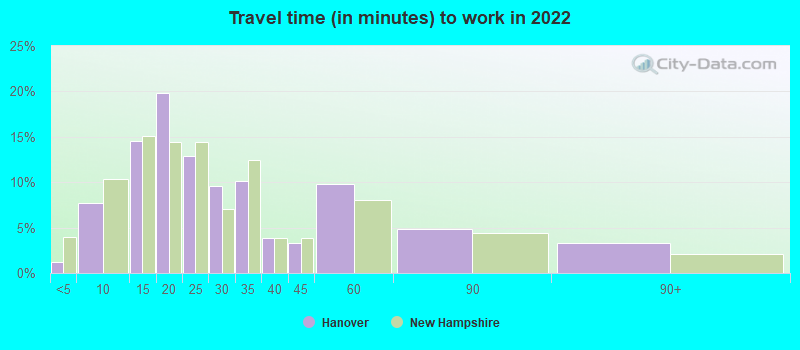
Travel time to work (commute)
- Less than 5 minutes: 53
- 5 to 9 minutes: 492
- 10 to 14 minutes: 718
- 15 to 19 minutes: 580
- 20 to 24 minutes: 113
- 25 to 29 minutes: 34
- 30 to 34 minutes: 23
- 35 to 39 minutes: 11
- 40 to 44 minutes: 12
- 45 to 59 minutes: 3
- 60 to 89 minutes: 50
- 90 or more minutes: 64
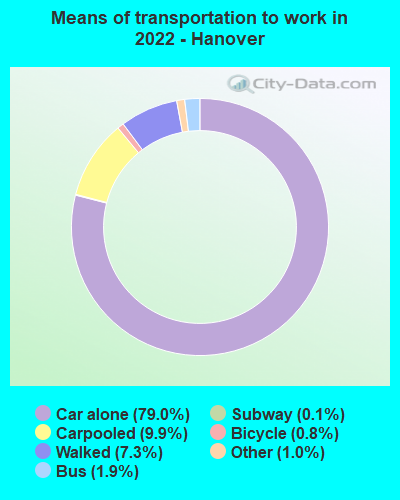
Means of transportation to work:
- Drove a car alone: 6,023 (68.1%)
- Carpooled: 901 (10.2%)
- Bus: 77 (0.9%)
- Long-distance train or commuter rail: 6 (0.1%)
- Taxi: 96 (1.1%)
- Bicycle: 69 (0.8%)
- Walked: 555 (6.3%)
- Worked at home: 898 (10.2%)
- Unemployment by race in 2022
- Unemployment rate for White non-Hispanic residents
- 5.8%Males
- 1.6%Females
- Unemployment rate for two or more race residents
- 14.3%Males
- 7.0%Females
- Unemployment rate for Hispanic or Latino residents
- 3.4%Males
- 19.6%Females
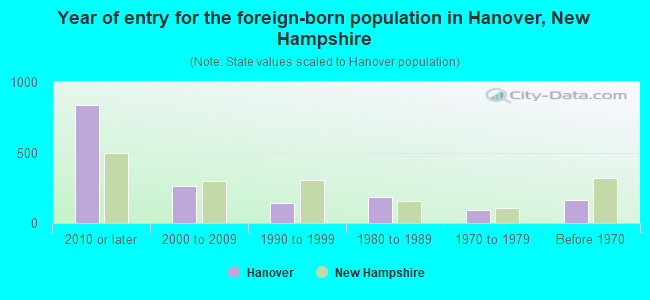
- Year of entry for the foreign-born population in Hanover, New Hampshire
- 8392010 or later
- 2602000 to 2009
- 1401990 to 1999
- 1841980 to 1989
- 921970 to 1979
- 165Before 1970
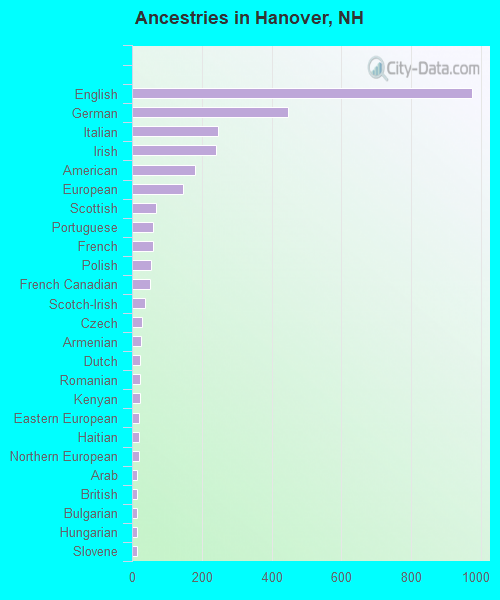
First ancestries reported:
- English: 974 (22.3%)
- German: 446 (10.2%)
- Italian: 247 (5.7%)
- Irish: 242 (5.5%)
- American: 181 (4.1%)
- European: 147 (3.4%)
- Scottish: 69 (1.6%)
- Portuguese: 61 (1.4%)
- French: 59 (1.4%)
- Polish: 53 (1.2%)
- French Canadian: 52 (1.2%)
- Scotch-Irish: 36 (0.8%)
- Czech: 28 (0.6%)
- Armenian: 27 (0.6%)
- Dutch: 23 (0.5%)
- Romanian: 23 (0.5%)
- Kenyan: 22 (0.5%)
- Eastern European: 21 (0.5%)
- Haitian: 20 (0.5%)
- Northern European: 19 (0.4%)
- Arab: 14 (0.3%)
- British: 14 (0.3%)
- Bulgarian: 14 (0.3%)
- Hungarian: 14 (0.3%)
- Slovene: 14 (0.3%)
- African: 11 (0.3%)
- Lithuanian: 11 (0.3%)
- Greek: 8 (0.2%)
- Jamaican: 8 (0.2%)
- Russian: 7 (0.2%)
- Nigerian: 7 (0.2%)
- Scandinavian: 7 (0.2%)
- Swedish: 7 (0.2%)
- Turkish: 6 (0.1%)
- Brazilian: 3 (0.07%)
- Ethiopian: 3 (0.07%)
- Ghanaian: 2 (0.05%)
- Danish: 2 (0.05%)
Most common places of birth for foreign-born residents (%):
| Hanover: | 11.2% (162) |
| New Hampshire: | 9.1% (7,618) |
| Hanover: | 8.1% (118) |
| New Hampshire: | 0.8% (705) |
| Hanover: | 7.5% (109) |
| New Hampshire: | 9.1% (7,609) |
| Hanover: | 5.8% (84) |
| New Hampshire: | 3.3% (2,742) |
| Hanover: | 5.4% (78) |
| New Hampshire: | 4.5% (3,775) |
| Hanover: | 5.4% (78) |
| New Hampshire: | 2.0% (1,650) |
| Hanover: | 4.4% (63) |
| New Hampshire: | 2.7% (2,211) |
| Hanover: | 4.2% (61) |
| New Hampshire: | 3.6% (2,964) |
| Hanover: | 4.1% (59) |
| New Hampshire: | 0.4% (358) |
| Hanover: | 3.8% (55) |
| New Hampshire: | 1.9% (1,607) |
| Hanover: | 3.1% (45) |
| New Hampshire: | 0.4% (311) |
| Hanover: | 3.0% (44) |
| New Hampshire: | 0.9% (729) |
| Hanover: | 2.4% (35) |
| New Hampshire: | 0.6% (467) |
| Hanover: | 2.3% (34) |
| New Hampshire: | 0.5% (447) |
| Hanover: | 2.2% (32) |
| New Hampshire: | 0.5% (380) |
| Hanover: | 2.0% (29) |
| New Hampshire: | 3.3% (2,768) |
| Hanover: | 1.6% (23) |
| New Hampshire: | 0.2% (158) |
Place of birth for U.S.-born residents:
- This state: 1,017
- Other state: 5,630
- Northeast: 2,934
- Midwest: 775
- South: 1,189
- West: 645
75.1% of Hanover residents lived in the same house 1 years ago.
Out of people who lived in different houses, 15.4% lived in this county.
Out of people who lived in different counties, 11.4% lived in New Hampshire.
| Hanover: | 75.1% |
| State average: | 89.8% |
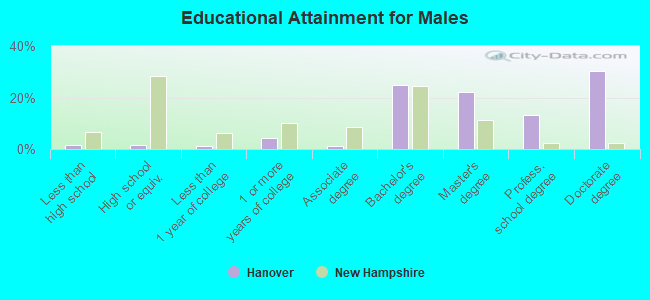
Education attainment for males 25 years and older:
- No schooling: 0
- Nursery to 4th grade: 0
- 5th and 6th grade: 0
- 7th and 8th grade: 28
- 9th grade: 0
- 10th grade: 0
- 11th grade: 0
- 12th grade, no diploma: 0
- High school graduate (or equivalency): 30
- Less than 1 year of college: 21
- Some college more than 1 year, no degree: 81
- Associate degree: 19
- Bachelor's degree: 459
- Master's degree: 409
- Professional school degree: 241
- Doctorate degree: 564
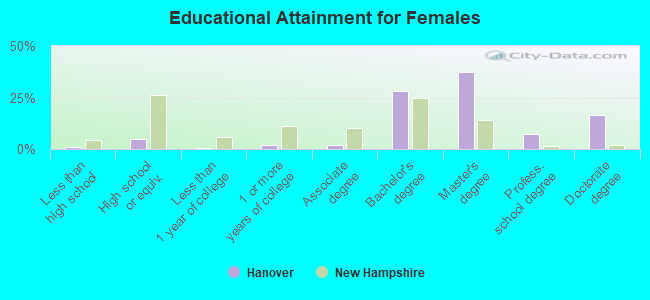
Education attainment for females 25 years and older:
- No schooling: 15
- Nursery to 4th grade: 1
- 5th and 6th grade: 0
- 7th and 8th grade: 8
- 9th grade: 0
- 10th grade: 0
- 11th grade: 0
- 12th grade, no diploma: 0
- High school graduate (or equivalency): 95
- Less than 1 year of college: 14
- Some college more than 1 year, no degree: 37
- Associate degree: 37
- Bachelor's degree: 565
- Master's degree: 751
- Professional school degree: 147
- Doctorate degree: 327
Housing units in structures:
- One, detached: 1,224
- One, attached: 199
- Two: 69
- 3 or 4: 64
- 5 to 9: 260
- 10 to 19: 319
- 20 to 49: 117
- 50 or more: 259
- Mobile homes: 17
- Boats, RVs, vans, etc.: 7
Housing units lacking complete kitchen facilities in 2022: 2.2%
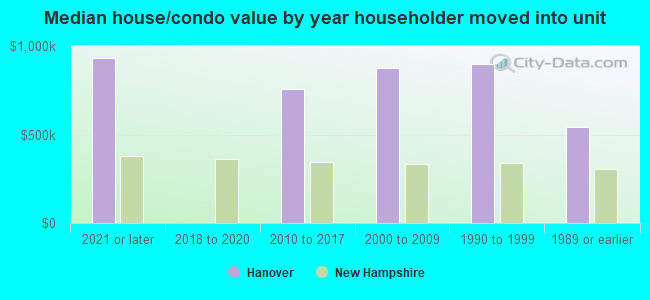
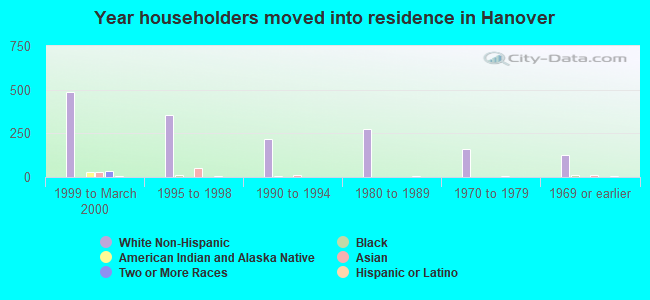
House/condo owner moved in on average 11 years ago
Renter moved in on average 5 years ago
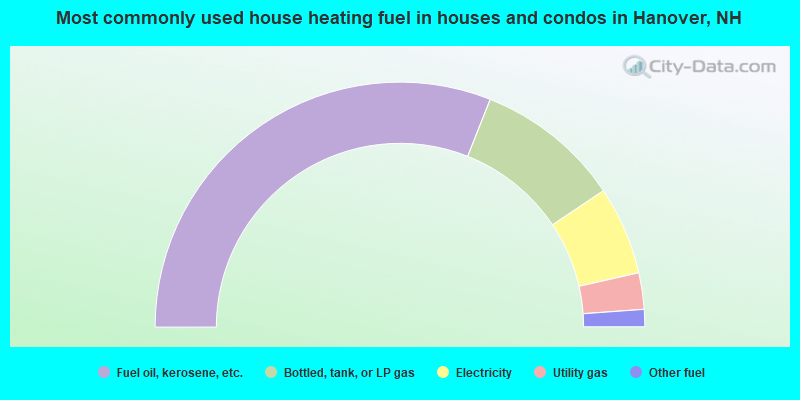
- 62.1%Fuel oil, kerosene, etc.
- 19.2%Bottled, tank, or LP gas
- 11.7%Electricity
- 4.8%Utility gas
- 2.3%Other fuel

- 32.1%Fuel oil, kerosene, etc.
- 24.9%Utility gas
- 23.6%Electricity
- 13.6%Bottled, tank, or LP gas
- 3.9%Other fuel
- 2.0%No fuel used
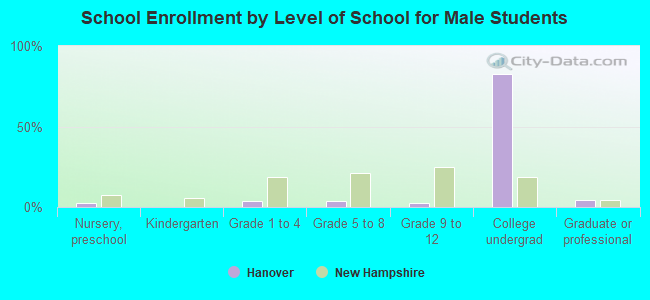
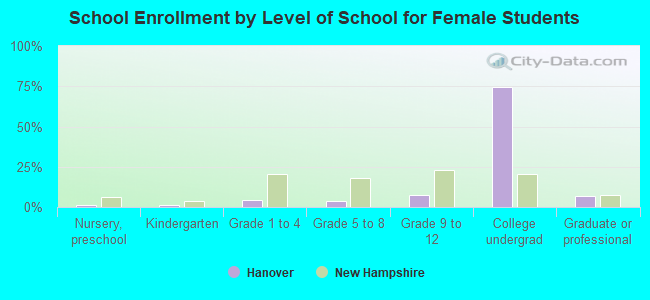
Private vs. public school enrollment:
| Here: | 0.0% |
| New Hampshire: | 11.4% |
| Here: | 2.4% |
| New Hampshire: | 14.0% |
| Here: | 81.1% |
| New Hampshire: | 38.0% |