Happy Valley, OR (Oregon) Houses and Residents
| Happy Valley: | $729,933 |
| Oregon: | $475,600 |
Mean price in 2022:
Detached houses: $810,590
Here: $810,590 State: $562,872 Townhouses or other attached units: $559,512
Here: $559,512 State: $463,029 In 5-or-more-unit structures: $442,574
Here: $442,574 State: $420,389 Mobile homes: $81,790
Here: $81,790 State: $214,044
Total population: 17,319 (Urban population: 4,889, Rural population: 0)
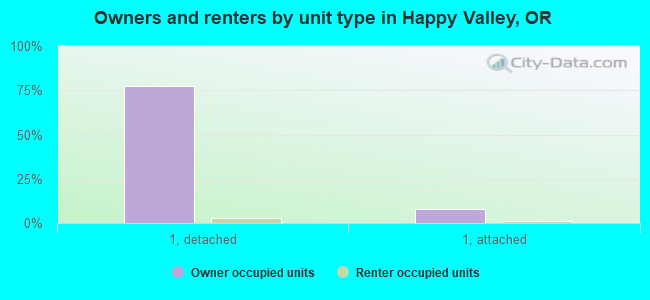
Houses: 8,590 (8,321 occupied: 6,911 owner occupied, 1,379 renter occupied)
| % of renters here: | 17% |
| State: | 37% |
Housing density: 3,182 houses/condos per square mile
Median price asked for vacant for-sale houses and condos in 2022: $947,273.
Median contract rent in 2022: $1,759 (lower quartile is $1,422, upper quartile is over $2,000)
Median gross rent in Happy Valley, OR in 2022: $1,955
Housing units in Happy Valley with a mortgage: 5,130 (824 second mortgage, 67 home equity loan, 658 both second mortgage and home equity loan)
Houses without a mortgage: 96
Median household income for houses/condos with a mortgage: $147,788
Median household income for apartments without a mortgage: $91,417
Median monthly housing costs: $2,220
Compare current foreclosures in Happy Valley, OR:
| Photo | Address | Area | Beds / Baths | Price | Details |
|---|---|---|---|---|---|

|
#1
SE Pheasant Ridge Dr
Happy Valley, OR 97086
|
5,052 sq. feet
|
4 baths 4 beds |
show details | |

|
#2
SE Sunshadow St
Happy Valley, OR 97086
|
5,002 sq. feet
|
4 baths 5 beds |
show details | |

|
#3
SE Verlie St
Happy Valley, OR 97086
|
- sq. feet
|
2 baths 4 beds |
show details | |

|
#4
SE Kisor Ct
Happy Valley, OR 97086
|
2,218 sq. feet
|
2 baths 4 beds |
show details | |

|
#5
SE Bari Ave
Happy Valley, OR 97086
|
5,971 sq. feet
|
3 baths 4 beds |
show details | |

|
#6
SE Saint Lucy Ln
Happy Valley, OR 97086
|
2,593 sq. feet
|
2 baths 3 beds |
show details | |

|
#7
SE 132nd Ave
Happy Valley, OR 97086
|
2,870 sq. feet
|
3 baths 3 beds |
show details | |

|
#8
SE Wyndham Way
Happy Valley, OR 97086
|
2,273 sq. feet
|
2 baths 3 beds |
show details | |

|
#9
SE Lenore St
Happy Valley, OR 97086
|
4,202 sq. feet
|
4 baths 6 beds |
show details | |

|
#10
SE 132nd Ave
Happy Valley, OR 97086
|
1,613 sq. feet
|
1 baths 3 beds |
show details |
| Photo | Address | Area | Beds / Baths | Price | Details |
|---|---|---|---|---|---|

|
#11
SE Hampshire Dr
Happy Valley, OR 97086
|
1,992 sq. feet
|
2 baths 3 beds |
show details | |

|
#12
SE Links Ave
Happy Valley, OR 97086
|
4,016 sq. feet
|
3 baths 5 beds |
show details | |

|
#13
SE Bari Ave
Happy Valley, OR 97086
|
- sq. feet
|
3 baths 4 beds |
show details | |

|
#14
SE Francesca Ln
Happy Valley, OR 97086
|
- sq. feet
|
2 baths 4 beds |
show details | |

|
#15
SE Hilltop Ct
Happy Valley, OR 97086
|
- sq. feet
|
4 baths 5 beds |
show details | |

|
#16
SE Aerie Crescent Rd
Happy Valley, OR 97086
|
- sq. feet
|
2 baths 4 beds |
show details | |

|
#17
SE Fuller Rd Unit 35
Happy Valley, OR 97086
|
- sq. feet
|
- baths - beds |
show details | |

|
#18
SE 169th Ave, Apt 153
Happy Valley, OR 97086
|
- sq. feet
|
- baths - beds |
show details | |

|
#19
SE Creekside Ter
Happy Valley, OR 97086
|
- sq. feet
|
- baths - beds |
show details | |

|
#20
SE 90th Ave Apt 1232
Happy Valley, OR 97086
|
- sq. feet
|
- baths - beds |
show details |
| Photo | Address | Area | Beds / Baths | Price | Details |
|---|---|---|---|---|---|

|
#21
SE Stevens Rd # C208
Happy Valley, OR 97086
|
- sq. feet
|
- baths - beds |
show details | |

|
#22
SE Stevens Rd
Happy Valley, OR 97086
|
- sq. feet
|
- baths - beds |
show details | |

|
#23
SE Stevens Rd # A-215
Happy Valley, OR 97086
|
- sq. feet
|
- baths - beds |
show details | |

|
#24
SE Johnson Creek Blvd Apt E106
Happy Valley, OR 97086
|
- sq. feet
|
- baths - beds |
show details | |

|
#25
SE 108th Ave
Happy Valley, OR 97086
|
- sq. feet
|
- baths - beds |
show details | |

|
#26
SE Misty Dr Apt 208
Happy Valley, OR 97086
|
- sq. feet
|
- baths - beds |
show details | |

|
#27
SW 162nd Ave, Unit 212
Happy Valley, OR 97086
|
- sq. feet
|
- baths - beds |
show details | |

|
#28
SE Johnson Creek Blvd Apt Q106
Happy Valley, OR 97086
|
- sq. feet
|
- baths - beds |
show details | |

|
#29
SE Stillwater Ln
Happy Valley, OR 97086
|
- sq. feet
|
- baths - beds |
show details | |

|
#30
SE Misty Dr Apt 402
Happy Valley, OR 97086
|
- sq. feet
|
- baths - beds |
show details |
| Photo | Address | Area | Beds / Baths | Price | Details |
|---|---|---|---|---|---|

|
#31
SE Huckleberry St
Happy Valley, OR 97086
|
- sq. feet
|
- baths - beds |
show details | |

|
#32
SE Sun Crest Dr
Happy Valley, OR 97086
|
- sq. feet
|
- baths - beds |
show details | |

|
#33
SE Stevens Rd # D303
Happy Valley, OR 97086
|
- sq. feet
|
- baths - beds |
show details | |

|
#34
SE Stevens Rd
Happy Valley, OR 97086
|
- sq. feet
|
- baths - beds |
show details | |

|
Check over 1 million property listings on Foreclosure.com!
|
browse all offers | |||


 | Wave of evictions leaves renters few options in record-setting apartment market (131 replies) |
| Will house prices ever go down? (62 replies) |
| Diversity & Inclusion in Happy Valley/West Linn, OR? (10 replies) |
| Renting a house near PDX Airport (39 replies) |
| I'm curious about Happy Valley (6 replies) |
| Portland rents expected to rise more than most U.S. cities this year (71 replies) |

Median year apartment built: 2015
Household type by relationship:
Households: 24,511- Male householders: 4,794 (605 living alone), Female householders: 3,397 (631 living alone)
5,245 spouses (5,221 opposite-sex spouses), 454 unmarried partners, (454 opposite-sex unmarried partners), 8,168 children (7,541 natural, 192 adopted, 435 stepchildren), 339 grandchildren, 241 brothers or sisters, 532 parents, 3 foster children, 441 other relatives, 820 non-relatives
- In group quarters: 72
Size of family households: 2,509 2-persons, 1,481 3-persons, 1,562 4-persons, 739 5-persons, 245 6-persons, 129 7-or-more-persons.
Size of nonfamily households: 1,232 1-person, 399 2-persons, 35 3-persons, 5 4-persons.
4,272 married couples with children.
1,831 single-parent households (639 men, 1,192 women).
80.4% of residents of Happy Valley speak English at home.
3.6% of residents speak Spanish at home (78% speak English very well, 13% speak English well, 8% speak English not well).
3.3% of residents speak other Indo-European language at home (69% speak English very well, 16% speak English well, 14% speak English not well, 1% don't speak English at all).
12.0% of residents speak Asian or Pacific Island language at home (54% speak English very well, 25% speak English well, 21% speak English not well).
0.3% of residents speak other language at home (100% speak English very well).
Foreign born population: 3,571 (14.6%)
(71.8% of them are naturalized citizens)
| Here: | 7.5 |
| State: | 6.2 |
| Here: | 4.2 |
| State: | 4.0 |
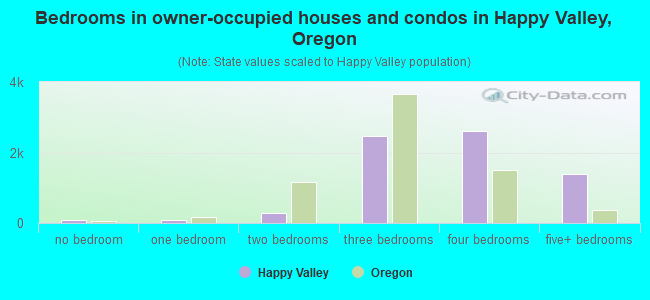
- Bedrooms in owner-occupied houses and condos in Happy Valley, Oregon
- 73no bedroom
- 791 bedroom
- 2972 bedrooms
- 2,4573 bedrooms
- 2,6144 bedrooms
- 1,3905+ bedrooms
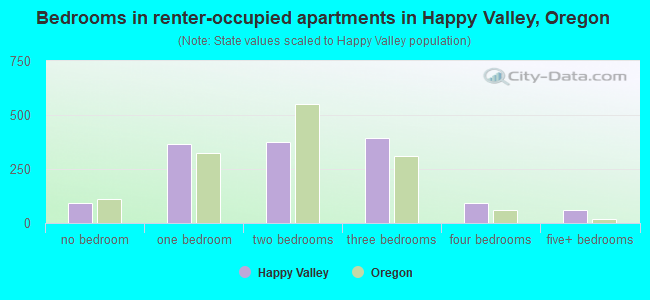
- Bedrooms in renter-occupied apartments in Happy Valley, Oregon
- 94no bedroom
- 3671 bedroom
- 3762 bedrooms
- 3923 bedrooms
- 914 bedrooms
- 605+ bedrooms
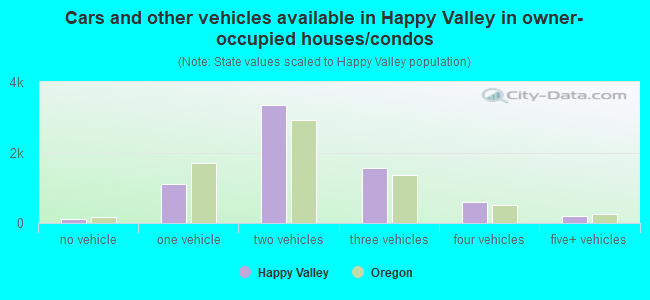
- Cars and other vehicles available in Happy Valley in owner-occupied houses/condos
- 119no vehicle
- 1,1031 vehicle
- 3,3502 vehicles
- 1,5613 vehicles
- 5854 vehicles
- 1935+ vehicles
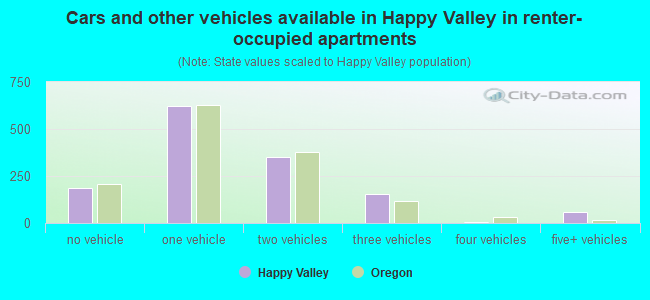
- Cars and other vehicles available in Happy Valley in renter-occupied apartments
- 186no vehicle
- 6211 vehicle
- 3512 vehicles
- 1553 vehicles
- 64 vehicles
- 615+ vehicles
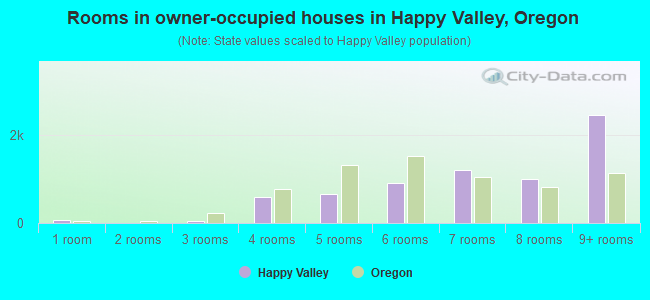
- Rooms in owner-occupied houses in Happy Valley, Oregon
- 731 room
- 02 rooms
- 383 rooms
- 5934 rooms
- 6555 rooms
- 9156 rooms
- 1,1957 rooms
- 1,0008 rooms
- 2,4429+ rooms
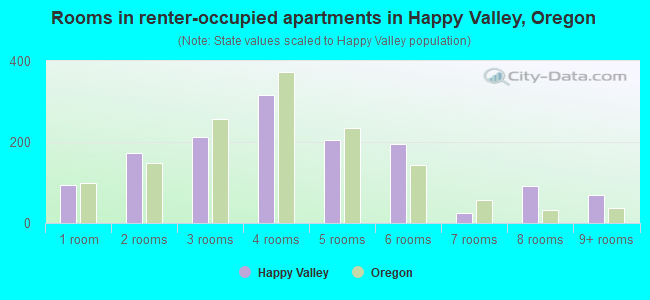
- Rooms in renter-occupied apartments in Happy Valley, Oregon
- 941 room
- 1732 rooms
- 2133 rooms
- 3164 rooms
- 2045 rooms
- 1956 rooms
- 257 rooms
- 928 rooms
- 689+ rooms
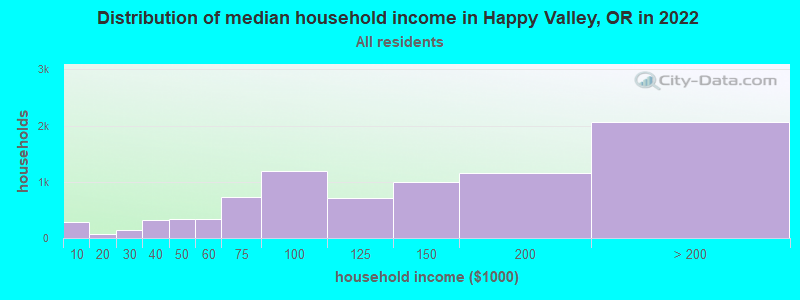
Happy Valley, OR household income distribution

- 281Less than $10,000
- 75$10,000 to $19,999
- 136$20,000 to $29,999
- 328$30,000 to $39,999
- 340$40,000 to $49,999
- 345$50,000 to $59,999
- 729$60,000 to $74,999
- 1,194$75,000 to $99,999
- 718$100,000 to $124,999
- 999$125,000 to $149,999
- 1,155$150,000 to $199,999
- 2,064$200,000 or more
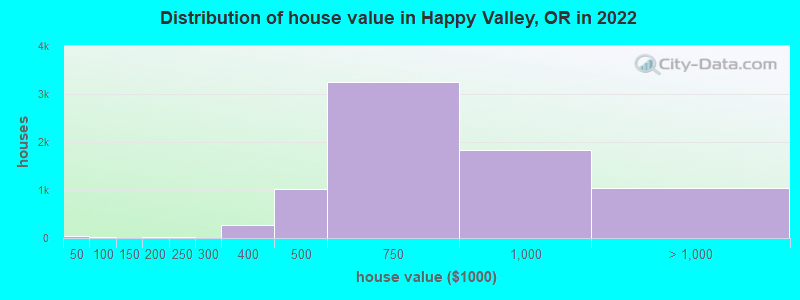
Home value of owner - occupied houses in 2022 in Happy Valley, OR
-
- 3$10,000 to $14,999
- 15$15,000 to $19,999
- 16$25,000 to $29,999
- 9$40,000 to $49,999
- 13$60,000 to $69,999
- 4$100,000 to $124,999
- 24$150,000 to $174,999
- 11$200,000 to $249,999
- 7$250,000 to $299,999
- 270$300,000 to $399,999
- 1,013$400,000 to $499,999
- 3,246$500,000 to $749,999
- 1,826$750,000 to $999,999
- 764$1,000,000 to $1,499,999
- 226$1,500,000 to $1,999,999
- 57$2,000,000 or more
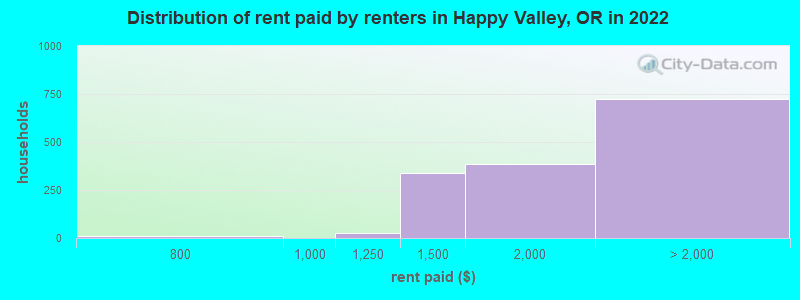
Rent paid by renters in 2022 in Happy Valley, OR
-
- 11$700 to $749
- 26$1,000 to $1,249
- 340$1,250 to $1,499
- 388$1,500 to $1,999
- 407$2,000 to $2,499
- 11$2,500 to $2,999
- 19$3,000 to $3,499
- 26$3,500 or more
- 260No cash rent
Percentage of workers working in this county: 54.5%
Number of people working at home: 3,128 (25.5% of all workers)
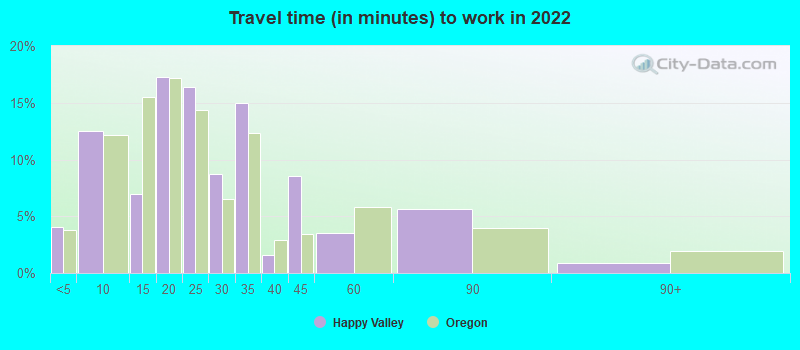
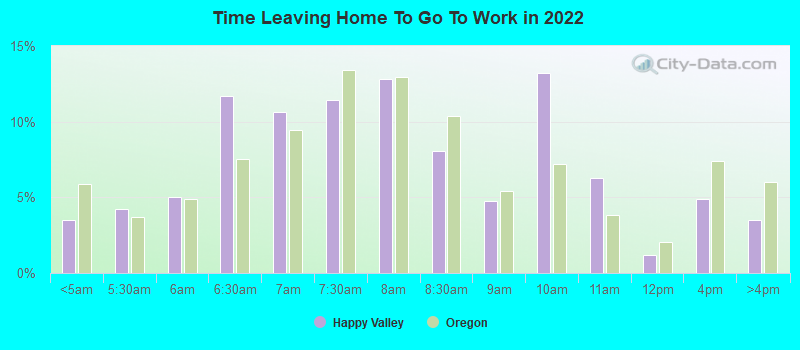
Travel time to work (commute)
- Less than 5 minutes: 200
- 5 to 9 minutes: 826
- 10 to 14 minutes: 1,151
- 15 to 19 minutes: 1,134
- 20 to 24 minutes: 1,376
- 25 to 29 minutes: 1,144
- 30 to 34 minutes: 1,396
- 35 to 39 minutes: 320
- 40 to 44 minutes: 505
- 45 to 59 minutes: 575
- 60 to 89 minutes: 458
- 90 or more minutes: 218
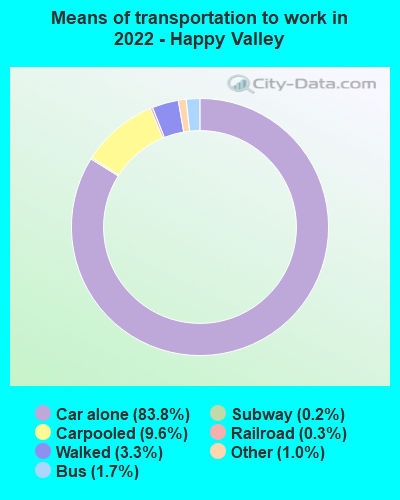
Means of transportation to work:
- Drove a car alone: 3,970 (52.6%)
- Carpooled: 442 (5.9%)
- Bus: 90 (1.2%)
- Long-distance train or commuter rail: 10 (0.1%)
- Light rail, streetcar or trolley: 33 (0.4%)
- Taxi: 44 (0.6%)
- Walked: 199 (2.6%)
- Worked at home: 3,128 (41.5%)
- Unemployment by race in 2022
- Unemployment rate for White non-Hispanic residents
- 2.9%Males
- 2.4%Females
- Unemployment rate for Black residents
- 11.8%Males
- Unemployment rate for Asian residents
- 6.1%Males
- 2.5%Females
- Unemployment rate for Hispanic or Latino residents
- 2.5%Males
- 2.1%Females
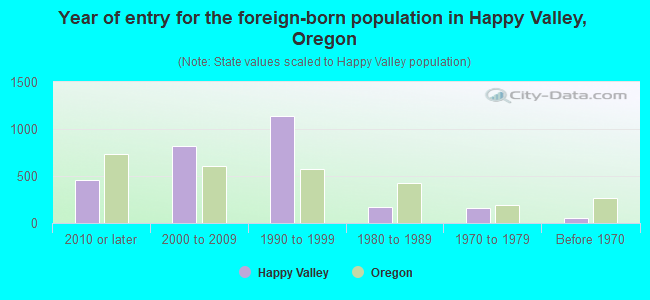
- Year of entry for the foreign-born population in Happy Valley, Oregon
- 4532010 or later
- 8192000 to 2009
- 1,1421990 to 1999
- 1731980 to 1989
- 1601970 to 1979
- 51Before 1970
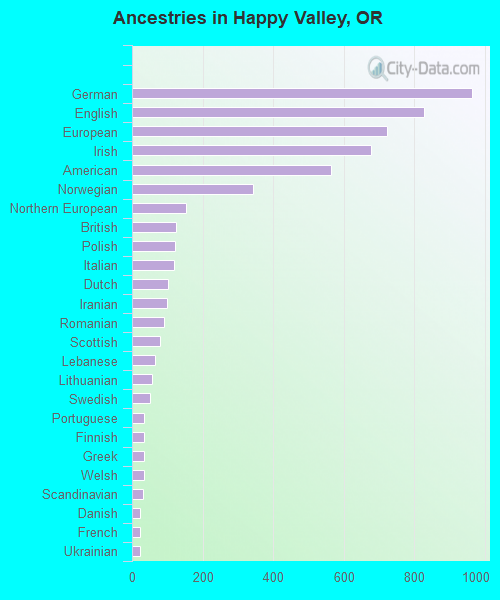
First ancestries reported:
- German: 963 (9.6%)
- English: 827 (8.2%)
- European: 721 (7.2%)
- Irish: 676 (6.7%)
- American: 563 (5.6%)
- Norwegian: 344 (3.4%)
- Northern European: 154 (1.5%)
- British: 125 (1.2%)
- Polish: 121 (1.2%)
- Italian: 118 (1.2%)
- Dutch: 101 (1.0%)
- Iranian: 98 (1.0%)
- Romanian: 92 (0.9%)
- Scottish: 79 (0.8%)
- Lebanese: 66 (0.7%)
- Lithuanian: 58 (0.6%)
- Swedish: 50 (0.5%)
- Portuguese: 35 (0.3%)
- Finnish: 33 (0.3%)
- Greek: 33 (0.3%)
- Welsh: 33 (0.3%)
- Scandinavian: 32 (0.3%)
- Danish: 24 (0.2%)
- French: 24 (0.2%)
- Ukrainian: 23 (0.2%)
- Croatian: 22 (0.2%)
- Scotch-Irish: 21 (0.2%)
- Slovene: 19 (0.2%)
- Swiss: 19 (0.2%)
- Syrian: 14 (0.1%)
- Canadian: 14 (0.1%)
- Czech: 10 (0.10%)
- Russian: 10 (0.10%)
- Iraqi: 8 (0.08%)
- Kenyan: 6 (0.06%)
- African: 5 (0.05%)
Most common places of birth for foreign-born residents (%):
| Happy Valley: | 16.9% (656) |
| Oregon: | 5.5% (22,563) |
| Happy Valley: | 14.2% (551) |
| Oregon: | 5.2% (21,429) |
| Happy Valley: | 8.2% (317) |
| Oregon: | 2.8% (11,450) |
| Happy Valley: | 5.5% (214) |
| Oregon: | 3.5% (14,530) |
| Happy Valley: | 4.9% (192) |
| Oregon: | 0.8% (3,218) |
| Happy Valley: | 4.9% (190) |
| Oregon: | 0.4% (1,765) |
| Happy Valley: | 4.8% (188) |
| Oregon: | 0.6% (2,667) |
| Happy Valley: | 4.1% (159) |
| Oregon: | 2.1% (8,469) |
| Happy Valley: | 3.7% (144) |
| Oregon: | 33.9% (140,109) |
| Happy Valley: | 3.6% (138) |
| Oregon: | 0.8% (3,319) |
| Happy Valley: | 3.1% (121) |
| Oregon: | 1.5% (6,259) |
| Happy Valley: | 2.7% (104) |
| Oregon: | 1.2% (5,082) |
| Happy Valley: | 2.3% (90) |
| Oregon: | 4.7% (19,604) |
| Happy Valley: | 1.8% (70) |
| Oregon: | 1.0% (4,122) |
| Happy Valley: | 1.6% (61) |
| Oregon: | 0.2% (685) |
Place of birth for U.S.-born residents:
- This state: 11,864
- Other state: 8,571
- Northeast: 578
- Midwest: 1,715
- South: 743
- West: 5,562
88.4% of Happy Valley residents lived in the same house 1 years ago.
Out of people who lived in different houses, 22.7% lived in this county.
Out of people who lived in different counties, 78.5% lived in Oregon.
| Happy Valley: | 88.4% |
| State average: | 85.5% |
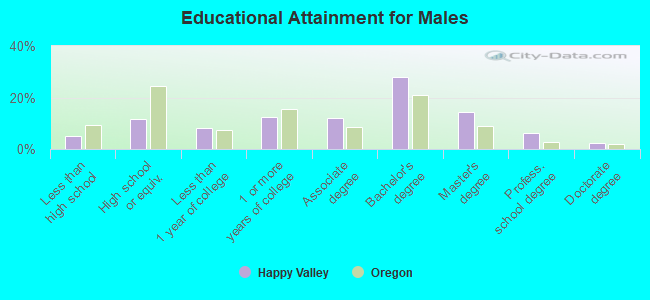
Education attainment for males 25 years and older:
- No schooling: 81
- Nursery to 4th grade: 1
- 5th and 6th grade: 0
- 7th and 8th grade: 36
- 9th grade: 20
- 10th grade: 21
- 11th grade: 53
- 12th grade, no diploma: 209
- High school graduate (or equivalency): 933
- Less than 1 year of college: 651
- Some college more than 1 year, no degree: 992
- Associate degree: 986
- Bachelor's degree: 2,247
- Master's degree: 1,156
- Professional school degree: 507
- Doctorate degree: 189
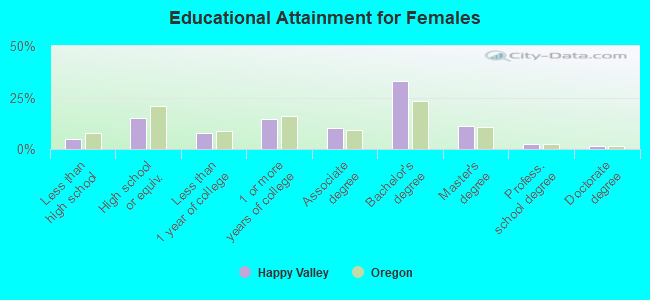
Education attainment for females 25 years and older:
- No schooling: 194
- Nursery to 4th grade: 0
- 5th and 6th grade: 8
- 7th and 8th grade: 10
- 9th grade: 0
- 10th grade: 23
- 11th grade: 39
- 12th grade, no diploma: 108
- High school graduate (or equivalency): 1,212
- Less than 1 year of college: 616
- Some college more than 1 year, no degree: 1,184
- Associate degree: 813
- Bachelor's degree: 2,688
- Master's degree: 892
- Professional school degree: 187
- Doctorate degree: 118


Housing units in structures:
- One, detached: 6,397
- One, attached: 947
- 3 or 4: 185
- 5 to 9: 286
- 10 to 19: 213
- 20 to 49: 123
- 50 or more: 372
- Mobile homes: 63
Median worth of mobile homes: $26,801
Housing units lacking complete kitchen facilities in 2022: 1.6%
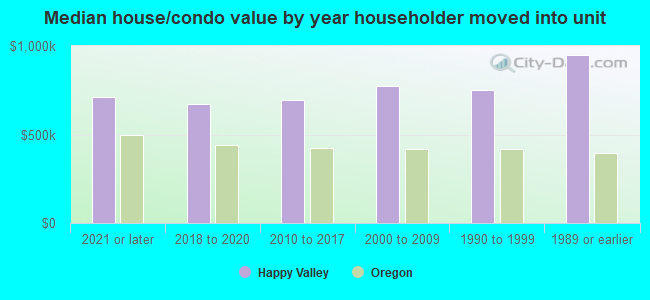
House/condo owner moved in on average 8 years ago
Renter moved in on average 0 years ago
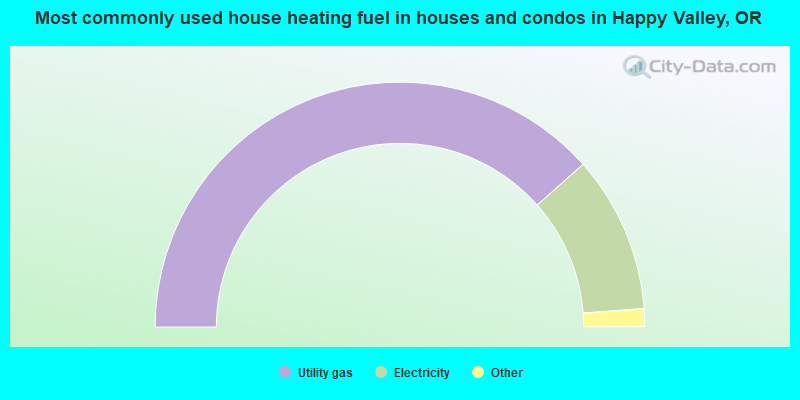
- 76.9%Utility gas
- 20.7%Electricity
- 1.3%Bottled, tank, or LP gas
- 0.6%Wood
- 0.3%Fuel oil, kerosene, etc.
- 0.2%No fuel used
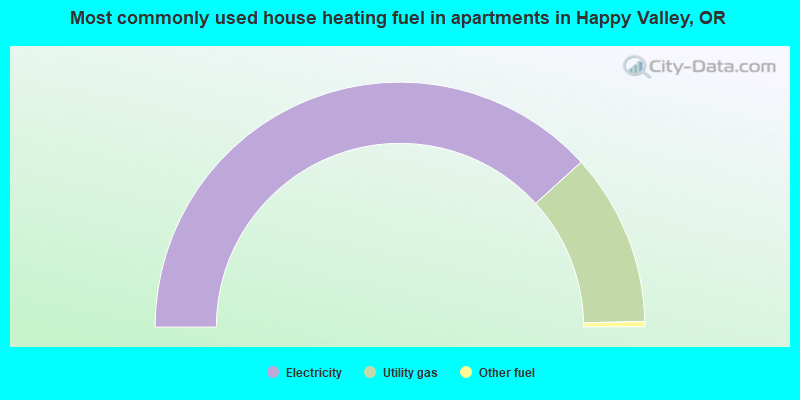
- 76.5%Electricity
- 22.8%Utility gas
- 0.7%Other fuel
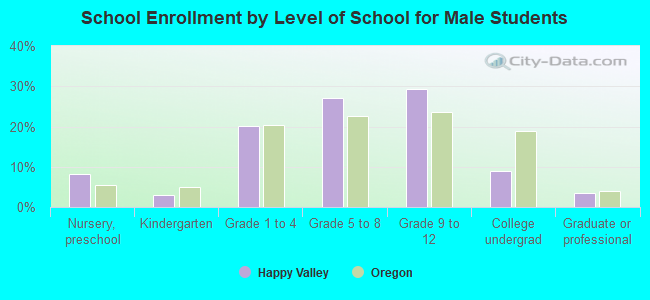
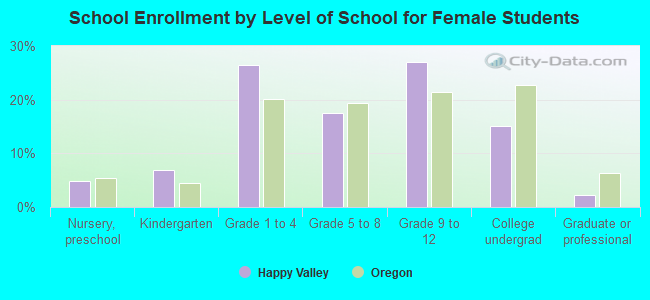
Private vs. public school enrollment:
| Here: | 16.6% |
| Oregon: | 13.7% |
| Here: | 26.1% |
| Oregon: | 8.8% |
| Here: | 43.2% |
| Oregon: | 17.7% |