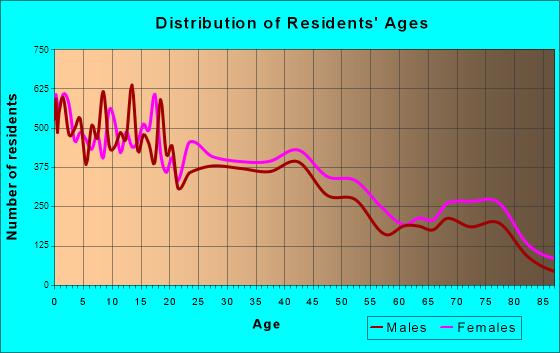
Harlingen, TX (Texas) Houses and Residents
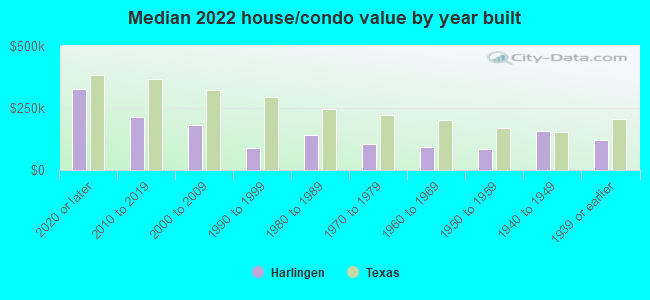
| Harlingen: | $123,400 |
| Texas: | $275,400 |
Mean price in 2022:
Detached houses: $195,613
Here: $195,613 State: $369,058 Townhouses or other attached units: $203,748
Here: $203,748 State: $327,631 In 2-unit structures: $127,793
Here: $127,793 State: $374,947 In 3-to-4-unit structures: $170,933
Here: $170,933 State: $209,652 In 5-or-more-unit structures: $77,969
Here: $77,969 State: $413,944 Mobile homes: $96,978
Here: $96,978 State: $124,413 Occupied boats, RVs, vans, etc.: $35,320
Here: $35,320 State: $73,921
Total population: 65,914 (Urban population: 57,205, Rural population: 419 (all nonfarm))
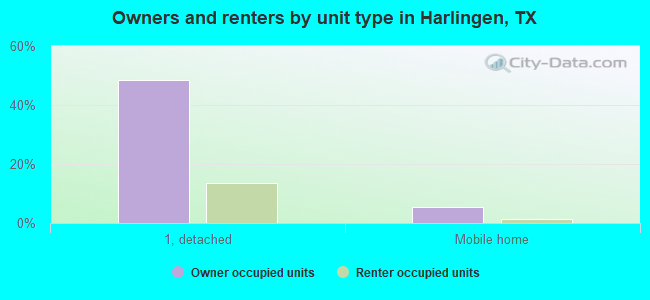
Houses: 32,817 (28,891 occupied: 15,694 owner occupied, 13,197 renter occupied)
| % of renters here: | 46% |
| State: | 38% |
Housing density: 963 houses/condos per square mile
Median price asked for vacant for-sale houses and condos in 2022: $125,604.
Median contract rent in 2022: $724 (lower quartile is $509, upper quartile is $956)
Median rent asked for vacant for-rent units in 2022: $574
Median gross rent in Harlingen, TX in 2022: $868
Housing units in Harlingen with a mortgage: 6,679 (169 second mortgage, 0 home equity loan, 89 both second mortgage and home equity loan)
Houses without a mortgage: 62
Median household income for houses/condos with a mortgage: $72,394
Median household income for apartments without a mortgage: $51,376
Median monthly housing costs: $800
Compare current foreclosures in Harlingen, TX:
| Photo | Address | Area | Beds / Baths | Price | Details |
|---|---|---|---|---|---|

|
#1
E Hurst St
Harlingen, TX 78550
|
924 sq. feet
|
1 baths 2 beds |
show details | |

|
#2
E Leggett Rd
Harlingen, TX 78550
|
1,747 sq. feet
|
3 baths 4 beds |
show details | |

|
#3
N Rose St
Harlingen, TX 78550
|
1,730 sq. feet
|
2 baths 3 beds |
show details | |

|
#4
Scarlett Cir
Harlingen, TX 78552
|
3,326 sq. feet
|
4 baths 4 beds |
show details | |

|
#5
Sun Dr
Harlingen, TX 78552
|
1,196 sq. feet
|
2 baths 3 beds |
show details | |

|
#6
Beckham Rd
Harlingen, TX 78552
|
2,661 sq. feet
|
2 baths 3 beds |
show details | |

|
#7
E Madison Ave
Harlingen, TX 78550
|
1,656 sq. feet
|
2 baths 3 beds |
show details | |

|
#8
Fm 508
Harlingen, TX 78550
|
1,844 sq. feet
|
2 baths 4 beds |
show details | |

|
#9
E Pierce Ave
Harlingen, TX 78550
|
900 sq. feet
|
1 baths 3 beds |
show details | |

|
#10
Sun Crest Dr
Harlingen, TX 78552
|
1,835 sq. feet
|
2 baths 3 beds |
show details |
| Photo | Address | Area | Beds / Baths | Price | Details |
|---|---|---|---|---|---|

|
#11
Lazy Lake Dr
Harlingen, TX 78550
|
3,254 sq. feet
|
2 baths 3 beds |
show details | |

|
#12
Lazy Palm Dr S
Harlingen, TX 78552
|
1,072 sq. feet
|
2 baths 3 beds |
show details | |

|
#13
Vista Verde Cir W
Harlingen, TX 78552
|
1,197 sq. feet
|
2 baths 3 beds |
show details | |

|
#14
N 27th St
Harlingen, TX 78550
|
1,203 sq. feet
|
2 baths 3 beds |
show details | |

|
#15
Hitching Post Blvd
Harlingen, TX 78552
|
2,530 sq. feet
|
- baths 4 beds |
show details | |

|
#16
N A St
Harlingen, TX 78550
|
1,160 sq. feet
|
1 baths - beds |
show details | |

|
#17
Palm Valley Dr E
Harlingen, TX 78552
|
2,554 sq. feet
|
- baths 4 beds |
show details | |

|
#18
N Rose St
Harlingen, TX 78550
|
1,680 sq. feet
|
2 baths - beds |
show details | |

|
#19
Scenic Ln
Harlingen, TX 78552
|
1,308 sq. feet
|
- baths 4 beds |
show details | |

|
#20
Bass Blvd
Harlingen, TX 78552
|
3,719 sq. feet
|
- baths 5 beds |
show details |
| Photo | Address | Area | Beds / Baths | Price | Details |
|---|---|---|---|---|---|

|
#21
Tamm Ln
Harlingen, TX 78552
|
- sq. feet
|
- baths - beds |
show details | |

|
#22
Rio Grande Cir
Harlingen, TX 78552
|
1,798 sq. feet
|
- baths - beds |
show details | |

|
#23
Thieme Rd
Harlingen, TX 78552
|
1,300 sq. feet
|
- baths - beds |
show details | |

|
#24
Bowie Ave
Harlingen, TX 78552
|
- sq. feet
|
- baths - beds |
show details | |

|
#25
E Monroe Ave
Harlingen, TX 78550
|
928 sq. feet
|
- baths - beds |
show details | |

|
#26
S Dakota St
Harlingen, TX 78552
|
896 sq. feet
|
- baths - beds |
show details | |

|
#27
W Lincoln Ave
Harlingen, TX 78550
|
1,271 sq. feet
|
- baths - beds |
show details | |

|
#28
E Washington Ave
Harlingen, TX 78550
|
1,448 sq. feet
|
- baths - beds |
show details | |

|
#29
N 1st St
Harlingen, TX 78550
|
1,622 sq. feet
|
- baths - beds |
show details | |

|
#30
N T St
Harlingen, TX 78550
|
1,039 sq. feet
|
- baths - beds |
show details |
| Photo | Address | Area | Beds / Baths | Price | Details |
|---|---|---|---|---|---|

|
#31
Vista Verde Cir W
Harlingen, TX 78552
|
- sq. feet
|
- baths - beds |
show details | |

|
#32
N 7th St # 475
Harlingen, TX 78550
|
- sq. feet
|
- baths - beds |
show details | |

|
#33
E Jackson St
Harlingen, TX 78550
|
1,440 sq. feet
|
- baths - beds |
show details | |

|
#34
S Dakota St
Harlingen, TX 78552
|
1,084 sq. feet
|
- baths - beds |
show details | |

|
#35
Fairway
Harlingen, TX 78552
|
- sq. feet
|
- baths - beds |
show details | |

|
#36
Gonzalez Rd
Harlingen, TX 78550
|
550 sq. feet
|
- baths - beds |
show details | |

|
#37
Cook Ln
Harlingen, TX 78552
|
4,743 sq. feet
|
- baths - beds |
show details | |

|
#38
Calle Condesa
Harlingen, TX 78552
|
- sq. feet
|
- baths - beds |
show details | |

|
#39
Montana Dr
Harlingen, TX 78552
|
1,083 sq. feet
|
- baths - beds |
show details | |

|
#40
Fountain View Ct
Harlingen, TX 78550
|
- sq. feet
|
- baths - beds |
show details |
| Photo | Address | Area | Beds / Baths | Price | Details |
|---|---|---|---|---|---|

|
#41
Wilson Rd Unit 61
Harlingen, TX 78552
|
- sq. feet
|
- baths - beds |
show details | |

|
#42
Haine Dr Apt 2605
Harlingen, TX 78550
|
- sq. feet
|
- baths - beds |
show details | |

|
#43
Venado
Harlingen, TX 78552
|
- sq. feet
|
- baths - beds |
show details | |

|
#44
W Linda St
Harlingen, TX 78550
|
- sq. feet
|
- baths - beds |
show details | |

|
#45
Jordan St
Harlingen, TX 78552
|
- sq. feet
|
- baths - beds |
show details | |

|
#46
N 77 Sunshine Strip, Pmb 146
Harlingen, TX 78550
|
- sq. feet
|
- baths - beds |
show details | |

|
#47
S Palm Court Dr
Harlingen, TX 78552
|
2,056 sq. feet
|
- baths - beds |
show details | |

|
#48
Marchita Ave
Harlingen, TX 78550
|
864 sq. feet
|
- baths - beds |
show details | |

|
#49
E Austin Ave
Harlingen, TX 78550
|
2,758 sq. feet
|
- baths - beds |
show details | |

|
Check over 1 million property listings on Foreclosure.com!
|
browse all offers | |||

Latest news about housing in Harlingen, TX collected exclusively by city-data.com from local newspapers, TV, and radio stations

 | Why are houses in Houston so inexpensive? (83 replies) |
| Cheapest new/newer houses with fiber internet in Texas? (11 replies) |
| Trying to find a reason to stay in Texas (186 replies) |
| good apartments near Harlingen VA Health Care Center (0 replies) |
| Harlingen and Corpus comparisons, nobody knows? (7 replies) |
| What's Up with the Property Taxes? (179 replies) |
Median year apartment built: 1993
Household type by relationship:
Households: 71,669- Male householders: 13,976 (2,808 living alone), Female householders: 14,915 (5,701 living alone)
11,146 spouses (11,106 opposite-sex spouses), 2,244 unmarried partners, (2,012 opposite-sex unmarried partners), 20,680 children (18,895 natural, 600 adopted, 1,185 stepchildren), 3,181 grandchildren, 1,555 brothers or sisters, 1,116 parents, 0 foster children, 1,019 other relatives, 1,041 non-relatives
- In group quarters: 796
Size of family households: 9,158 2-persons, 3,746 3-persons, 3,771 4-persons, 1,260 5-persons, 558 6-persons, 259 7-or-more-persons.
Size of nonfamily households: 8,509 1-person, 1,374 2-persons, 256 3-persons.
6,423 married couples with children.
7,820 single-parent households (1,212 men, 6,608 women).
52.0% of residents of Harlingen speak English at home.
47.5% of residents speak Spanish at home (68% speak English very well, 12% speak English well, 9% speak English not well, 11% don't speak English at all).
0.4% of residents speak other Indo-European language at home (98% speak English very well, 2% speak English well).
0.6% of residents speak Asian or Pacific Island language at home (69% speak English very well, 15% speak English well, 16% speak English not well).
0.1% of residents speak other language at home (100% speak English very well).
Foreign born population: 9,584 (13.4%)
(58.4% of them are naturalized citizens)
| Here: | 5.4 |
| State: | 6.3 |
| Here: | 3.4 |
| State: | 4.0 |
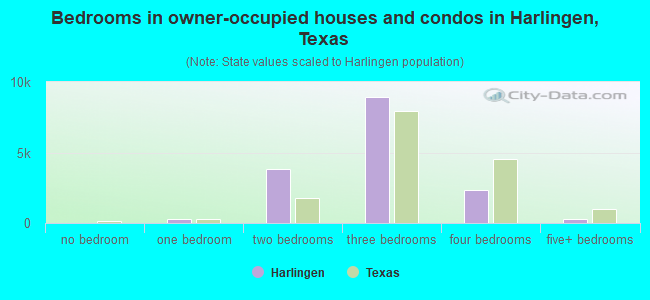
- Bedrooms in owner-occupied houses and condos in Harlingen, Texas
- 0no bedroom
- 2891 bedroom
- 3,8642 bedrooms
- 8,9073 bedrooms
- 2,3454 bedrooms
- 2895+ bedrooms
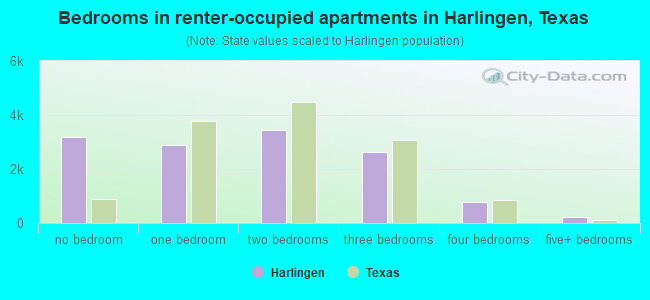
- Bedrooms in renter-occupied apartments in Harlingen, Texas
- 3,202no bedroom
- 2,9051 bedroom
- 3,4512 bedrooms
- 2,6463 bedrooms
- 7824 bedrooms
- 2115+ bedrooms
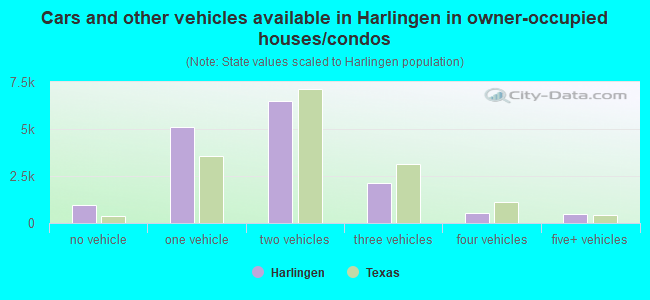
- Cars and other vehicles available in Harlingen in owner-occupied houses/condos
- 961no vehicle
- 5,1261 vehicle
- 6,4892 vehicles
- 2,1163 vehicles
- 5454 vehicles
- 4575+ vehicles
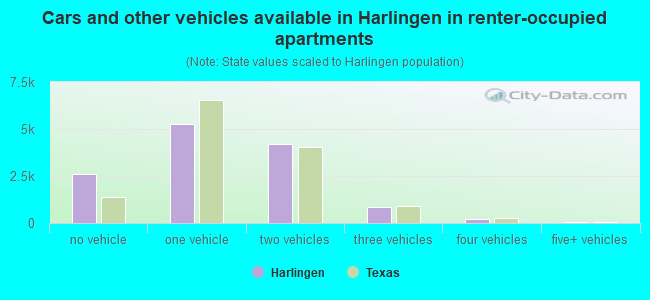
- Cars and other vehicles available in Harlingen in renter-occupied apartments
- 2,615no vehicle
- 5,2841 vehicle
- 4,2052 vehicles
- 8493 vehicles
- 1904 vehicles
- 545+ vehicles
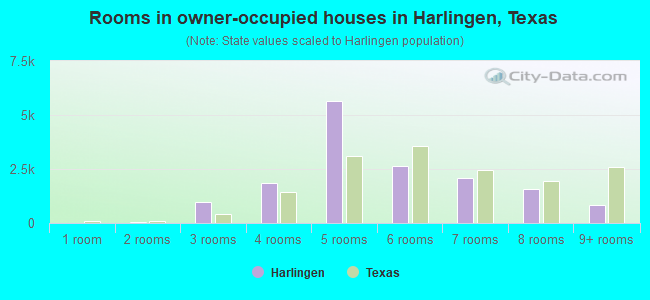
- Rooms in owner-occupied houses in Harlingen, Texas
- 01 room
- 582 rooms
- 9553 rooms
- 1,8704 rooms
- 5,6545 rooms
- 2,6276 rooms
- 2,1017 rooms
- 1,5938 rooms
- 8369+ rooms
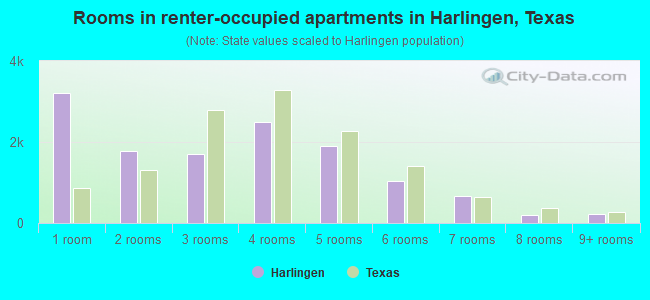
- Rooms in renter-occupied apartments in Harlingen, Texas
- 3,2021 room
- 1,7842 rooms
- 1,7073 rooms
- 2,4904 rooms
- 1,8955 rooms
- 1,0486 rooms
- 6637 rooms
- 1978 rooms
- 2119+ rooms
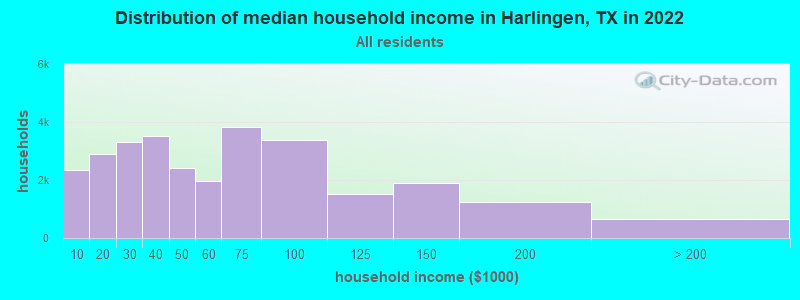
Harlingen, TX household income distribution

- 2,329Less than $10,000
- 2,884$10,000 to $19,999
- 3,301$20,000 to $29,999
- 3,508$30,000 to $39,999
- 2,399$40,000 to $49,999
- 1,979$50,000 to $59,999
- 3,824$60,000 to $74,999
- 3,377$75,000 to $99,999
- 1,511$100,000 to $124,999
- 1,882$125,000 to $149,999
- 1,225$150,000 to $199,999
- 672$200,000 or more
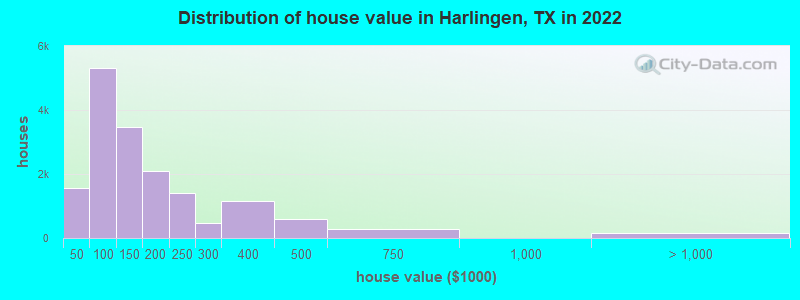
Home value of owner - occupied houses in 2022 in Harlingen, TX
-
- 321Less than $10,000
- 34$10,000 to $14,999
- 115$20,000 to $24,999
- 176$25,000 to $29,999
- 101$30,000 to $34,999
- 824$40,000 to $49,999
- 615$50,000 to $59,999
- 800$60,000 to $69,999
- 820$70,000 to $79,999
- 1,726$80,000 to $89,999
- 514$90,000 to $99,999
- 1,928$100,000 to $124,999
- 1,538$125,000 to $149,999
- 950$150,000 to $174,999
- 1,151$175,000 to $199,999
- 1,407$200,000 to $249,999
- 467$250,000 to $299,999
- 1,148$300,000 to $399,999
- 601$400,000 to $499,999
- 294$500,000 to $749,999
- 17$1,000,000 to $1,499,999
- 147$2,000,000 or more
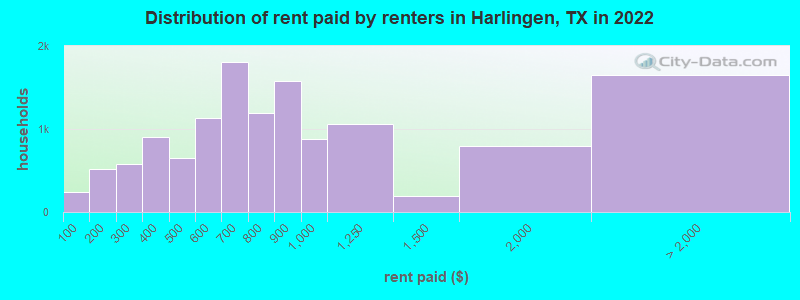
Rent paid by renters in 2022 in Harlingen, TX
-
- 240Less than $100
- 271$100 to $149
- 253$150 to $199
- 110$200 to $249
- 465$250 to $299
- 400$300 to $349
- 507$350 to $399
- 299$400 to $449
- 349$450 to $499
- 744$500 to $549
- 392$550 to $599
- 512$600 to $649
- 1,297$650 to $699
- 482$700 to $749
- 715$750 to $799
- 1,580$800 to $899
- 876$900 to $999
- 1,061$1,000 to $1,249
- 192$1,250 to $1,499
- 798$1,500 to $1,999
- 36$2,500 to $2,999
- 558$3,500 or more
- 1,060No cash rent
Percentage of workers working in this county: 86.7%
Number of people working at home: 2,642 (8.8% of all workers)
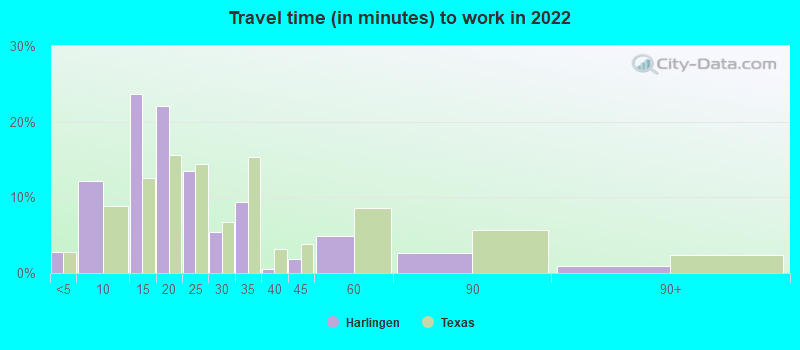
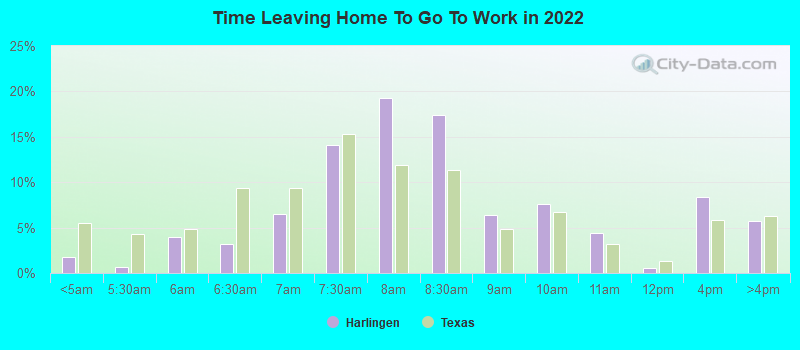
Travel time to work (commute)
- Less than 5 minutes: 1,175
- 5 to 9 minutes: 5,262
- 10 to 14 minutes: 6,702
- 15 to 19 minutes: 4,290
- 20 to 24 minutes: 3,392
- 25 to 29 minutes: 893
- 30 to 34 minutes: 1,571
- 35 to 39 minutes: 92
- 40 to 44 minutes: 1,216
- 45 to 59 minutes: 1,014
- 60 to 89 minutes: 427
- 90 or more minutes: 72
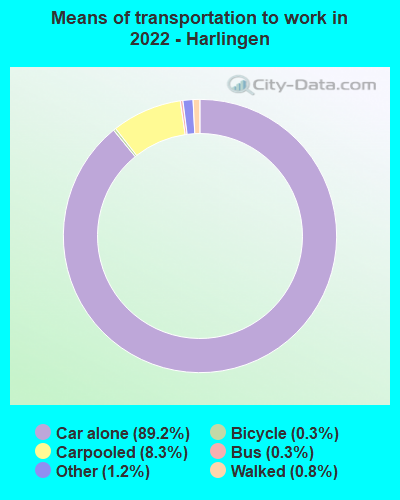
Means of transportation to work:
- Drove a car alone: 35,878 (80.4%)
- Carpooled: 4,487 (10.1%)
- Bus: 141 (0.3%)
- Taxi: 528 (1.2%)
- Bicycle: 188 (0.4%)
- Walked: 310 (0.7%)
- Worked at home: 2,642 (5.9%)
- Unemployment by race in 2022
- Unemployment rate for White non-Hispanic residents
- 1.8%Males
- Unemployment rate for other race residents
- 1.1%Males
- 1.3%Females
- Unemployment rate for two or more race residents
- 9.7%Males
- 5.3%Females
- Unemployment rate for Hispanic or Latino residents
- 5.1%Males
- 3.5%Females
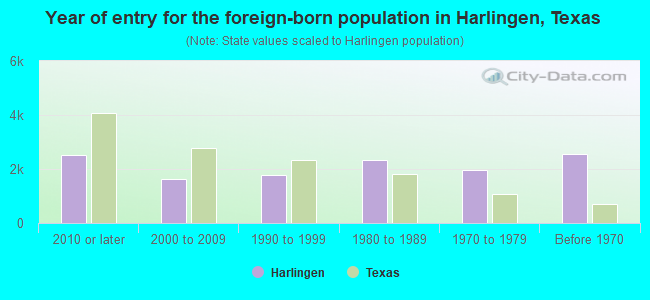
- Year of entry for the foreign-born population in Harlingen, Texas
- 2,5212010 or later
- 1,6292000 to 2009
- 1,7911990 to 1999
- 2,3351980 to 1989
- 1,9591970 to 1979
- 2,573Before 1970
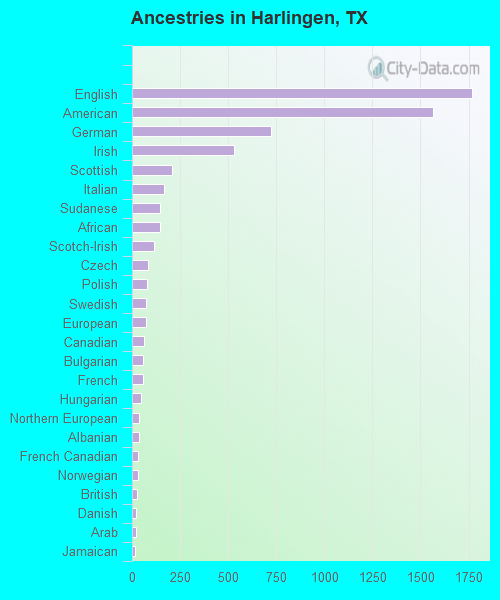
First ancestries reported:
- English: 1,768 (3.3%)
- American: 1,565 (2.9%)
- German: 721 (1.4%)
- Irish: 532 (1.0%)
- Scottish: 209 (0.4%)
- Italian: 169 (0.3%)
- Sudanese: 146 (0.3%)
- African: 145 (0.3%)
- Scotch-Irish: 117 (0.2%)
- Czech: 81 (0.2%)
- Polish: 77 (0.1%)
- Swedish: 75 (0.1%)
- European: 73 (0.1%)
- Canadian: 65 (0.1%)
- Bulgarian: 58 (0.1%)
- French: 57 (0.1%)
- Hungarian: 49 (0.09%)
- Northern European: 39 (0.07%)
- Albanian: 34 (0.06%)
- French Canadian: 31 (0.06%)
- Norwegian: 30 (0.06%)
- British: 27 (0.05%)
- Danish: 21 (0.04%)
- Arab: 19 (0.04%)
- Jamaican: 17 (0.03%)
- Eastern European: 16 (0.03%)
- Syrian: 15 (0.03%)
- Basque: 10 (0.02%)
- Iranian: 10 (0.02%)
- Welsh: 10 (0.02%)
- Dutch: 3 (0.01%)
Most common places of birth for foreign-born residents (%):
| Harlingen: | 73.0% (7,593) |
| Texas: | 48.4% (2,411,723) |
| Harlingen: | 4.9% (513) |
| Texas: | 1.8% (87,382) |
| Harlingen: | 3.1% (322) |
| Texas: | 4.5% (224,455) |
| Harlingen: | 2.4% (247) |
| Texas: | 3.0% (147,182) |
| Harlingen: | 1.8% (187) |
| Texas: | 6.1% (306,347) |
| Harlingen: | 1.8% (183) |
| Texas: | 2.1% (103,148) |
| Harlingen: | 1.6% (166) |
| Texas: | 1.1% (55,371) |
Place of birth for U.S.-born residents:
- This state: 50,065
- Other state: 10,765
- Northeast: 422
- Midwest: 4,334
- South: 3,051
- West: 2,958
91.2% of Harlingen residents lived in the same house 1 years ago.
Out of people who lived in different houses, 37.1% lived in this county.
Out of people who lived in different counties, 76.6% lived in Texas.
| Harlingen: | 91.2% |
| State average: | 85.7% |
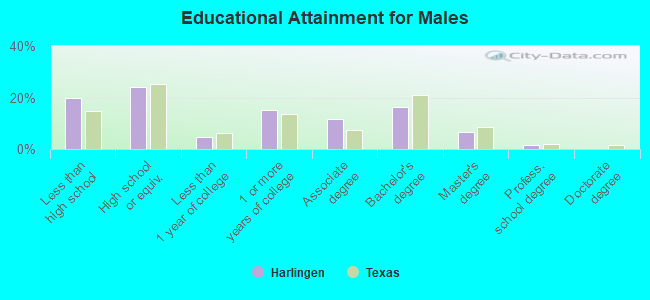
Education attainment for males 25 years and older:
- No schooling: 1,377
- Nursery to 4th grade: 424
- 5th and 6th grade: 396
- 7th and 8th grade: 402
- 9th grade: 429
- 10th grade: 1,051
- 11th grade: 241
- 12th grade, no diploma: 381
- High school graduate (or equivalency): 5,696
- Less than 1 year of college: 1,116
- Some college more than 1 year, no degree: 3,649
- Associate degree: 2,790
- Bachelor's degree: 3,891
- Master's degree: 1,581
- Professional school degree: 361
- Doctorate degree: 27
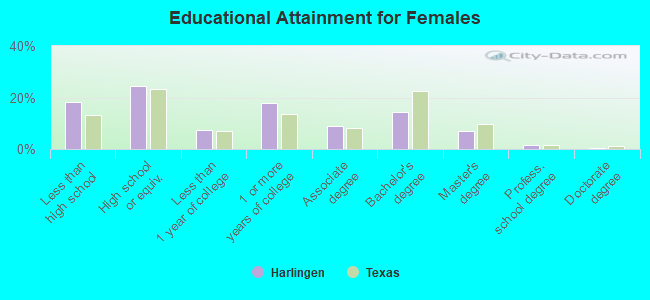
Education attainment for females 25 years and older:
- No schooling: 756
- Nursery to 4th grade: 590
- 5th and 6th grade: 485
- 7th and 8th grade: 618
- 9th grade: 354
- 10th grade: 1,114
- 11th grade: 428
- 12th grade, no diploma: 354
- High school graduate (or equivalency): 6,206
- Less than 1 year of college: 1,892
- Some college more than 1 year, no degree: 4,539
- Associate degree: 2,289
- Bachelor's degree: 3,622
- Master's degree: 1,787
- Professional school degree: 395
- Doctorate degree: 123
Housing units in structures:
- One, detached: 17,799
- One, attached: 1,304
- Two: 1,977
- 3 or 4: 1,942
- 5 to 9: 1,957
- 10 to 19: 2,493
- 20 to 49: 527
- 50 or more: 2,747
- Mobile homes: 2,071
Median worth of mobile homes: $40,800
Housing units lacking complete kitchen facilities in 2022: 3.8%
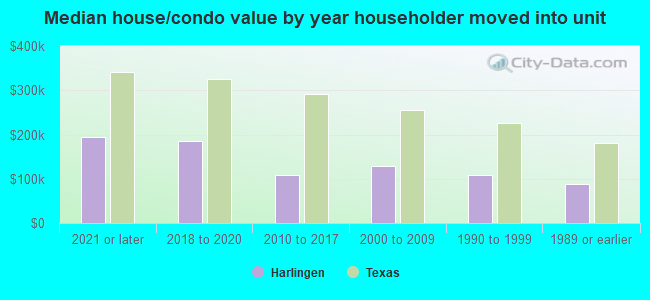
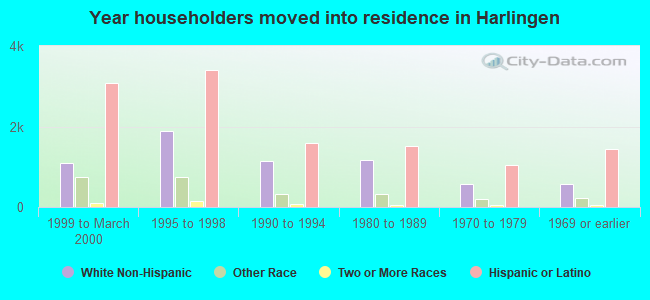
House/condo owner moved in on average 11 years ago
Renter moved in on average 2 years ago
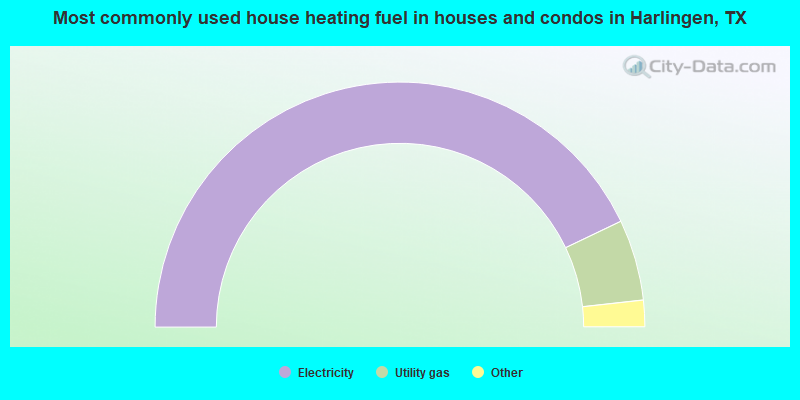
- 85.8%Electricity
- 10.7%Utility gas
- 2.4%Bottled, tank, or LP gas
- 0.7%No fuel used
- 0.2%Solar energy
- 0.1%Wood
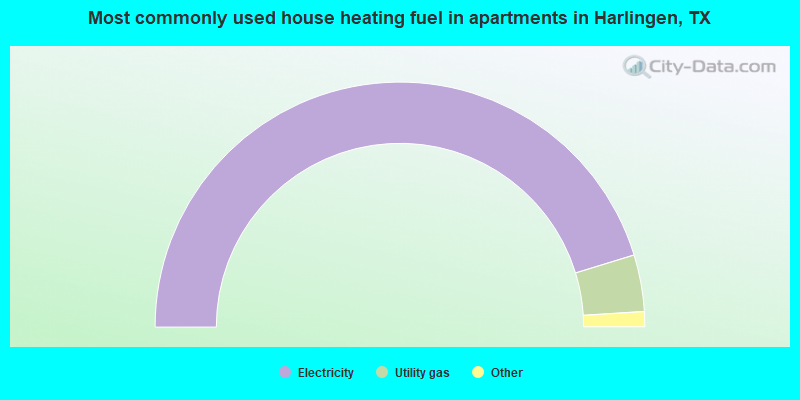
- 90.5%Electricity
- 7.5%Utility gas
- 1.0%No fuel used
- 0.4%Other fuel
- 0.4%Bottled, tank, or LP gas
- 0.1%Solar energy
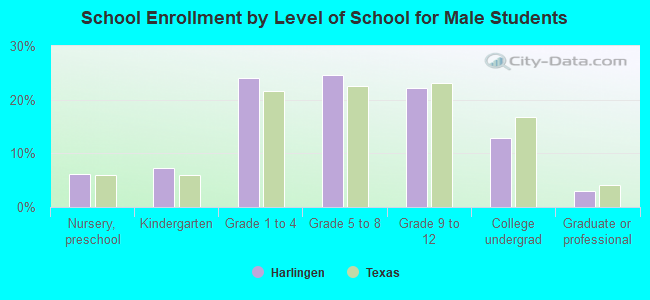
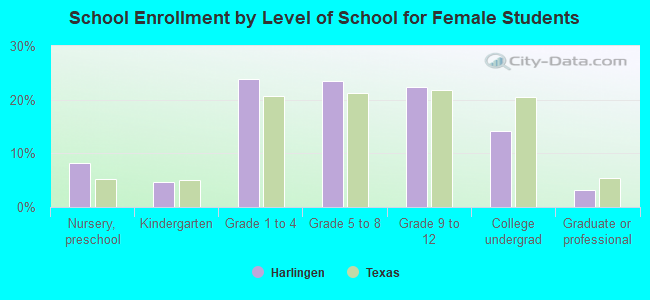
Private vs. public school enrollment:
| Here: | 4.1% |
| Texas: | 8.8% |
| Here: | 8.2% |
| Texas: | 8.0% |
| Here: | 3.8% |
| Texas: | 16.2% |