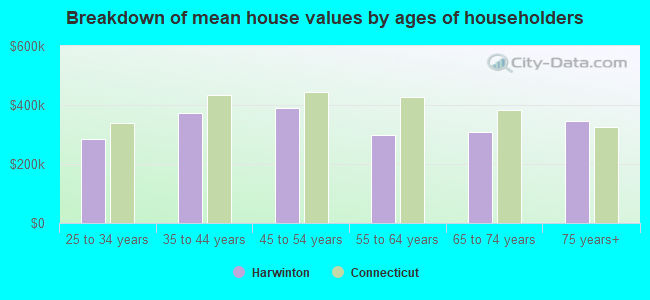
Median price asked for vacant for-sale houses and condos in 2022 in this county: $399,480.
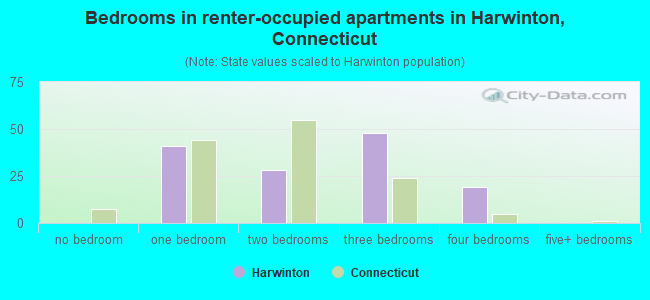
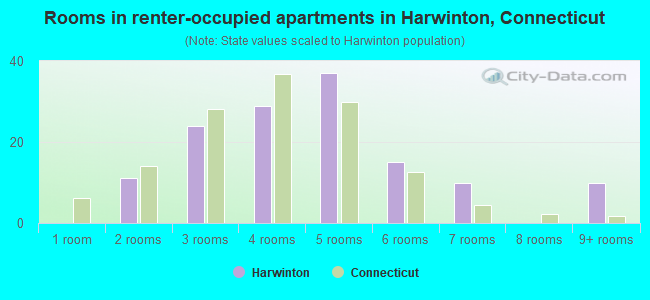
Median contract rent in 2022: $1,148 (lower quartile is $779, upper quartile is $1,611)
Median rent asked for vacant for-rent units in 2022: $1,000
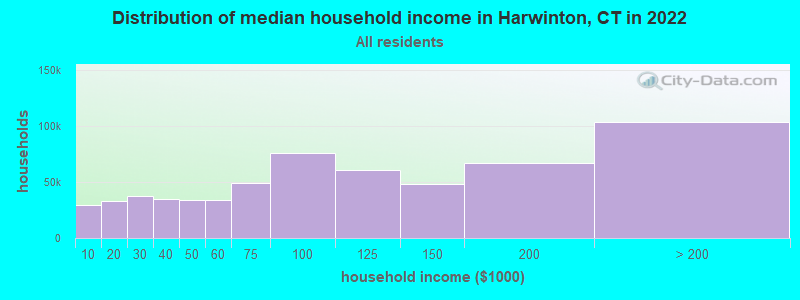
Median gross rent in Harwinton, CT in 2022: $1,463
Housing units in Harwinton with a mortgage: 1,114 (98 second mortgage, 131 home equity loan, 8 both second mortgage and home equity loan) Houses without a mortgage: 484
In family households: 156,490 (36,561 male householders, 14,969 female householders)
41,185 spouses, 52,814 children (49,404 natural, 1,325 adopted, 2,085 stepchildren), 2,365 grandchildren, 1,073 brothers or sisters, 1,650 parents, foster children, 1,216 other relatives, 3,500 non-relatives
In nonfamily households: 30,633 (11,692 male householders (9,019 living alone)), 13,418 female householders (11,384 living alone)), 5,523 nonrelatives
In group quarters: 2,804 (1,566 institutionalized population)
34,479 married couples with children.
7,472 single-parent households (1,895 men, 5,577 women).
93.7% of residents of Harwinton speak English at home.
2.2% of residents speak Spanish at home (68% speak English very well, 27% speak English well, 5% speak English not well).
3.4% of residents speak other Indo-European language at home (84% speak English very well, 14% speak English well, 3% speak English not well).
0.4% of residents speak Asian or Pacific Island language at home (71% speak English very well, 29% speak English well).
0.2% of residents speak other language at home (50% speak English very well, 50% speak English well).
Foreign born population: 301 (4.9%)
(86.7% of them are naturalized citizens)
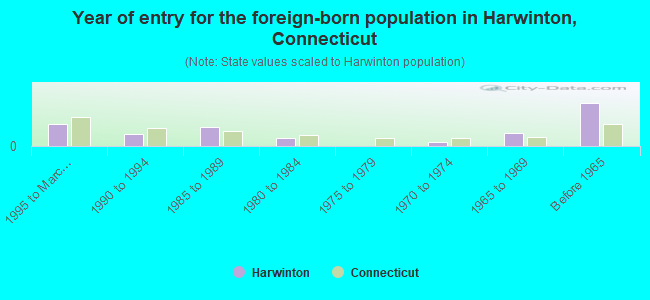
Year of entry for the foreign-born population in Harwinton, Connecticut
341995 to March 2000
181990 to 1994
291985 to 1989
131980 to 1984
01975 to 1979
61970 to 1974
201965 to 1969
66Before 1965
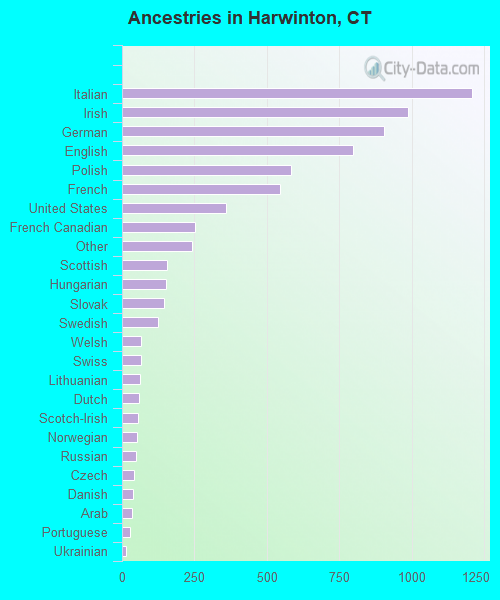
First ancestries reported:
Italian: 1,207 (17.2%)
Irish: 987 (14.0%)
German: 905 (12.9%)
English: 796 (11.3%)
Polish: 583 (8.3%)
French: 547 (7.8%)
United States: 360 (5.1%)
French Canadian: 251 (3.6%)
Other: 243 (3.5%)
Scottish: 155 (2.2%)
Hungarian: 153 (2.2%)
Slovak: 145 (2.1%)
Swedish: 126 (1.8%)
Welsh: 67 (1.0%)
Swiss: 66 (0.9%)
Lithuanian: 62 (0.9%)
Dutch: 58 (0.8%)
Scotch-Irish: 54 (0.8%)
Norwegian: 53 (0.8%)
Russian: 47 (0.7%)
Czech: 40 (0.6%)
Danish: 38 (0.5%)
Arab: 34 (0.5%)
Portuguese: 28 (0.4%)
Ukrainian: 14 (0.2%)
Greek: 6 (0.09%)
Subsaharan African: 5 (0.07%)
Most common places of birth for foreign-born residents (%):
United Kingdom
Harwinton:
28.5% (53)
Connecticut:
4.4% (16,395)
Italy
Harwinton:
19.4% (36)
Connecticut:
7.0% (26,023)
Korea
Harwinton:
8.1% (15)
Connecticut:
1.5% (5,508)
Germany
Harwinton:
7.5% (14)
Connecticut:
3.1% (11,432)
Colombia
Harwinton:
7.5% (14)
Connecticut:
3.2% (12,009)
Other Western Europe
Harwinton:
7.0% (13)
Connecticut:
0.5% (1,983)
Cuba
Harwinton:
5.9% (11)
Connecticut:
1.1% (3,919)
Guyana
Harwinton:
5.9% (11)
Connecticut:
0.8% (2,940)
Iran
Harwinton:
4.3% (8)
Connecticut:
0.4% (1,513)
Laos
Harwinton:
3.2% (6)
Connecticut:
0.7% (2,692)
Other Australian and New Zealand Subregion
Harwinton:
2.7% (5)
Connecticut:
0.1% (291)
Place of birth for U.S.-born residents:
This state: 3,998
Other state: 1,074
Northeast: 813
Midwest: 80
South: 122
West: 59
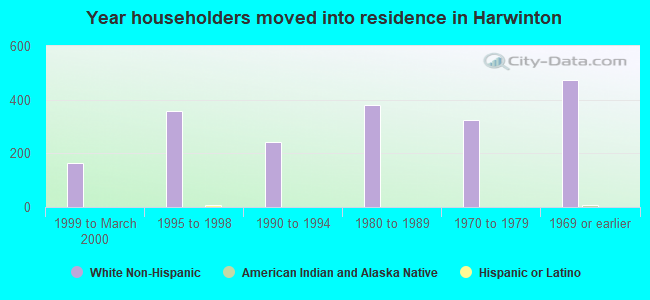
70% of Harwinton residents lived in the same house 5 years ago. Out of people who lived in different houses, 60% lived in this county. Out of people who lived in different counties, 79% lived in Connecticut.
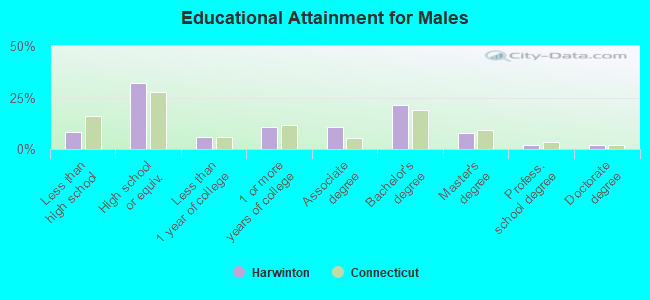
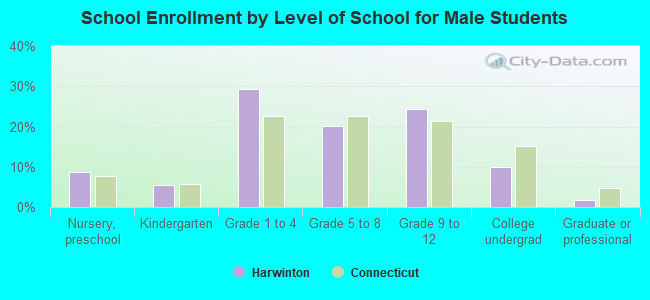
Education attainment for males 25 years and older:
No schooling: 0
Nursery to 4th grade: 0
5th and 6th grade: 6
7th and 8th grade: 26
9th grade: 25
10th grade: 38
11th grade: 7
12th grade, no diploma: 47
High school graduate (or equivalency): 580
Less than 1 year of college: 104
Some college more than 1 year, no degree: 191
Associate degree: 191
Bachelor's degree: 386
Master's degree: 138
Professional school degree: 36
Doctorate degree: 31
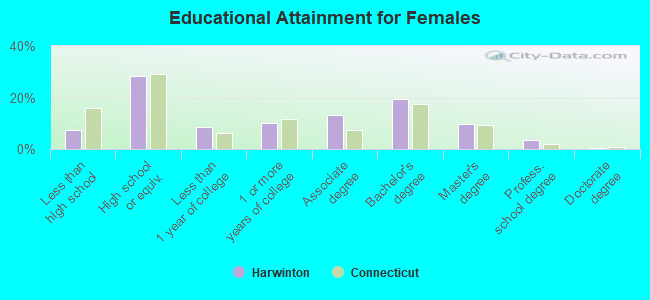
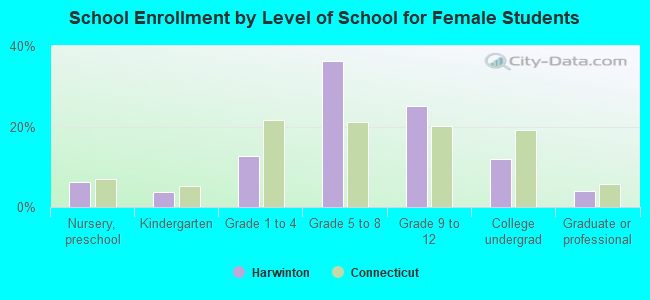
Education attainment for females 25 years and older:
No schooling: 0
Nursery to 4th grade: 0
5th and 6th grade: 6
7th and 8th grade: 11
9th grade: 39
10th grade: 31
11th grade: 21
12th grade, no diploma: 28
High school graduate (or equivalency): 529
Less than 1 year of college: 157
Some college more than 1 year, no degree: 186
Associate degree: 245
Bachelor's degree: 365
Master's degree: 184
Professional school degree: 63
Doctorate degree: 10
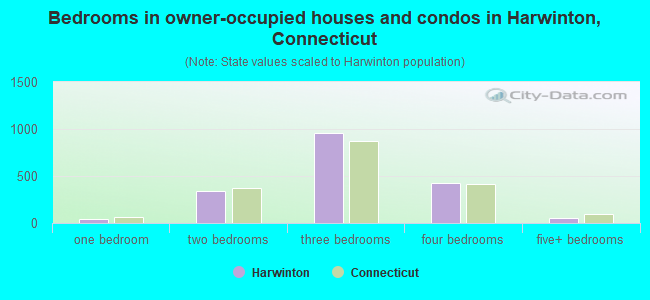
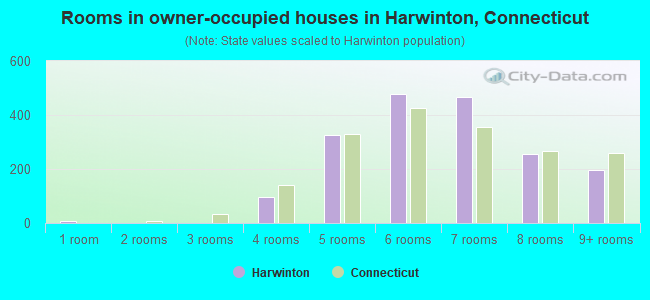
Housing units in structures:
One, detached: 1,911
One, attached: 28
Two: 31
3 or 4: 19
5 to 9: 6
10 to 19: 6
Mobile homes: 21
Median worth of mobile homes: $119,309
Housing units lacking complete plumbing facilities: 1.0%
Housing units lacking complete kitchen facilities: 0.7%