Hellertown, PA (Pennsylvania) Houses and Residents
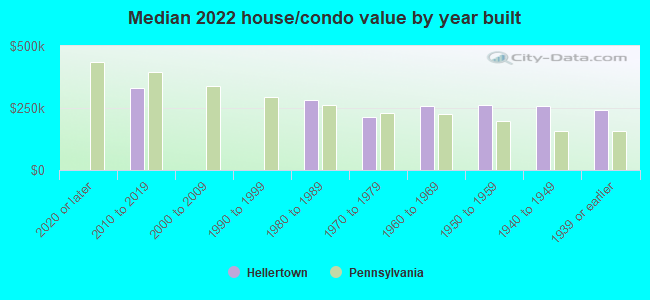
| Hellertown: | $244,207 |
| Pennsylvania: | $245,500 |
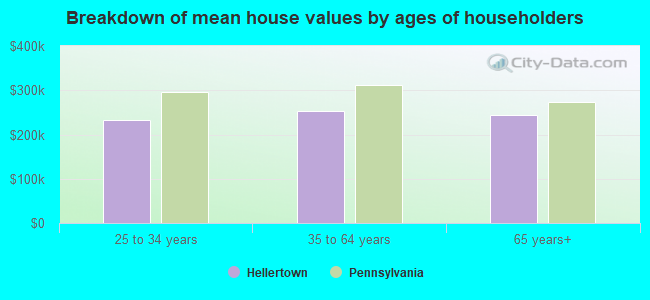
Mean price in 2022:
Detached houses: $281,913
Here: $281,913 State: $317,202 Townhouses or other attached units: $207,370
Here: $207,370 State: $254,369
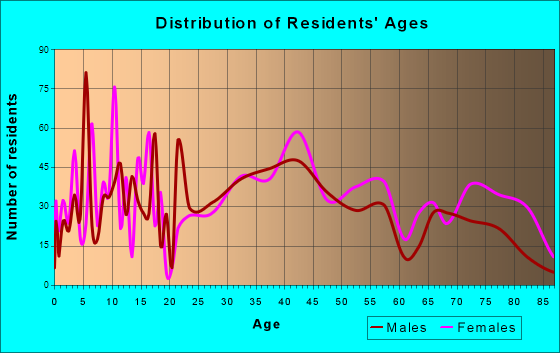
Total population: 5,858 (Urban population: 5,615, Rural population: 0)
Houses: 2,720 (2,581 occupied: 1,761 owner occupied, 809 renter occupied)
| % of renters here: | 31% |
| State: | 31% |
Housing density: 2,029 houses/condos per square mile
Median price asked for vacant for-sale houses and condos in 2022: $528,801.
Median contract rent in 2022: $1,071 (lower quartile is $774, upper quartile is $1,555)
Median rent asked for vacant for-rent units in 2022: $1,661
Median gross rent in Hellertown, PA in 2022: $1,247
Housing units in Hellertown with a mortgage: 1,200 (100 second mortgage, 0 home equity loan, 69 both second mortgage and home equity loan)
Houses without a mortgage: 90
Median household income for houses/condos with a mortgage: $101,963
Median household income for apartments without a mortgage: $46,734
Median monthly housing costs: $1,316
Compare current foreclosures near Hellertown, PA:
| Photo | Address | Area | Beds / Baths | Price | Details |
|---|---|---|---|---|---|

|
#1
Wagner Ave
Hellertown, PA 18055
|
1,091 sq. feet
|
1 baths 3 beds |
show details | |

|
#2
Springtown Hill Rd
Hellertown, PA 18055
|
1,080 sq. feet
|
2 baths 3 beds |
show details | |

|
#3
E Depot St
Hellertown, PA 18055
|
1,272 sq. feet
|
1 baths 2 beds |
show details | |

|
#4
Main St
Hellertown, PA 18055
|
1,272 sq. feet
|
1 baths 2 beds |
show details | |

|
#5
2nd Ave
Hellertown, PA 18055
|
1,216 sq. feet
|
1 baths 3 beds |
show details | |

|
#6
New St
Hellertown, PA 18055
|
1,504 sq. feet
|
1 baths 3 beds |
show details | |

|
#7
Kichline Rd
Hellertown, PA 18055
|
2,901 sq. feet
|
2 baths 4 beds |
show details | |

|
#8
Leithsville Rd
Hellertown, PA 18055
|
1,372 sq. feet
|
1 baths 2 beds |
show details | |

|
#9
Detweiler Ave
Hellertown, PA 18055
|
1,986 sq. feet
|
1 baths 3 beds |
show details | |

|
#10
Country Side Ln
Hellertown, PA 18055
|
1,107 sq. feet
|
1 baths 2 beds |
show details |
| Photo | Address | Area | Beds / Baths | Price | Details |
|---|---|---|---|---|---|

|
#11
Roth Ave
Hellertown, PA 18055
|
1,388 sq. feet
|
1 baths 3 beds |
show details | |

|
#12
Wassergass Rd
Hellertown, PA 18055
|
1,945 sq. feet
|
2 baths 3 beds |
show details | |

|
#13
Meadows Rd
Hellertown, PA 18055
|
1,753 sq. feet
|
2 baths 3 beds |
show details | |

|
#14
Northampton St Apt 605
Hellertown, PA 18055
|
- sq. feet
|
- baths - beds |
show details | |

|
#15
Front St Apt 13
Hellertown, PA 18055
|
- sq. feet
|
- baths - beds |
show details | |

|
#16
Silver Creek Rd
Hellertown, PA 18055
|
- sq. feet
|
- baths - beds |
show details | |

|
#17
W Thomas Ave
Hellertown, PA 18055
|
- sq. feet
|
- baths - beds |
show details | |

|
#18
Glen Ave
Phillipsburg, NJ 08865
|
1,542 sq. feet
|
1 baths 3 beds |
$139,900
|
show details |

|
#19
2nd St
Whitehall, PA 18052
|
1,254 sq. feet
|
1 baths 3 beds |
$139,900
|
show details |

|
#20
Gallmeier Rd
Frenchtown, NJ 08825
|
1,352 sq. feet
|
3 baths 3 beds |
$439,900
|
show details |
| Photo | Address | Area | Beds / Baths | Price | Details |
|---|---|---|---|---|---|

|
#21
Bridgeton Hill Rd
Upper Black Eddy, PA 18972
|
1,326 sq. feet
|
1 baths 3 beds |
$277,492
|
show details |

|
#22
Vera Cir
Bethlehem, PA 18017
|
1,452 sq. feet
|
1 baths 3 beds |
show details | |

|
#23
Main St
Stockertown, PA 18083
|
1,188 sq. feet
|
2 baths 4 beds |
show details | |

|
#24
S 12th St
Allentown, PA 18102
|
1,820 sq. feet
|
1 baths 5 beds |
show details | |

|
#25
Hunt Dr
Macungie, PA 18062
|
2,030 sq. feet
|
2 baths 3 beds |
show details | |

|
#26
Lafayette Ave
Bethlehem, PA 18017
|
864 sq. feet
|
1 baths 3 beds |
show details | |

|
#27
Independence Ct
Bethlehem, PA 18020
|
1,548 sq. feet
|
2 baths 3 beds |
show details | |

|
#28
S 13th St
Easton, PA 18042
|
1,488 sq. feet
|
1 baths 4 beds |
show details | |

|
#29
Mckee Ct
Macungie, PA 18062
|
2,888 sq. feet
|
2 baths 4 beds |
show details | |

|
#30
Lincoln St
Bethlehem, PA 18017
|
892 sq. feet
|
1 baths 2 beds |
show details |
| Photo | Address | Area | Beds / Baths | Price | Details |
|---|---|---|---|---|---|

|
#31
Freemansburg Ave
Easton, PA 18045
|
1,298 sq. feet
|
1 baths 3 beds |
show details | |

|
#32
Washington St # C
Stewartsville, NJ 08886
|
4,364 sq. feet
|
3 baths 8 beds |
show details | |

|
#33
Rutland Rd
Bethlehem, PA 18020
|
1,448 sq. feet
|
1 baths 3 beds |
show details | |

|
#34
3rd St
Catasauqua, PA 18032
|
1,705 sq. feet
|
1 baths 4 beds |
show details | |

|
#35
S Fulton St
Allentown, PA 18102
|
1,483 sq. feet
|
1 baths 3 beds |
show details | |

|
#36
Aubrey Dr
Quakertown, PA 18951
|
1,400 sq. feet
|
2 baths 3 beds |
show details | |

|
#37
Washington St
Easton, PA 18042
|
2,187 sq. feet
|
1 baths 2 beds |
show details | |

|
#38
Knollwood Dr
Easton, PA 18042
|
2,196 sq. feet
|
3 baths 3 beds |
show details | |

|
#39
Mellicks Wood Rd
Phillipsburg, NJ 08865
|
936 sq. feet
|
1 baths 2 beds |
show details | |

|
#40
E Wilkes Barre St
Easton, PA 18042
|
1,212 sq. feet
|
1 baths 4 beds |
show details |
| Photo | Address | Area | Beds / Baths | Price | Details |
|---|---|---|---|---|---|

|
#41
Whitewood Rd
Bethlehem, PA 18017
|
1,738 sq. feet
|
2 baths 4 beds |
show details | |

|
#42
Washinqton Ave
Northampton, PA 18067
|
1,328 sq. feet
|
1 baths 3 beds |
show details | |

|
#43
Edie Ln
Easton, PA 18045
|
1,092 sq. feet
|
1 baths 4 beds |
show details | |

|
#44
Park Pl
Bethlehem, PA 18017
|
1,272 sq. feet
|
2 baths 3 beds |
show details | |

|
#45
N Jerome St
Allentown, PA 18109
|
746 sq. feet
|
1 baths 2 beds |
show details | |

|
#46
E Paletown Rd
Quakertown, PA 18951
|
1,232 sq. feet
|
1 baths 3 beds |
show details | |

|
#47
Blair Rd
Bethlehem, PA 18017
|
2,647 sq. feet
|
2 baths 4 beds |
show details | |

|
#48
Foxdale Dr
Whitehall, PA 18052
|
1,729 sq. feet
|
2 baths 3 beds |
show details | |

|
#49
Belvidere Rd
Phillipsburg, NJ 08865
|
2,154 sq. feet
|
2 baths 3 beds |
show details | |

|
Check over 1 million property listings on Foreclosure.com!
|
browse all offers | |||

Latest news about housing in Hellertown, PA collected exclusively by city-data.com from local newspapers, TV, and radio stations

 | I Went Searching For Apartments Bethlehem yesterday.....Help! (10 replies) |
| Looking for 3 bdrm QUIET rental apt/townhome (7 replies) |
| Where to start a house hunt? (12 replies) |
| Hellertown vs Coopersburg (40 replies) |
| Morning Call article on real estate by school district (10 replies) |
| noise from Hellertown gun club--buying in area (3 replies) |
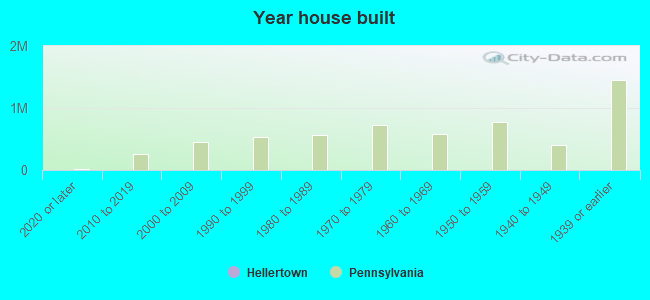
Median year apartment built: 1959
Household type by relationship:
Households: 6,191- Male householders: 1,099 (481 living alone), Female householders: 1,478 (554 living alone)
1,154 spouses (1,132 opposite-sex spouses), 186 unmarried partners, (186 opposite-sex unmarried partners), 1,739 children (1,692 natural, 18 adopted, 28 stepchildren), 62 grandchildren, 30 brothers or sisters, 36 parents, 0 foster children, 31 other relatives, 209 non-relatives
- In group quarters: 162
Size of family households: 580 2-persons, 268 3-persons, 270 4-persons, 182 5-persons, 35 6-persons, 12 7-or-more-persons.
Size of nonfamily households: 1,185 1-person, 96 2-persons, 7 3-persons, 11 4-persons.
669 married couples with children.
517 single-parent households (254 men, 263 women).
89.5% of residents of Hellertown speak English at home.
7.4% of residents speak Spanish at home (58% speak English very well, 21% speak English well, 20% don't speak English at all).
1.9% of residents speak other Indo-European language at home (76% speak English very well, 24% speak English well).
1.3% of residents speak Asian or Pacific Island language at home (48% speak English very well, 38% speak English well, 14% speak English not well).
Foreign born population: 309 (5.0%)
(47.6% of them are naturalized citizens)
| Here: | 6.3 |
| State: | 6.8 |
| Here: | 4.0 |
| State: | 4.3 |
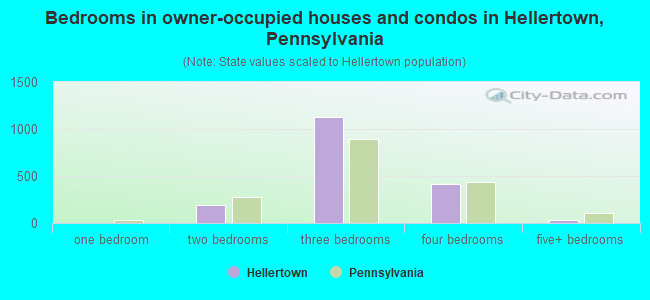
- Bedrooms in owner-occupied houses and condos in Hellertown, Pennsylvania
- 0no bedroom
- 01 bedroom
- 1892 bedrooms
- 1,1283 bedrooms
- 4124 bedrooms
- 325+ bedrooms
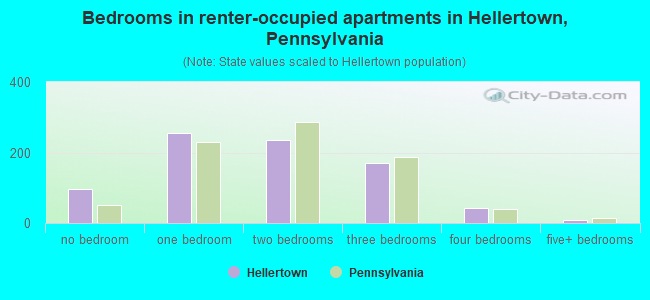
- Bedrooms in renter-occupied apartments in Hellertown, Pennsylvania
- 97no bedroom
- 2551 bedroom
- 2362 bedrooms
- 1703 bedrooms
- 424 bedrooms
- 95+ bedrooms
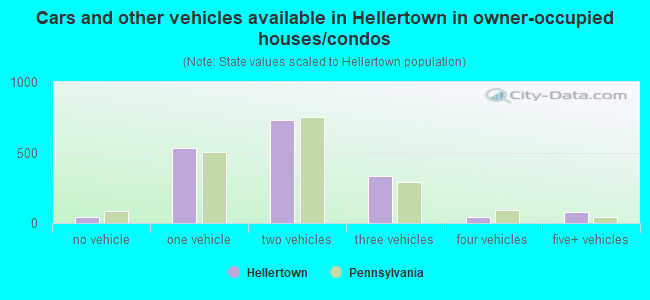
- Cars and other vehicles available in Hellertown in owner-occupied houses/condos
- 40no vehicle
- 5331 vehicle
- 7312 vehicles
- 3333 vehicles
- 434 vehicles
- 815+ vehicles
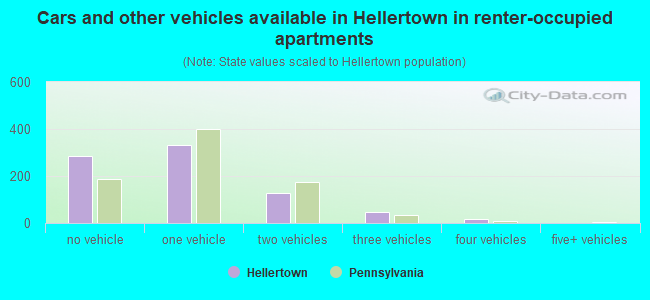
- Cars and other vehicles available in Hellertown in renter-occupied apartments
- 285no vehicle
- 3331 vehicle
- 1282 vehicles
- 463 vehicles
- 164 vehicles
- 05+ vehicles
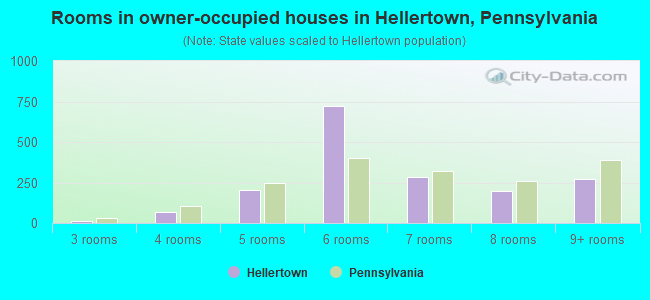
- Rooms in owner-occupied houses in Hellertown, Pennsylvania
- 01 room
- 02 rooms
- 133 rooms
- 694 rooms
- 2035 rooms
- 7236 rooms
- 2857 rooms
- 1958 rooms
- 2749+ rooms
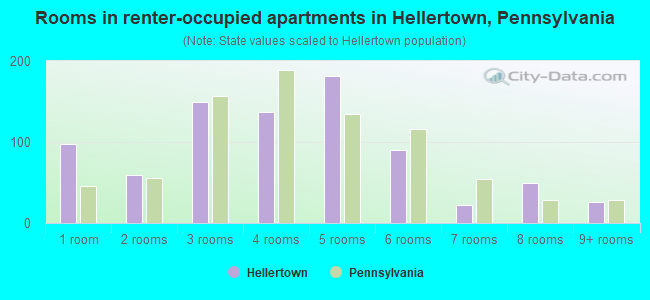
- Rooms in renter-occupied apartments in Hellertown, Pennsylvania
- 971 room
- 592 rooms
- 1493 rooms
- 1374 rooms
- 1815 rooms
- 906 rooms
- 227 rooms
- 498 rooms
- 269+ rooms
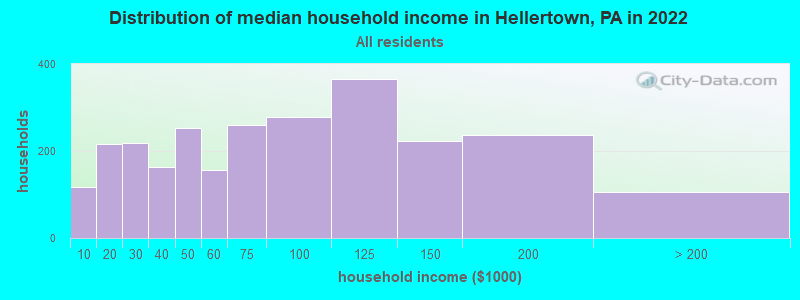
Hellertown, PA household income distribution

- 118Less than $10,000
- 215$10,000 to $19,999
- 219$20,000 to $29,999
- 164$30,000 to $39,999
- 252$40,000 to $49,999
- 156$50,000 to $59,999
- 260$60,000 to $74,999
- 278$75,000 to $99,999
- 365$100,000 to $124,999
- 224$125,000 to $149,999
- 237$150,000 to $199,999
- 105$200,000 or more
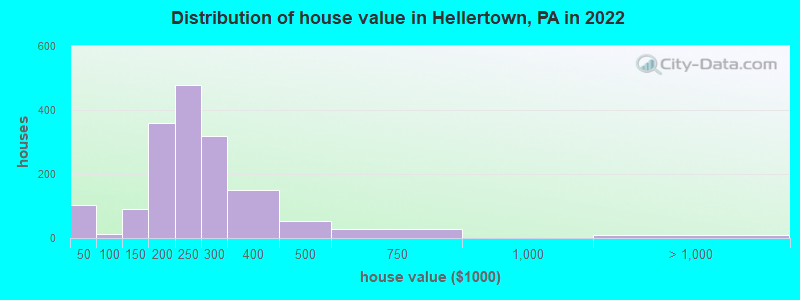
Home value of owner - occupied houses in 2022 in Hellertown, PA
-
- 76Less than $10,000
- 13$15,000 to $19,999
- 14$40,000 to $49,999
- 26$100,000 to $124,999
- 63$125,000 to $149,999
- 202$150,000 to $174,999
- 157$175,000 to $199,999
- 478$200,000 to $249,999
- 318$250,000 to $299,999
- 148$300,000 to $399,999
- 54$400,000 to $499,999
- 27$500,000 to $749,999
- 10$2,000,000 or more
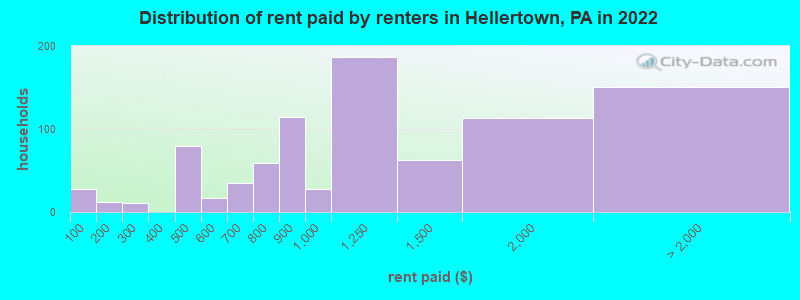
Rent paid by renters in 2022 in Hellertown, PA
-
- 27Less than $100
- 12$100 to $149
- 10$250 to $299
- 15$400 to $449
- 63$450 to $499
- 13$500 to $549
- 3$550 to $599
- 12$600 to $649
- 21$650 to $699
- 45$700 to $749
- 13$750 to $799
- 114$800 to $899
- 28$900 to $999
- 186$1,000 to $1,249
- 63$1,250 to $1,499
- 112$1,500 to $1,999
- 31$2,000 to $2,499
- 24$2,500 to $2,999
- 62$3,500 or more
- 32No cash rent
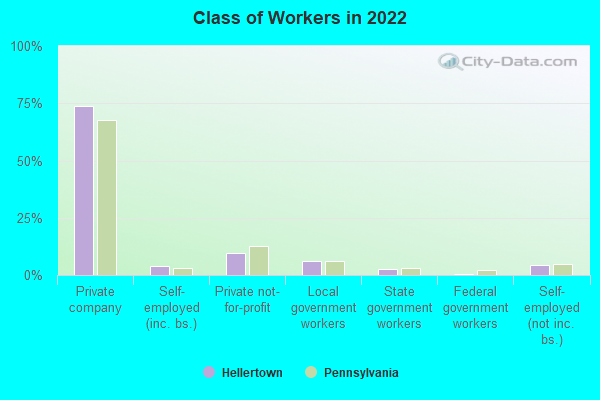
Percentage of workers working in this county: 54.8%
Number of people working at home: 540 (17.6% of all workers)
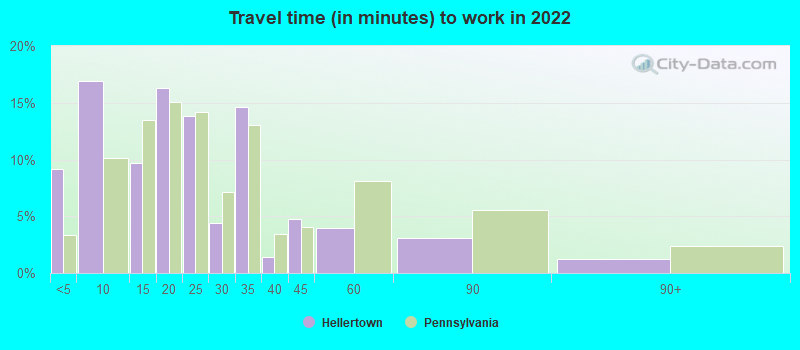
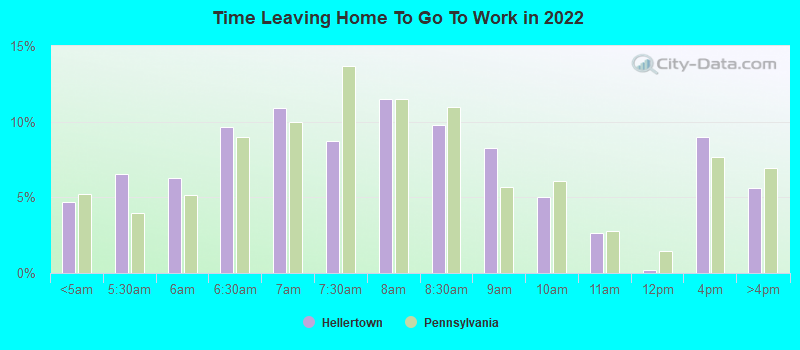
Travel time to work (commute)
- Less than 5 minutes: 134
- 5 to 9 minutes: 334
- 10 to 14 minutes: 311
- 15 to 19 minutes: 518
- 20 to 24 minutes: 386
- 25 to 29 minutes: 186
- 30 to 34 minutes: 185
- 35 to 39 minutes: 24
- 40 to 44 minutes: 10
- 45 to 59 minutes: 187
- 60 to 89 minutes: 172
- 90 or more minutes: 133

Means of transportation to work:
- Drove a car alone: 1,317 (66.6%)
- Carpooled: 52 (2.6%)
- Walked: 79 (4.0%)
- Worked at home: 540 (27.3%)
- Unemployment by race in 2022
- Unemployment rate for White non-Hispanic residents
- 3.7%Males
- 2.1%Females
- Unemployment rate for Black residents
- 100.0%Females
- Unemployment rate for two or more race residents
- 3.1%Males
- 70.3%Females
- Unemployment rate for Hispanic or Latino residents
- 3.8%Males
- 26.4%Females
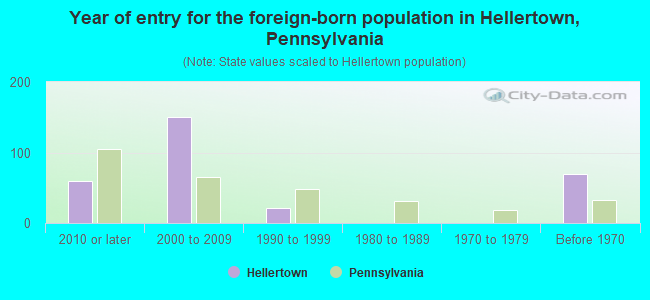
- Year of entry for the foreign-born population in Hellertown, Pennsylvania
- 602010 or later
- 1512000 to 2009
- 211990 to 1999
- 01980 to 1989
- 01970 to 1979
- 69Before 1970
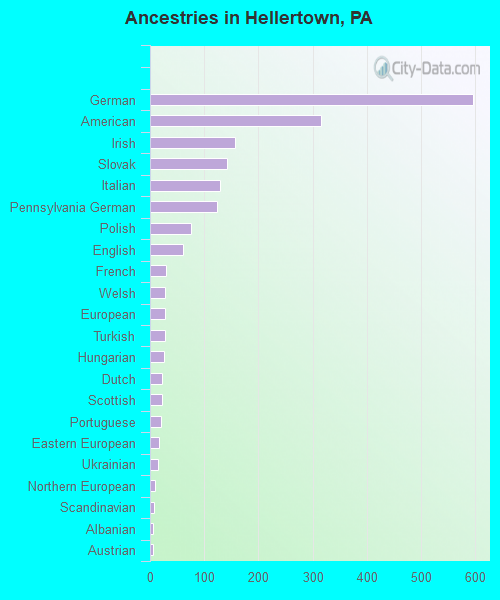
First ancestries reported:
- German: 596 (24.2%)
- American: 316 (12.8%)
- Irish: 156 (6.3%)
- Slovak: 143 (5.8%)
- Italian: 130 (5.3%)
- Pennsylvania German: 124 (5.0%)
- Polish: 75 (3.0%)
- English: 61 (2.5%)
- French: 30 (1.2%)
- Welsh: 28 (1.1%)
- European: 27 (1.1%)
- Turkish: 27 (1.1%)
- Hungarian: 25 (1.0%)
- Dutch: 22 (0.9%)
- Scottish: 22 (0.9%)
- Portuguese: 20 (0.8%)
- Eastern European: 16 (0.6%)
- Ukrainian: 14 (0.6%)
- Northern European: 10 (0.4%)
- Scandinavian: 8 (0.3%)
- Albanian: 6 (0.2%)
- Austrian: 6 (0.2%)
- Lithuanian: 5 (0.2%)
- Russian: 4 (0.2%)
- Croatian: 3 (0.1%)
- Ugandan: 1 (0.04%)
Most common places of birth for foreign-born residents (%):
| Hellertown: | 23.2% (65) |
| Pennsylvania: | 5.8% (54,190) |
| Hellertown: | 13.2% (37) |
| Pennsylvania: | 9.2% (86,544) |
| Hellertown: | 12.1% (34) |
| Pennsylvania: | 10.7% (100,596) |
| Hellertown: | 7.1% (20) |
| Pennsylvania: | 0.8% (7,727) |
| Hellertown: | 6.8% (19) |
| Pennsylvania: | 0.5% (4,441) |
| Hellertown: | 6.4% (18) |
| Pennsylvania: | 0.1% (1,090) |
| Hellertown: | 5.7% (16) |
| Pennsylvania: | 1.4% (13,268) |
| Hellertown: | 5.4% (15) |
| Pennsylvania: | 1.0% (9,386) |
| Hellertown: | 3.6% (10) |
| Pennsylvania: | 1.1% (10,331) |
| Hellertown: | 2.1% (6) |
| Pennsylvania: | 1.3% (12,172) |
| Hellertown: | 2.1% (6) |
| Pennsylvania: | 7.2% (67,704) |
| Hellertown: | 1.8% (5) |
| Pennsylvania: | 2.9% (27,433) |
| Hellertown: | 1.8% (5) |
| Pennsylvania: | 0.6% (6,097) |
| Hellertown: | 1.8% (5) |
| Pennsylvania: | 1.8% (16,884) |
| Hellertown: | 1.8% (5) |
| Pennsylvania: | 0.1% (1,010) |
Place of birth for U.S.-born residents:
- This state: 4,264
- Other state: 1,385
- Northeast: 983
- Midwest: 95
- South: 210
- West: 71
94.5% of Hellertown residents lived in the same house 1 years ago.
Out of people who lived in different houses, 26.7% lived in this county.
Out of people who lived in different counties, 66.1% lived in Pennsylvania.
| Hellertown: | 94.5% |
| State average: | 89.3% |
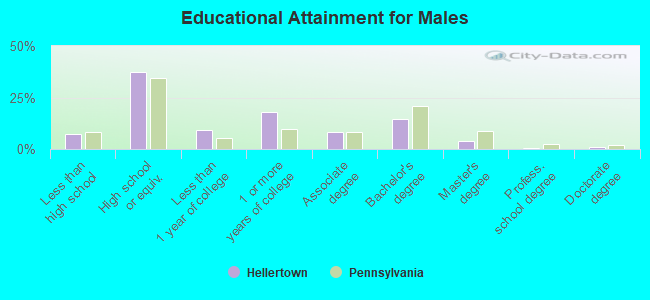
Education attainment for males 25 years and older:
- No schooling: 1
- Nursery to 4th grade: 12
- 5th and 6th grade: 0
- 7th and 8th grade: 0
- 9th grade: 52
- 10th grade: 4
- 11th grade: 23
- 12th grade, no diploma: 66
- High school graduate (or equivalency): 834
- Less than 1 year of college: 202
- Some college more than 1 year, no degree: 403
- Associate degree: 186
- Bachelor's degree: 329
- Master's degree: 88
- Professional school degree: 14
- Doctorate degree: 25
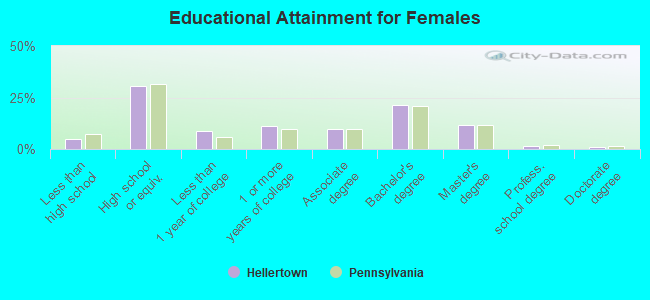
Education attainment for females 25 years and older:
- No schooling: 0
- Nursery to 4th grade: 0
- 5th and 6th grade: 0
- 7th and 8th grade: 9
- 9th grade: 0
- 10th grade: 27
- 11th grade: 48
- 12th grade, no diploma: 23
- High school graduate (or equivalency): 709
- Less than 1 year of college: 206
- Some college more than 1 year, no degree: 258
- Associate degree: 220
- Bachelor's degree: 498
- Master's degree: 266
- Professional school degree: 30
- Doctorate degree: 19
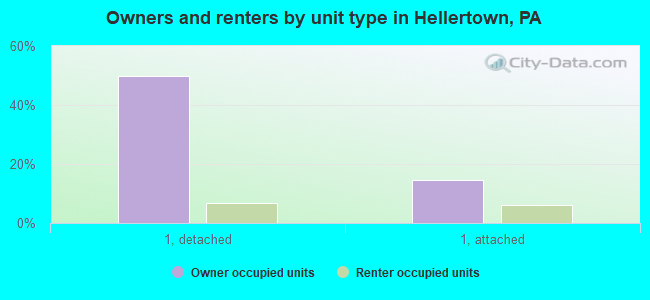
Housing units in structures:
- One, detached: 1,546
- One, attached: 553
- Two: 244
- 3 or 4: 33
- 5 to 9: 116
- 10 to 19: 78
- 20 to 49: 41
- 50 or more: 106
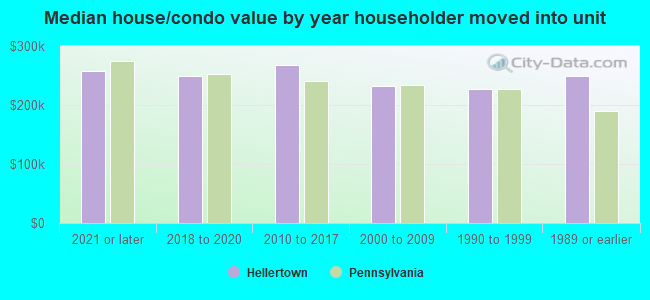
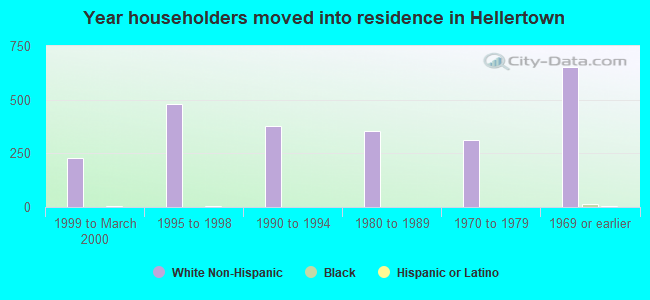
House/condo owner moved in on average 16 years ago
Renter moved in on average 2 years ago
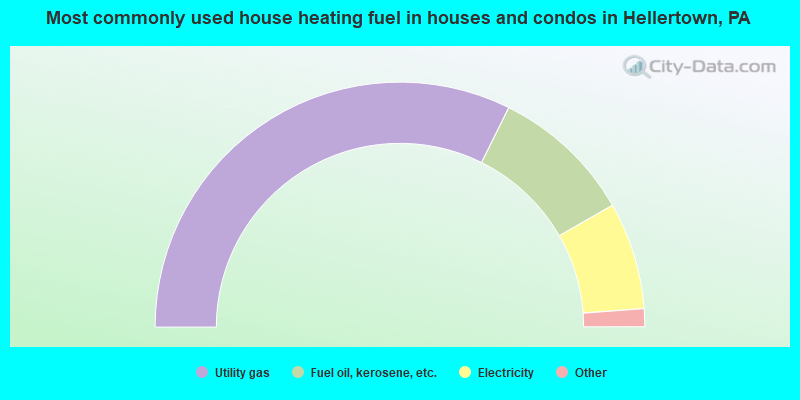
- 64.8%Utility gas
- 18.8%Fuel oil, kerosene, etc.
- 14.2%Electricity
- 1.4%Wood
- 0.9%Bottled, tank, or LP gas
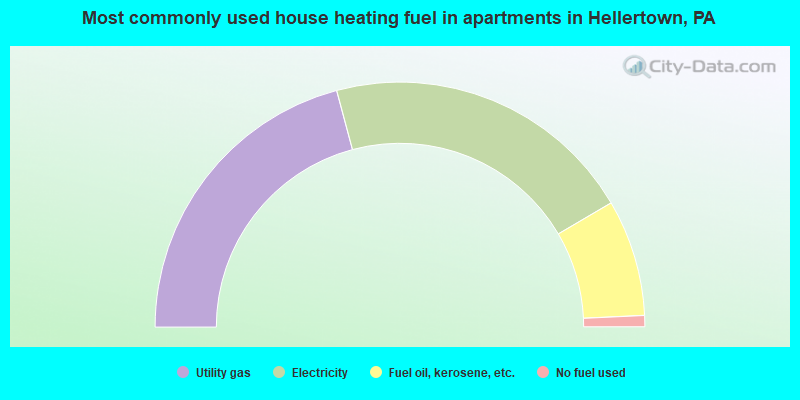
- 41.7%Utility gas
- 41.4%Electricity
- 15.4%Fuel oil, kerosene, etc.
- 1.5%No fuel used
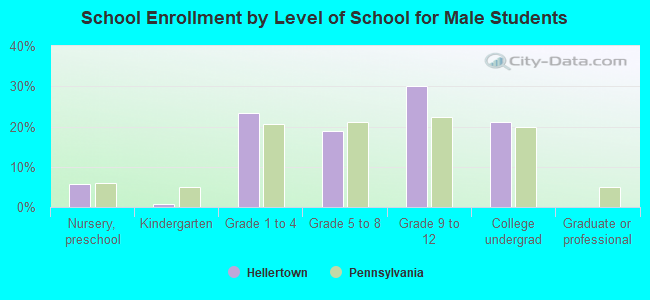
Private vs. public school enrollment:
| Here: | 3.0% |
| Pennsylvania: | 15.7% |
| Here: | 0.7% |
| Pennsylvania: | 13.4% |
| Here: | 42.4% |
| Pennsylvania: | 39.8% |