Hermitage Springs, TN (Tennessee) Houses and Residents
| Hermitage Springs: | $152,207 |
| Tennessee: | $284,800 |
Total population: 2,829 (Urban population: 0, Rural population: 2,851 (554 farm, 2,297 nonfarm))
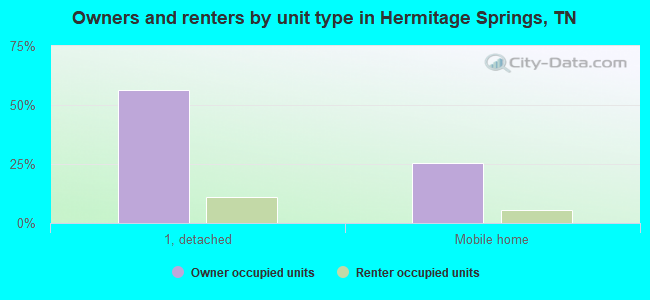
Houses: 1,326 (1,160 occupied: 961 owner occupied, 199 renter occupied)
| % of renters here: | 17% |
| State: | 33% |
Housing density: 15 houses/condos per square mile
Median price asked for vacant for-sale houses and condos in 2022 in this county: $126,124.
Median contract rent in 2022: $436 (lower quartile is $366, upper quartile is $515)
Median rent asked for vacant for-rent units in 2022: $379
Median gross rent in Hermitage Springs, TN in 2022: $720
Housing units in Hermitage Springs with a mortgage: 146 (6 second mortgage, 5 home equity loan, 0 both second mortgage and home equity loan)
Houses without a mortgage: 186


Household type by relationship:
Households: 7,765- In family households: 6,510 (1,678 male householders, 562 female householders)
1,706 spouses, 2,012 children (1,809 natural, 70 adopted, 133 stepchildren), 196 grandchildren, 42 brothers or sisters, 38 parents, foster children, 80 other relatives, 159 non-relatives
- In nonfamily households: 1,255 (562 male householders (481 living alone)), 556 female householders (515 living alone)), 137 nonrelatives
- In group quarters: 96 (84 institutionalized population)
1,164 married couples with children.
383 single-parent households (105 men, 278 women).
97.4% of residents of Hermitage Springs speak English at home.
1.6% of residents speak Spanish at home (12% speak English well, 60% speak English not well, 29% don't speak English at all).
1.0% of residents speak Asian or Pacific Island language at home (48% speak English very well, 52% speak English well).
Foreign born population: 100 (3.0%)
(43.0% of them are naturalized citizens)
| Here: | 6.3 |
| State: | 6.5 |
| Here: | 4.9 |
| State: | 4.4 |
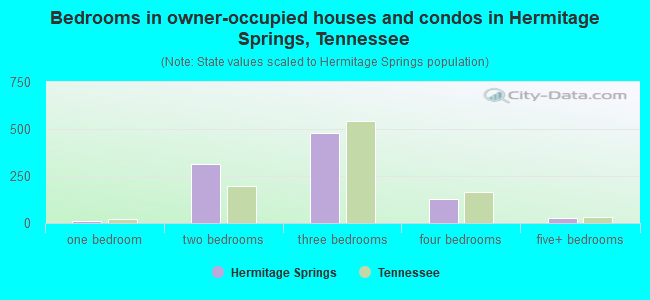
- Bedrooms in owner-occupied houses and condos in Hermitage Springs, Tennessee
- 0no bedroom
- 121 bedroom
- 3132 bedrooms
- 4813 bedrooms
- 1304 bedrooms
- 255+ bedrooms
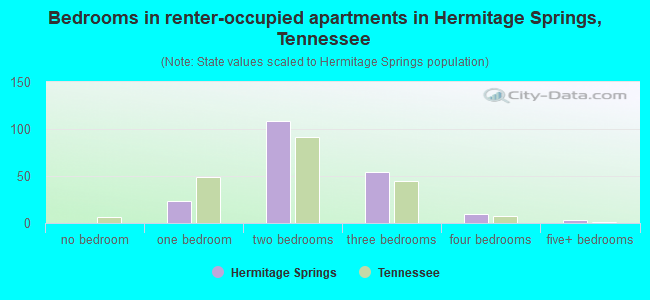
- Bedrooms in renter-occupied apartments in Hermitage Springs, Tennessee
- 0no bedroom
- 231 bedroom
- 1092 bedrooms
- 543 bedrooms
- 104 bedrooms
- 35+ bedrooms
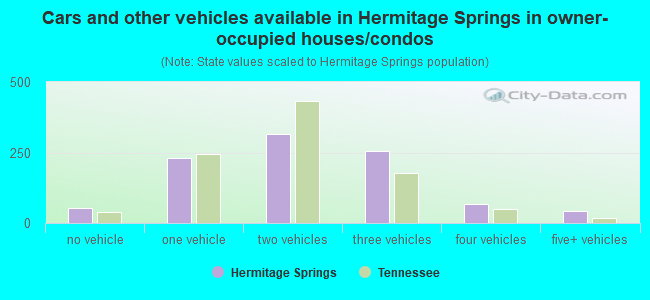
- Cars and other vehicles available in Hermitage Springs in owner-occupied houses/condos
- 53no vehicle
- 2301 vehicle
- 3142 vehicles
- 2573 vehicles
- 664 vehicles
- 415+ vehicles

- Cars and other vehicles available in Hermitage Springs in renter-occupied apartments
- 26no vehicle
- 771 vehicle
- 532 vehicles
- 433 vehicles
- 04 vehicles
- 05+ vehicles
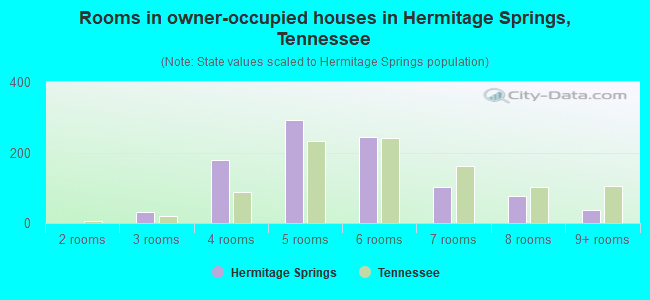
- Rooms in owner-occupied houses in Hermitage Springs, Tennessee
- 01 room
- 02 rooms
- 313 rooms
- 1784 rooms
- 2915 rooms
- 2446 rooms
- 1017 rooms
- 788 rooms
- 389+ rooms
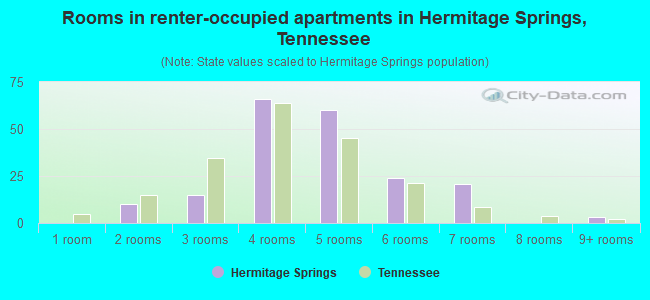
- Rooms in renter-occupied apartments in Hermitage Springs, Tennessee
- 01 room
- 102 rooms
- 153 rooms
- 664 rooms
- 605 rooms
- 246 rooms
- 217 rooms
- 08 rooms
- 39+ rooms
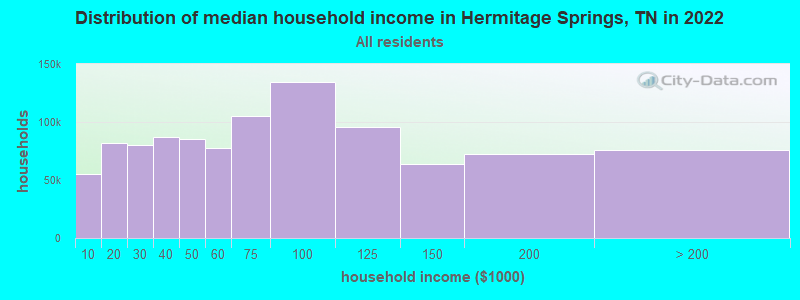
Hermitage Springs, TN household income distribution

- 36,532Less than $10,000
- 61,275$10,000 to $19,999
- 58,112$20,000 to $29,999
- 59,416$30,000 to $39,999
- 57,447$40,000 to $49,999
- 53,172$50,000 to $59,999
- 72,495$60,000 to $74,999
- 92,404$75,000 to $99,999
- 69,107$100,000 to $124,999
- 41,164$125,000 to $149,999
- 45,181$150,000 to $199,999
- 38,194$200,000 or more
Percentage of workers working in this county: 49.3%
Number of people working at home: 141 (9.8% of all workers)
Travel time to work (commute)
- Less than 5 minutes: 44
- 5 to 9 minutes: 123
- 10 to 14 minutes: 132
- 15 to 19 minutes: 184
- 20 to 24 minutes: 139
- 25 to 29 minutes: 79
- 30 to 34 minutes: 169
- 35 to 39 minutes: 13
- 40 to 44 minutes: 24
- 45 to 59 minutes: 147
- 60 to 89 minutes: 83
- 90 or more minutes: 91
Means of transportation to work:
- Drove a car alone: 1,017 (79.2%)
- Carpooled: 177 (13.8%)
- Bus or trolley bus: 9 (0.7%)
- Walked: 19 (1.5%)
- Other means: 6 (0.5%)
- Worked at home: 56 (4.4%)
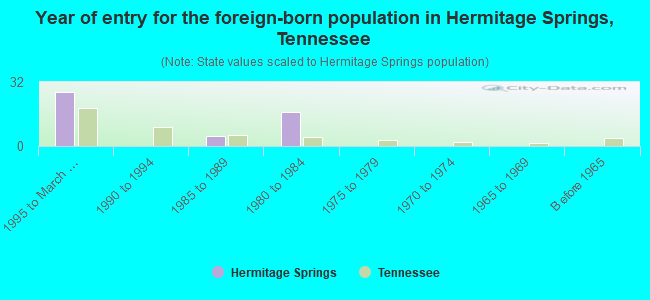
- Year of entry for the foreign-born population in Hermitage Springs, Tennessee
- 271995 to March 2000
- 01990 to 1994
- 51985 to 1989
- 171980 to 1984
- 01975 to 1979
- 01970 to 1974
- 01965 to 1969
- 0Before 1965
Most common places of birth for foreign-born residents (%):
| Hermitage Springs: | 55.1% (27) |
| Tennessee: | 28.1% (44,682) |
| Hermitage Springs: | 44.9% (22) |
| Tennessee: | 1.0% (1,525) |
Place of birth for U.S.-born residents:
- This state: 1,709
- Other state: 1,093
- Northeast: 6
- Midwest: 202
- South: 874
- West: 11
69% of Hermitage Springs residents lived in the same house 5 years ago.
Out of people who lived in different houses, 56% lived in this county.
Out of people who lived in different counties, 66% lived in Tennessee.
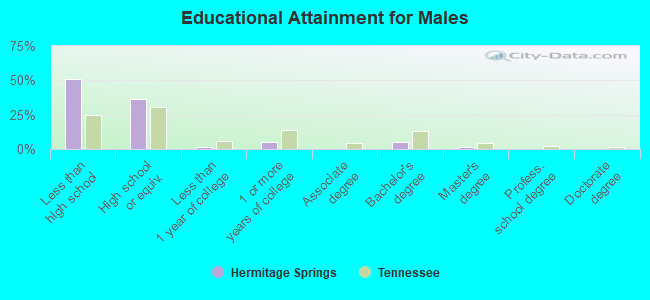
Education attainment for males 25 years and older:
- No schooling: 24
- Nursery to 4th grade: 10
- 5th and 6th grade: 48
- 7th and 8th grade: 202
- 9th grade: 68
- 10th grade: 73
- 11th grade: 48
- 12th grade, no diploma: 22
- High school graduate (or equivalency): 357
- Less than 1 year of college: 11
- Some college more than 1 year, no degree: 49
- Associate degree: 0
- Bachelor's degree: 53
- Master's degree: 12
- Professional school degree: 0
- Doctorate degree: 0
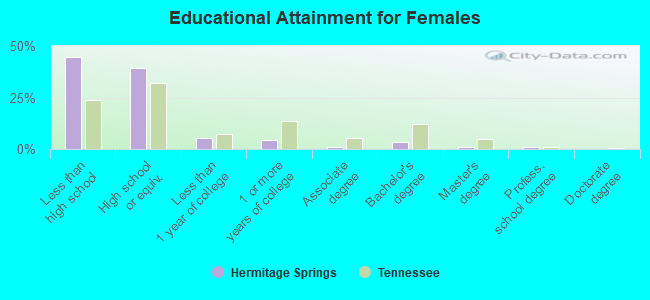
Education attainment for females 25 years and older:
- No schooling: 37
- Nursery to 4th grade: 21
- 5th and 6th grade: 26
- 7th and 8th grade: 182
- 9th grade: 39
- 10th grade: 48
- 11th grade: 36
- 12th grade, no diploma: 36
- High school graduate (or equivalency): 374
- Less than 1 year of college: 51
- Some college more than 1 year, no degree: 44
- Associate degree: 11
- Bachelor's degree: 33
- Master's degree: 9
- Professional school degree: 7
- Doctorate degree: 0
Housing units in structures:
- One, detached: 877
- One, attached: 13
- Two: 6
- Mobile homes: 430
Median worth of mobile homes: $47,937
Housing units lacking complete kitchen facilities: 2.6%
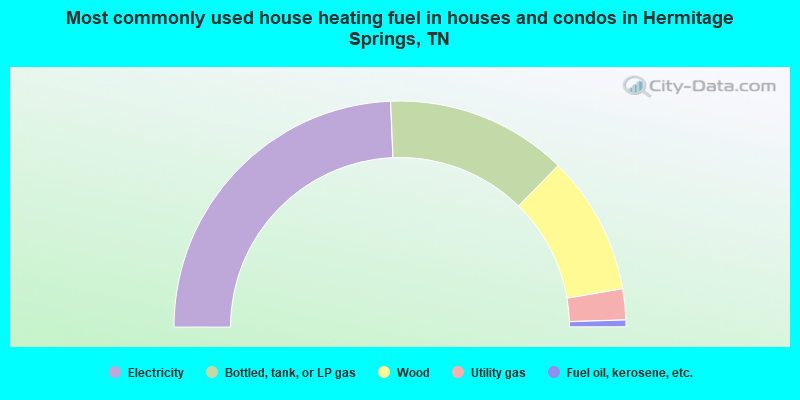
- 48.7%Electricity
- 26.0%Bottled, tank, or LP gas
- 19.9%Wood
- 4.4%Utility gas
- 1.0%Fuel oil, kerosene, etc.
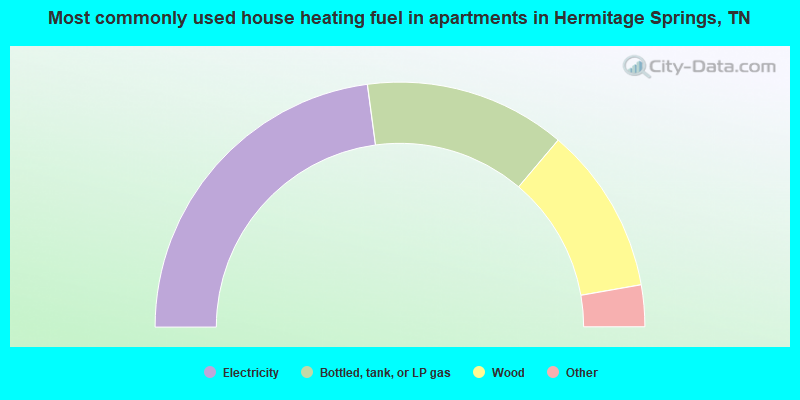
- 45.7%Electricity
- 26.6%Bottled, tank, or LP gas
- 22.1%Wood
- 3.0%Fuel oil, kerosene, etc.
- 2.5%Utility gas
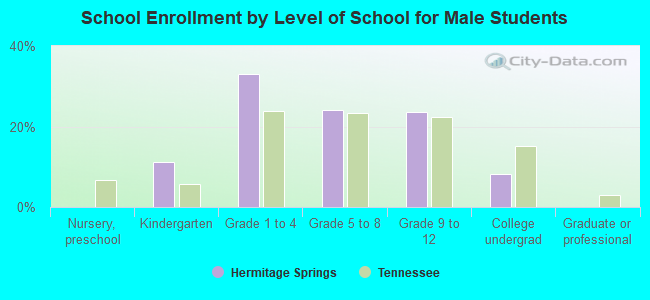
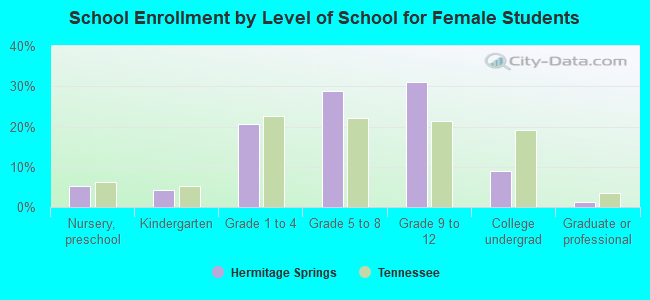
Private vs. public school enrollment:
| Here: | 0.0% |
| Tennessee: | 9.5% |
| Here: | 0.0% |
| Tennessee: | 10.4% |
| Here: | 0.0% |
| Tennessee: | 22.8% |