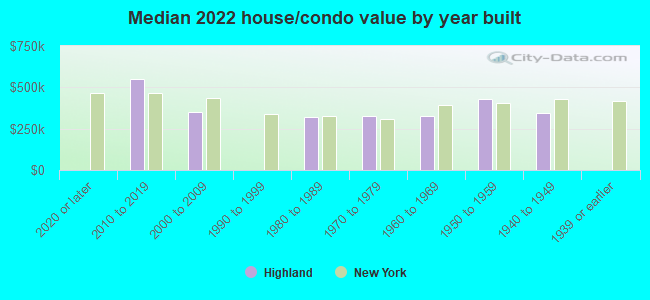
Highland, NY (New York) Houses and Residents
| Highland: | $392,738 |
| New York: | $400,400 |
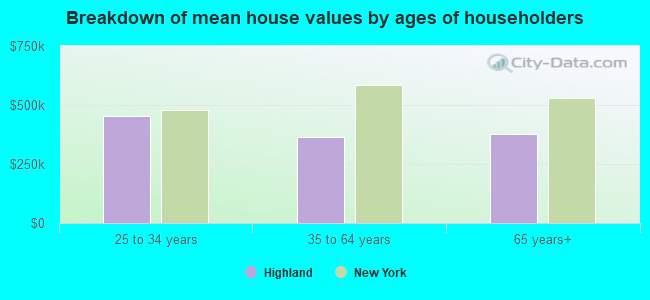
Mean price in 2022:
Detached houses: $362,576
Here: $362,576 State: $476,719 Townhouses or other attached units: $310,801
Here: $310,801 State: $699,270 In 2-unit structures: $562,531
Here: $562,531 State: $713,077 In 5-or-more-unit structures: $226,231
Here: $226,231 State: $912,009
Total population: 5,647 (Urban population: 5,060, Rural population: 0)
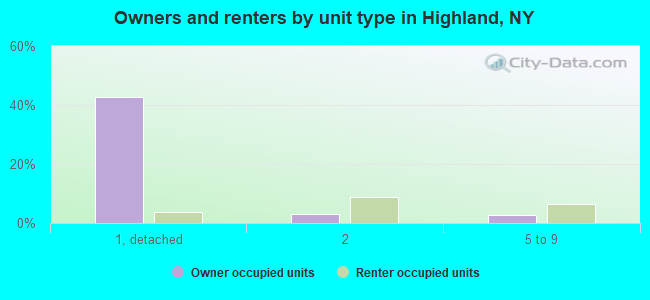
Houses: 2,819 (2,532 occupied: 1,582 owner occupied, 1,035 renter occupied)
| % of renters here: | 40% |
| State: | 46% |
Housing density: 598 houses/condos per square mile
Median price asked for vacant for-sale houses and condos in 2022 in this county: $213,181.
Median contract rent in 2022: $1,322 (lower quartile is $1,012, upper quartile is over $2,000)
Median rent asked for vacant for-rent units in 2022: $1,494
Median gross rent in Highland, NY in 2022: $1,890
Housing units in Highland with a mortgage: 977 (126 second mortgage, 23 home equity loan, 112 both second mortgage and home equity loan)
Houses without a mortgage: 0
Median household income for houses/condos with a mortgage: $167,150
Median household income for apartments without a mortgage: $83,873
Median monthly housing costs: $1,940
Compare current foreclosures near Highland, NY:
| Photo | Address | Area | Beds / Baths | Price | Details |
|---|---|---|---|---|---|

|
#1
Sterling Pl
Highland, NY 12528
|
1,270 sq. feet
|
1 baths 2 beds |
show details | |

|
#2
Timber Ct
Highland, NY 12528
|
2,792 sq. feet
|
2 baths 3 beds |
show details | |

|
#3
Clearwater Rd
Highland, NY 12528
|
628 sq. feet
|
1 baths 2 beds |
show details | |

|
#4
North Rd
Highland, NY 12528
|
1,225 sq. feet
|
1 baths 2 beds |
show details | |

|
#5
Mayer Dr
Highland, NY 12528
|
3,005 sq. feet
|
3 baths 4 beds |
show details | |

|
#6
Dogwood Knoll Rd
Highland, NY 12528
|
2,284 sq. feet
|
1 baths 3 beds |
show details | |

|
#7
Milton Tpke
Highland, NY 12528
|
2,454 sq. feet
|
1 baths 3 beds |
show details | |

|
#8
South St
Highland, NY 12528
|
2,080 sq. feet
|
2 baths 4 beds |
show details | |

|
#9
Perkinsville Rd
Highland, NY 12528
|
1,930 sq. feet
|
3 baths 4 beds |
show details | |

|
#10
N Elting Corners Rd
Highland, NY 12528
|
1,556 sq. feet
|
1 baths 3 beds |
show details |
| Photo | Address | Area | Beds / Baths | Price | Details |
|---|---|---|---|---|---|

|
#11
N Elting Corners Rd
Highland, NY 12528
|
3,736 sq. feet
|
5 baths 3 beds |
show details | |

|
#12
Sharon Dr
Highland, NY 12528
|
1,092 sq. feet
|
1 baths 3 beds |
show details | |

|
#13
Red Top Rd
Highland, NY 12528
|
2,112 sq. feet
|
2 baths 3 beds |
show details | |

|
#14
Bell Dr
Highland, NY 12528
|
2,104 sq. feet
|
3 baths 3 beds |
show details | |

|
#15
Milton Xrds
Highland, NY 12528
|
1,720 sq. feet
|
2 baths 3 beds |
show details | |

|
#16
Roxanne Blvd
Highland, NY 12528
|
2,000 sq. feet
|
2 baths 4 beds |
show details | |

|
#17
New Paltz Rd
Highland, NY 12528
|
1,484 sq. feet
|
2 baths 3 beds |
show details | |

|
#18
Thatcher Rd
Highland, NY 12528
|
3,565 sq. feet
|
5 baths 4 beds |
show details | |

|
#19
Swartekill Rd
Highland, NY 12528
|
1,440 sq. feet
|
1 baths 2 beds |
show details | |

|
#20
Hillside Pl
Highland, NY 12528
|
- sq. feet
|
- baths - beds |
show details |
| Photo | Address | Area | Beds / Baths | Price | Details |
|---|---|---|---|---|---|

|
#21
S Street
Highland, NY 12528
|
- sq. feet
|
- baths - beds |
show details | |

|
#22
St Anthony Way
Highland, NY 12528
|
- sq. feet
|
- baths - beds |
show details | |

|
#23
Kisor Rd
Highland, NY 12528
|
- sq. feet
|
- baths - beds |
show details | |

|
#24
James St
Rosendale, NY 12472
|
1,474 sq. feet
|
2 baths 4 beds |
$279,500
|
show details |

|
#25
Laffin Ln
Poughkeepsie, NY 12603
|
1,600 sq. feet
|
2 baths 3 beds |
$435,000
|
show details |

|
#26
Stanton Ter
Poughkeepsie, NY 12603
|
2,767 sq. feet
|
2 baths 4 beds |
$518,900
|
show details |

|
#27
Penny Ln
Marlboro, NY 12542
|
2,514 sq. feet
|
2 baths 3 beds |
$299,900
|
show details |

|
#28
Dorothy Hts
Wappingers Falls, NY 12590
|
1,113 sq. feet
|
1 baths 3 beds |
$389,900
|
show details |

|
#29
Brunyswick
New Paltz, NY 12561
|
- sq. feet
|
1 baths 2 beds |
$114,900
|
show details |

|
#30
Salt Point Tpke
Clinton Corners, NY 12514
|
1,148 sq. feet
|
1 baths 3 beds |
$254,900
|
show details |
| Photo | Address | Area | Beds / Baths | Price | Details |
|---|---|---|---|---|---|

|
#31
State Route 52
Walden, NY 12586
|
2,680 sq. feet
|
2 baths 4 beds |
$449,900
|
show details |

|
#32
Patti Pl
Hopewell Junction, NY 12533
|
1,400 sq. feet
|
2 baths 3 beds |
$518,900
|
show details |

|
#33
Church St
Poughkeepsie, NY 12601
|
1,521 sq. feet
|
1 baths 4 beds |
$31,500
|
show details |

|
#34
Merrick Rd
Poughkeepsie, NY 12603
|
1,493 sq. feet
|
1 baths 3 beds |
$289,900
|
show details |

|
#35
Chapel Hill Rd
Highland, NY 12528
|
- sq. feet
|
- baths - beds |
show details | |

|
#36
North Rd
Highland, NY 12528
|
- sq. feet
|
- baths - beds |
show details | |

|
#37
Orchard St
Walden, NY 12586
|
1,236 sq. feet
|
1 baths 2 beds |
$89,900
|
show details |

|
#38
Lyons Ln
Milton, NY 12547
|
1,872 sq. feet
|
2 baths 3 beds |
$34,900
|
show details |

|
#39
New Unionville Rd
Wallkill, NY 12589
|
- sq. feet
|
1 baths 5 beds |
$199,500
|
show details |

|
#40
River Rd
Walden, NY 12586
|
2,534 sq. feet
|
2 baths 3 beds |
show details |
| Photo | Address | Area | Beds / Baths | Price | Details |
|---|---|---|---|---|---|

|
#41
Cardinal Rd
Hyde Park, NY 12538
|
2,692 sq. feet
|
2 baths 3 beds |
show details | |

|
#42
Harwich St
Kingston, NY 12401
|
1,866 sq. feet
|
2 baths 3 beds |
show details | |

|
#43
Muirfield Ct
Poughkeepsie, NY 12603
|
1,450 sq. feet
|
2 baths 2 beds |
show details | |

|
#44
Purse Ln # 12533
Hopewell Junction, NY 12533
|
910 sq. feet
|
1 baths 2 beds |
show details | |

|
#45
Route 376
Wappingers Falls, NY 12590
|
1,894 sq. feet
|
1 baths 3 beds |
show details | |

|
#46
Van Ness St
Newburgh, NY 12550
|
1,323 sq. feet
|
2 baths 3 beds |
show details | |

|
#47
Pray Ln
Lagrangeville, NY 12540
|
5,408 sq. feet
|
3 baths 4 beds |
show details | |

|
#48
All Angels Hill Rd
Wappingers Falls, NY 12590
|
1,196 sq. feet
|
2 baths 3 beds |
show details | |

|
#49
Wildflower Rdg
Poughkeepsie, NY 12603
|
3,854 sq. feet
|
3 baths 4 beds |
show details | |

|
Check over 1 million property listings on Foreclosure.com!
|
browse all offers | |||

Latest news about housing in Highland, NY collected exclusively by city-data.com from local newspapers, TV, and radio stations

 | Experiences with weekend "vacation" homes, and where to go, not more than 2 hours from Brooklyn? (64 replies) |
| Syracuse area condo communities (11 replies) |
| Why don't we have a Hudson Valley forum? (60 replies) |
| Relocating to Rochester Areas for Apartments (9 replies) |
| East New York residents fear being displaced developer plans high rise (81 replies) |
| Buffalo--Boom or Bust (849 replies) |
Median year apartment built: 1975
Household type by relationship:
Households: 6,550- Male householders: 1,120 (383 living alone), Female householders: 1,398 (486 living alone)
1,105 spouses (1,078 opposite-sex spouses), 268 unmarried partners, (268 opposite-sex unmarried partners), 1,679 children (1,639 natural, 0 adopted, 40 stepchildren), 0 grandchildren, 137 brothers or sisters, 71 parents, 0 foster children, 360 other relatives, 62 non-relatives
- In group quarters: 349
Size of family households: 665 2-persons, 290 3-persons, 355 4-persons, 80 5-persons, 41 6-persons, 120 7-or-more-persons.
Size of nonfamily households: 835 1-person, 199 2-persons, 1 3-persons.
680 married couples with children.
356 single-parent households (253 men, 103 women).
81.4% of residents of Highland speak English at home.
4.8% of residents speak Spanish at home (65% speak English very well, 28% speak English well, 2% speak English not well, 5% don't speak English at all).
1.5% of residents speak other Indo-European language at home (93% speak English very well, 3% speak English well, 3% don't speak English at all).
12.7% of residents speak Asian or Pacific Island language at home (60% speak English very well, 40% speak English well).
Foreign born population: 985 (15.0%)
(55.4% of them are naturalized citizens)
| Here: | 7.1 |
| State: | 6.3 |
| Here: | 3.9 |
| State: | 3.8 |
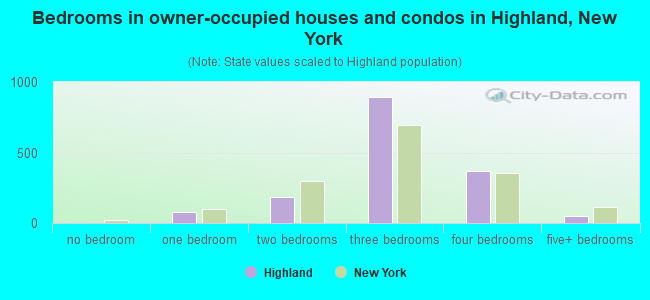
- Bedrooms in owner-occupied houses and condos in Highland, New York
- 0no bedroom
- 801 bedroom
- 1862 bedrooms
- 8943 bedrooms
- 3694 bedrooms
- 535+ bedrooms
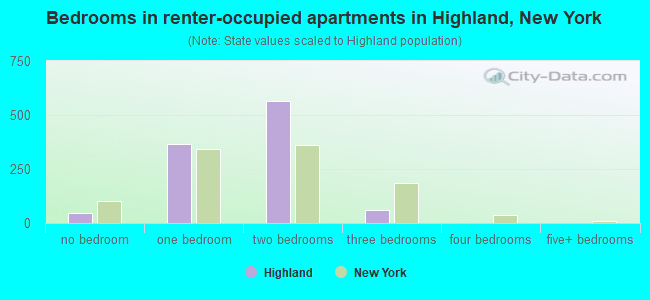
- Bedrooms in renter-occupied apartments in Highland, New York
- 44no bedroom
- 3651 bedroom
- 5642 bedrooms
- 623 bedrooms
- 04 bedrooms
- 05+ bedrooms
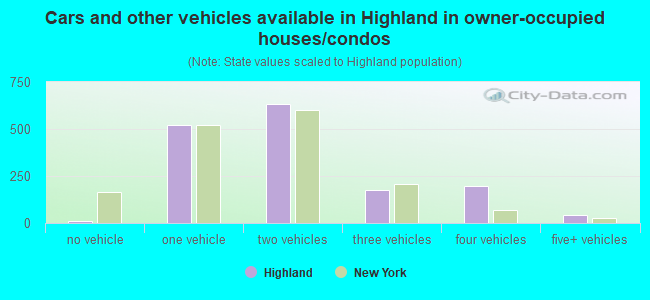
- Cars and other vehicles available in Highland in owner-occupied houses/condos
- 12no vehicle
- 5201 vehicle
- 6342 vehicles
- 1773 vehicles
- 1964 vehicles
- 445+ vehicles
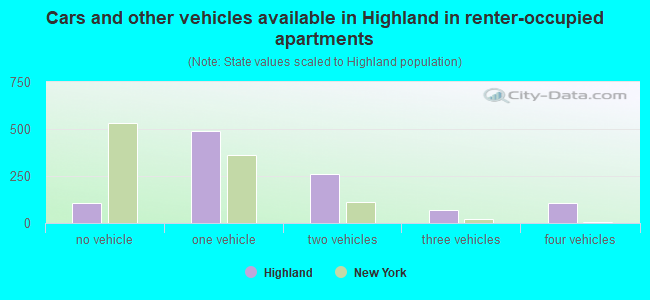
- Cars and other vehicles available in Highland in renter-occupied apartments
- 109no vehicle
- 4901 vehicle
- 2612 vehicles
- 703 vehicles
- 1054 vehicles
- 05+ vehicles
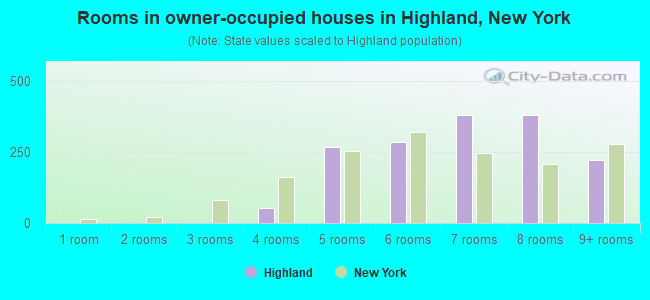
- Rooms in owner-occupied houses in Highland, New York
- 01 room
- 02 rooms
- 03 rooms
- 514 rooms
- 2685 rooms
- 2856 rooms
- 3807 rooms
- 3788 rooms
- 2219+ rooms
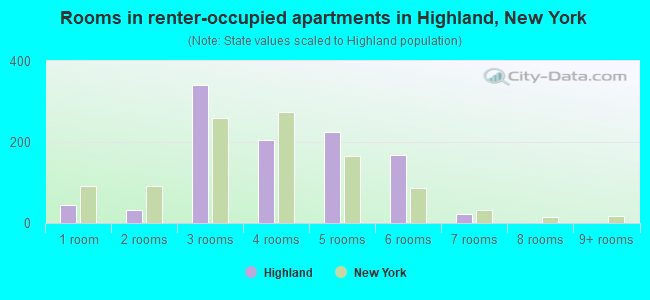
- Rooms in renter-occupied apartments in Highland, New York
- 441 room
- 312 rooms
- 3403 rooms
- 2044 rooms
- 2255 rooms
- 1696 rooms
- 237 rooms
- 08 rooms
- 09+ rooms
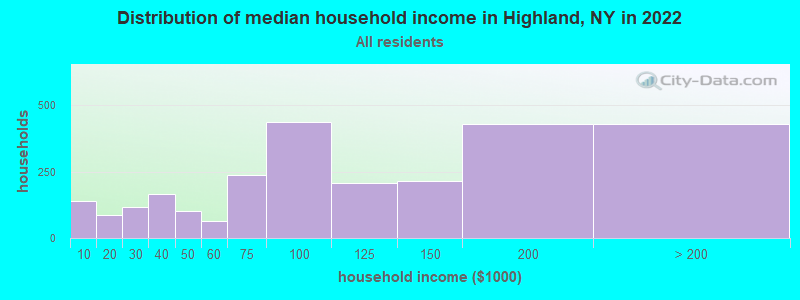
Highland, NY household income distribution

- 140Less than $10,000
- 86$10,000 to $19,999
- 117$20,000 to $29,999
- 164$30,000 to $39,999
- 103$40,000 to $49,999
- 63$50,000 to $59,999
- 239$60,000 to $74,999
- 437$75,000 to $99,999
- 208$100,000 to $124,999
- 216$125,000 to $149,999
- 428$150,000 to $199,999
- 431$200,000 or more
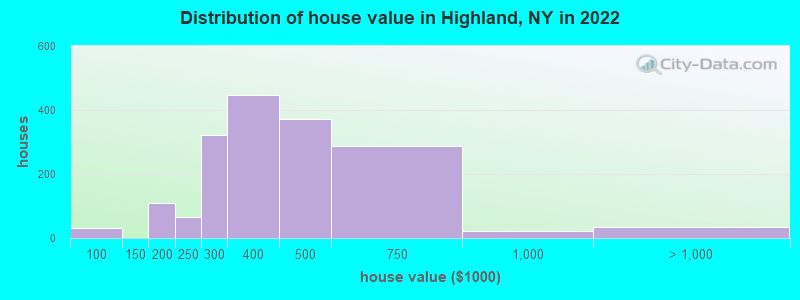
Home value of owner - occupied houses in 2022 in Highland, NY
-
- 30$70,000 to $79,999
- 73$150,000 to $174,999
- 35$175,000 to $199,999
- 64$200,000 to $249,999
- 321$250,000 to $299,999
- 445$300,000 to $399,999
- 371$400,000 to $499,999
- 288$500,000 to $749,999
- 22$750,000 to $999,999
- 35$1,000,000 to $1,499,999
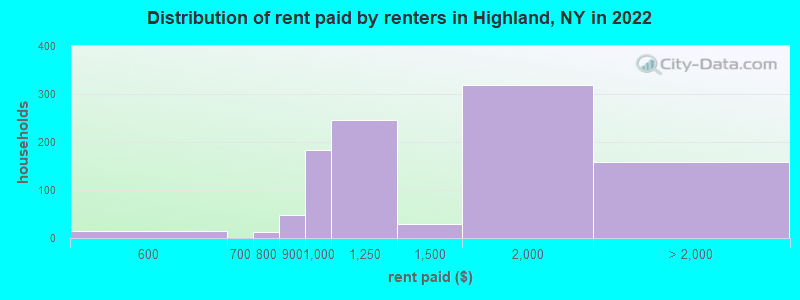
Rent paid by renters in 2022 in Highland, NY
-
- 14$550 to $599
- 12$750 to $799
- 46$800 to $899
- 182$900 to $999
- 246$1,000 to $1,249
- 29$1,250 to $1,499
- 319$1,500 to $1,999
- 39$2,000 to $2,499
- 75$2,500 to $2,999
- 43No cash rent
Percentage of workers working in this county: 53.4%
Number of people working at home: 744 (22.7% of all workers)
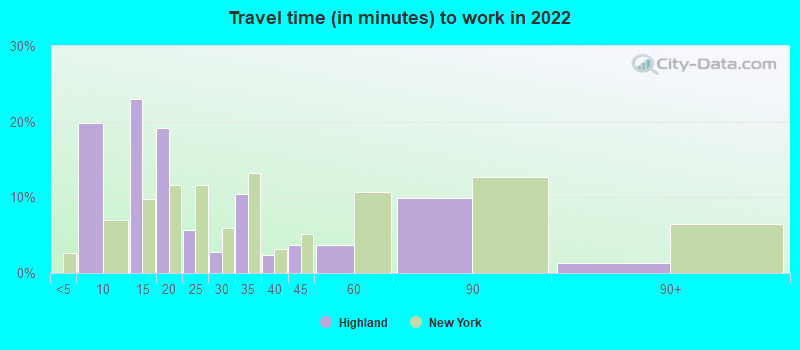
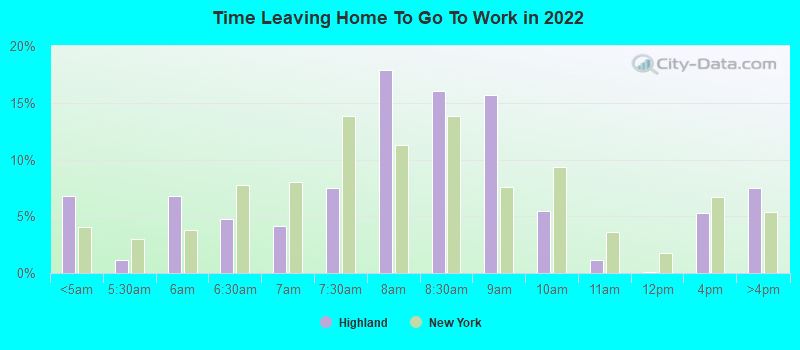
Travel time to work (commute)
- Less than 5 minutes: 97
- 5 to 9 minutes: 210
- 10 to 14 minutes: 475
- 15 to 19 minutes: 431
- 20 to 24 minutes: 332
- 25 to 29 minutes: 53
- 30 to 34 minutes: 227
- 35 to 39 minutes: 87
- 40 to 44 minutes: 40
- 45 to 59 minutes: 201
- 60 to 89 minutes: 195
- 90 or more minutes: 113
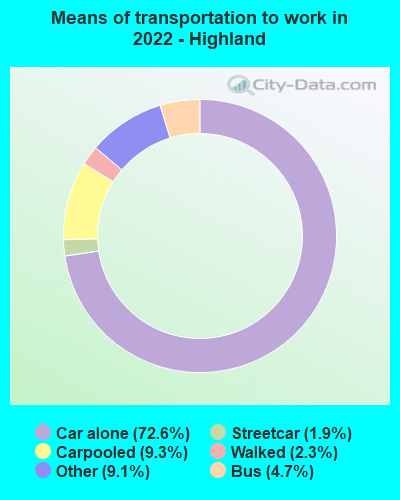
Means of transportation to work:
- Drove a car alone: 1,127 (51.6%)
- Carpooled: 153 (7.0%)
- Bus: 73 (3.3%)
- Subway or elevated rail: 28 (1.3%)
- Taxi: 174 (8.0%)
- Walked: 36 (1.6%)
- Worked at home: 736 (33.7%)
- Unemployment by race in 2022
- Unemployment rate for White non-Hispanic residents
- 3.2%Males
- 2.0%Females
- Unemployment rate for Black residents
- 17.5%Males
- 17.0%Females
- Unemployment rate for two or more race residents
- 7.6%Males
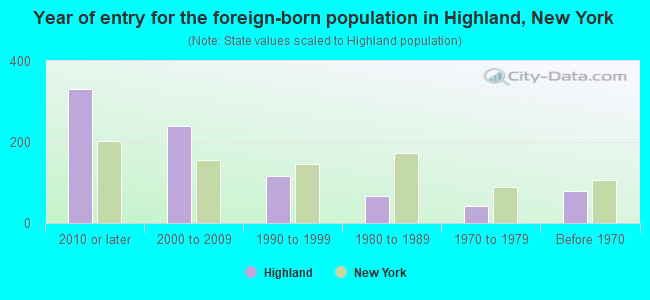
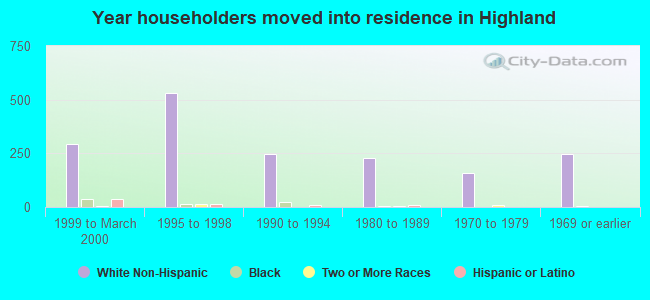
- Year of entry for the foreign-born population in Highland, New York
- 3302010 or later
- 2402000 to 2009
- 1151990 to 1999
- 671980 to 1989
- 421970 to 1979
- 78Before 1970
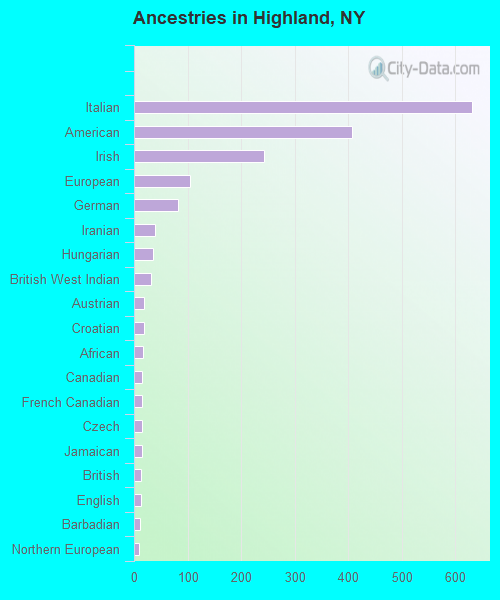
First ancestries reported:
- Italian: 631 (23.1%)
- American: 407 (14.9%)
- Irish: 243 (8.9%)
- European: 105 (3.8%)
- German: 83 (3.0%)
- Iranian: 40 (1.5%)
- Hungarian: 35 (1.3%)
- British West Indian: 32 (1.2%)
- Austrian: 19 (0.7%)
- Croatian: 18 (0.7%)
- African: 17 (0.6%)
- Canadian: 15 (0.5%)
- French Canadian: 15 (0.5%)
- Czech: 14 (0.5%)
- Jamaican: 14 (0.5%)
- British: 13 (0.5%)
- English: 13 (0.5%)
- Barbadian: 11 (0.4%)
- Northern European: 10 (0.4%)
- Yugoslavian: 2 (0.07%)
Most common places of birth for foreign-born residents (%):
| Highland: | 49.9% (416) |
| New York: | 0.6% (25,517) |
| Highland: | 13.5% (113) |
| New York: | 9.1% (410,910) |
| Highland: | 9.0% (75) |
| New York: | 4.8% (214,559) |
| Highland: | 7.3% (61) |
| New York: | 0.5% (23,242) |
| Highland: | 4.6% (38) |
| New York: | 0.3% (11,590) |
| Highland: | 4.4% (37) |
| New York: | 0.4% (18,283) |
| Highland: | 2.5% (21) |
| New York: | 1.3% (59,107) |
| Highland: | 1.9% (16) |
| New York: | 1.4% (61,245) |
| Highland: | 1.8% (15) |
| New York: | 5.0% (227,557) |
Place of birth for U.S.-born residents:
- This state: 4,375
- Other state: 1,162
- Northeast: 597
- Midwest: 306
- South: 111
- West: 117
92.7% of Highland residents lived in the same house 1 years ago.
Out of people who lived in different houses, 28.5% lived in this county.
Out of people who lived in different counties, 53.3% lived in New York.
| Highland: | 92.7% |
| State average: | 89.6% |
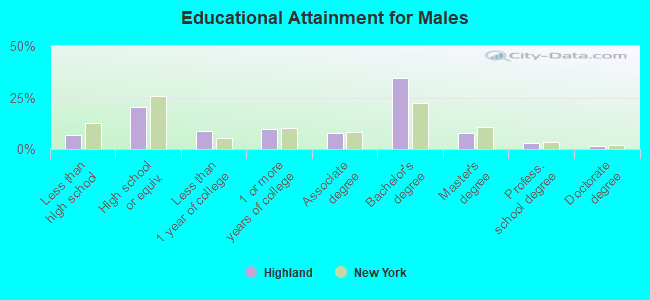
Education attainment for males 25 years and older:
- No schooling: 21
- Nursery to 4th grade: 0
- 5th and 6th grade: 12
- 7th and 8th grade: 15
- 9th grade: 11
- 10th grade: 18
- 11th grade: 30
- 12th grade, no diploma: 38
- High school graduate (or equivalency): 453
- Less than 1 year of college: 187
- Some college more than 1 year, no degree: 216
- Associate degree: 174
- Bachelor's degree: 758
- Master's degree: 174
- Professional school degree: 61
- Doctorate degree: 29
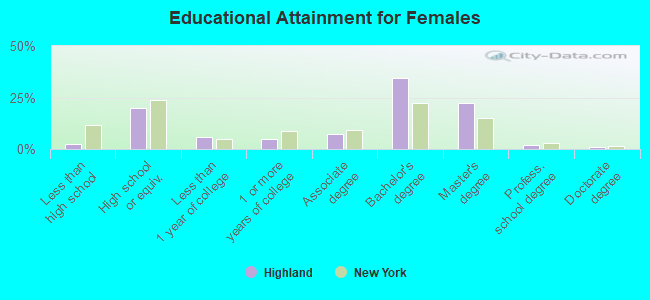
Education attainment for females 25 years and older:
- No schooling: 6
- Nursery to 4th grade: 0
- 5th and 6th grade: 18
- 7th and 8th grade: 4
- 9th grade: 0
- 10th grade: 11
- 11th grade: 0
- 12th grade, no diploma: 23
- High school graduate (or equivalency): 506
- Less than 1 year of college: 148
- Some college more than 1 year, no degree: 121
- Associate degree: 190
- Bachelor's degree: 870
- Master's degree: 573
- Professional school degree: 49
- Doctorate degree: 23
Housing units in structures:
- One, detached: 1,393
- One, attached: 522
- Two: 208
- 3 or 4: 206
- 5 to 9: 262
- 10 to 19: 27
- 20 to 49: 171
- 50 or more: 28
Housing units lacking complete kitchen facilities in 2022: 0.4%
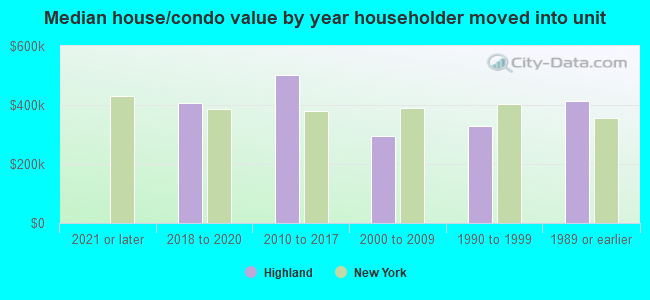
House/condo owner moved in on average 9 years ago
Renter moved in on average 5 years ago
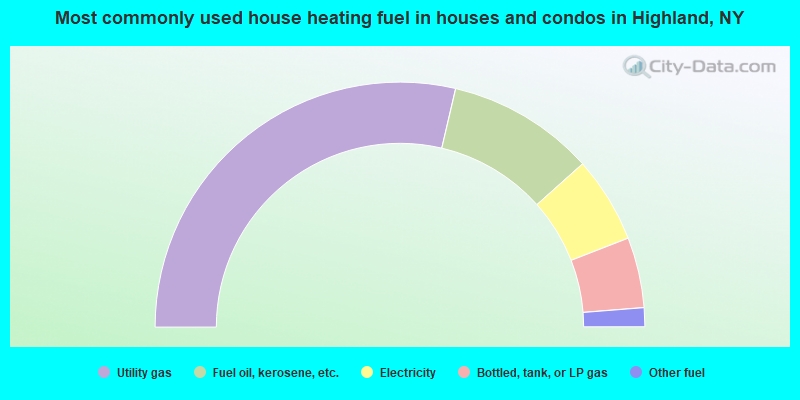
- 57.3%Utility gas
- 19.5%Fuel oil, kerosene, etc.
- 11.4%Electricity
- 9.3%Bottled, tank, or LP gas
- 2.5%Other fuel
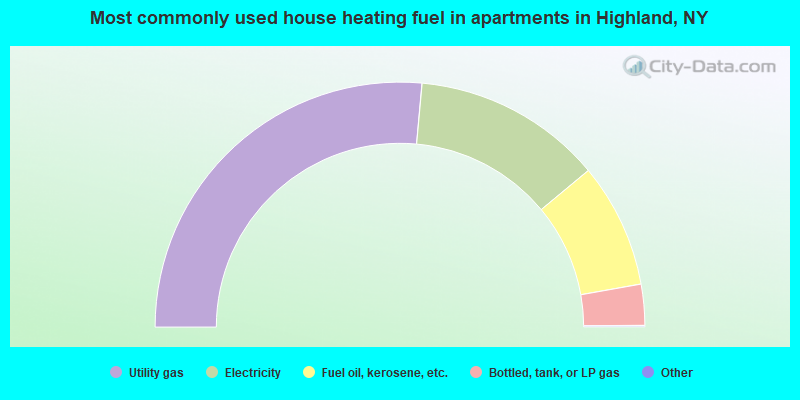
- 53.0%Utility gas
- 25.1%Electricity
- 16.5%Fuel oil, kerosene, etc.
- 5.4%Bottled, tank, or LP gas
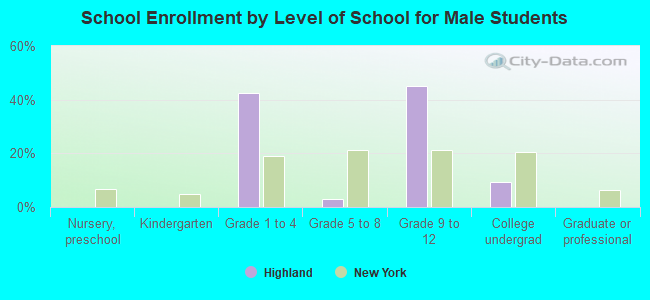
Private vs. public school enrollment:
| Here: | 8.0% |
| New York: | 15.6% |
| Here: | 21.8% |
| New York: | 15.0% |
| Here: | 24.7% |
| New York: | 39.2% |