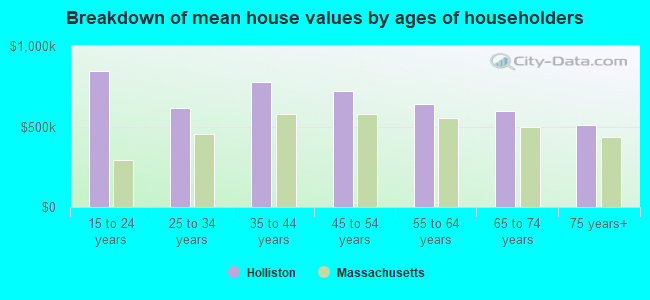
Holliston, MA (Massachusetts) Houses and Residents
| Holliston: | $666,492 |
| Massachusetts: | $534,700 |
Total population: 13,547 (Urban population: 13,168, Rural population: 633 (all nonfarm))
Houses: 4,868 (4,795 occupied: 4,139 owner occupied, 656 renter occupied)
| % of renters here: | 14% |
| State: | 38% |
Housing density: 260 houses/condos per square mile
Median price asked for vacant for-sale houses and condos in 2022 in this county: $1,068,910.
Median contract rent in 2022: $1,634 (lower quartile is $950, upper quartile is $1,926)
Median rent asked for vacant for-rent units in 2022: $1,267
Median gross rent in Holliston, MA in 2022: $1,765
Housing units in Holliston with a mortgage: 3,122 (194 second mortgage, 630 home equity loan, 0 both second mortgage and home equity loan)
Houses without a mortgage: 664
Compare current foreclosures near Holliston, MA:
| Photo | Address | Area | Beds / Baths | Price | Details |
|---|---|---|---|---|---|

|
#1
Fiske St
Holliston, MA 01746
|
3,195 sq. feet
|
2 baths 4 beds |
show details | |

|
#2
Central St
Holliston, MA 01746
|
1,184 sq. feet
|
2 baths 4 beds |
show details | |

|
#3
Central St
Holliston, MA 01746
|
780 sq. feet
|
2 baths 3 beds |
show details | |

|
#4
Garett Way
Holliston, MA 01746
|
- sq. feet
|
- baths - beds |
show details | |

|
#5
Cook Rd
Cumberland, RI 02864
|
2,050 sq. feet
|
2 baths 4 beds |
$749,500
|
show details |

|
#6
Mount Pleasant Rd
Harrisville, RI 02830
|
1,232 sq. feet
|
1 baths 3 beds |
$449,900
|
show details |

|
#7
Stillman St
Framingham, MA 01702
|
1,122 sq. feet
|
1 baths 2 beds |
$440,000
|
show details |

|
#8
Mount Hope St
North Attleboro, MA 02760
|
3,554 sq. feet
|
2 baths 4 beds |
show details | |

|
#9
Grove St
Woonsocket, RI 02895
|
2,534 sq. feet
|
3 baths 6 beds |
show details | |

|
#10
Sidney Rd
Milford, MA 01757
|
1,184 sq. feet
|
1 baths 4 beds |
show details |
| Photo | Address | Area | Beds / Baths | Price | Details |
|---|---|---|---|---|---|

|
#11
Deer Path Apt 5
Maynard, MA 01754
|
1,540 sq. feet
|
1 baths 2 beds |
show details | |

|
#12
Dicenzo Blvd # 260
Marlborough, MA 01752
|
1,359 sq. feet
|
2 baths 3 beds |
show details | |

|
#13
Pine Hill Rd
Worcester, MA 01604
|
1,472 sq. feet
|
2 baths 3 beds |
show details | |

|
#14
Violetwood Cir # No
Marlborough, MA 01752
|
1,784 sq. feet
|
2 baths 3 beds |
show details | |

|
#15
Marks Way
Maynard, MA 01754
|
2,596 sq. feet
|
2 baths 4 beds |
show details | |

|
#16
Violetwood Cir
Marlborough, MA 01752
|
1,784 sq. feet
|
2 baths 3 beds |
show details | |

|
#17
Brahms St
Roslindale, MA 02131
|
1,604 sq. feet
|
1 baths 4 beds |
show details | |

|
#18
Wilson Ave
Dedham, MA 02026
|
- sq. feet
|
2 baths 3 beds |
show details | |

|
#19
Laurelwood Dr # No
Hopedale, MA 01747
|
1,440 sq. feet
|
1 baths 2 beds |
show details | |

|
#20
C Street
Douglas, MA 01516
|
1,152 sq. feet
|
1 baths 2 beds |
show details |
| Photo | Address | Area | Beds / Baths | Price | Details |
|---|---|---|---|---|---|

|
#21
Old Bolton Rd
Hudson, MA 01749
|
1,244 sq. feet
|
1 baths 3 beds |
show details | |

|
#22
Thompson St
Hyde Park, MA 02136
|
1,584 sq. feet
|
1 baths 4 beds |
show details | |

|
#23
Old Mill Rd
Shrewsbury, MA 01545
|
2,110 sq. feet
|
2 baths 3 beds |
show details | |

|
#24
Boston Tpke
Shrewsbury, MA 01545
|
1,170 sq. feet
|
1 baths 3 beds |
show details | |

|
#25
Congress Pl
Dedham, MA 02026
|
1,966 sq. feet
|
2 baths 4 beds |
show details | |

|
#26
Baker St
West Roxbury, MA 02132
|
2,614 sq. feet
|
3 baths 4 beds |
show details | |

|
#27
Glendale Ave
Uxbridge, MA 01569
|
1,302 sq. feet
|
2 baths 4 beds |
show details | |

|
#28
Mallard Dr
Medway, MA 02053
|
2,024 sq. feet
|
2 baths 5 beds |
show details | |

|
#29
Waterville St
North Grafton, MA 01536
|
2,620 sq. feet
|
1 baths 4 beds |
show details | |

|
#30
Partridge Dr
Westwood, MA 02090
|
4,487 sq. feet
|
4 baths 5 beds |
show details |
| Photo | Address | Area | Beds / Baths | Price | Details |
|---|---|---|---|---|---|

|
#31
High St
Uxbridge, MA 01569
|
1,296 sq. feet
|
1 baths 3 beds |
show details | |

|
#32
Meachen Ln
Sudbury, MA 01776
|
4,759 sq. feet
|
4 baths 5 beds |
show details | |

|
#33
Hazel St
Uxbridge, MA 01569
|
1,194 sq. feet
|
1 baths 3 beds |
show details | |

|
#34
Ridge Hill Rd
Sudbury, MA 01776
|
2,288 sq. feet
|
2 baths 4 beds |
show details | |

|
#35
Worcester St
North Grafton, MA 01536
|
1,040 sq. feet
|
2 baths 3 beds |
show details | |

|
#36
Alden St
Dedham, MA 02026
|
732 sq. feet
|
1 baths 1 beds |
show details | |

|
#37
Rolling Ln
Weston, MA 02493
|
1,572 sq. feet
|
2 baths 3 beds |
show details | |

|
#38
Curve St
Dedham, MA 02026
|
864 sq. feet
|
1 baths 3 beds |
show details | |

|
#39
Creeper Hill Rd
North Grafton, MA 01536
|
1,104 sq. feet
|
1 baths 2 beds |
show details | |

|
#40
Stivaletta Dr
Dedham, MA 02026
|
1,148 sq. feet
|
1 baths 3 beds |
show details |
| Photo | Address | Area | Beds / Baths | Price | Details |
|---|---|---|---|---|---|

|
#41
Trilliam Run
Sutton, MA 01590
|
2,352 sq. feet
|
2 baths 4 beds |
show details | |

|
#42
Park St
Hudson, MA 01749
|
1,512 sq. feet
|
2 baths 4 beds |
show details | |

|
#43
George St
Plainville, MA 02762
|
1,218 sq. feet
|
1 baths 3 beds |
show details | |

|
#44
Jeffers St
Woonsocket, RI 02895
|
1,794 sq. feet
|
2 baths 5 beds |
show details | |

|
#45
W Hartford Ave
Uxbridge, MA 01569
|
1,992 sq. feet
|
2 baths 4 beds |
show details | |

|
#46
Violet Ave
Dedham, MA 02026
|
857 sq. feet
|
1 baths 3 beds |
show details | |

|
#47
Cocasset St
Foxboro, MA 02035
|
1,092 sq. feet
|
1 baths 3 beds |
show details | |

|
#48
Ironstone St
Millville, MA 01529
|
924 sq. feet
|
1 baths 4 beds |
show details | |

|
#49
Staniford St Apt 5
Auburndale, MA 02466
|
1,314 sq. feet
|
1 baths 2 beds |
show details | |

|
Check over 1 million property listings on Foreclosure.com!
|
browse all offers | |||
Latest news about housing in Holliston, MA collected exclusively by city-data.com from local newspapers, TV, and radio stations


Household type by relationship:
Households: 1,447,673- In family households: 1,161,600 (250,263 male householders, 116,393 female householders)
287,332 spouses, 410,462 children (392,286 natural, 9,871 adopted, 8,305 stepchildren), 16,644 grandchildren, 14,569 brothers or sisters, 15,064 parents, foster children, 15,023 other relatives, 25,838 non-relatives
- In nonfamily households: 286,073 (95,244 male householders (67,197 living alone)), 118,788 female householders (94,319 living alone)), 72,041 nonrelatives
- In group quarters: 55,412 (13,773 institutionalized population)
252,928 married couples with children.
55,356 single-parent households (9,721 men, 45,635 women).
92.8% of residents of Holliston speak English at home.
1.6% of residents speak Spanish at home (71% speak English very well, 11% speak English well, 18% speak English not well).
4.9% of residents speak other Indo-European language at home (72% speak English very well, 16% speak English well, 12% speak English not well).
0.4% of residents speak Asian or Pacific Island language at home (92% speak English very well, 8% speak English not well).
0.2% of residents speak other language at home (74% speak English very well, 26% speak English well).
Foreign born population: 1,221 (8.0%)
(86.2% of them are naturalized citizens)
| Here: | 8.1 |
| State: | 6.5 |
| Here: | 3.0 |
| State: | 4.0 |
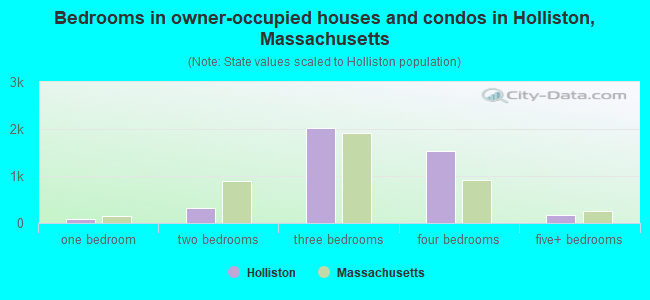
- Bedrooms in owner-occupied houses and condos in Holliston, Massachusetts
- 0no bedroom
- 931 bedroom
- 3102 bedrooms
- 2,0233 bedrooms
- 1,5414 bedrooms
- 1725+ bedrooms
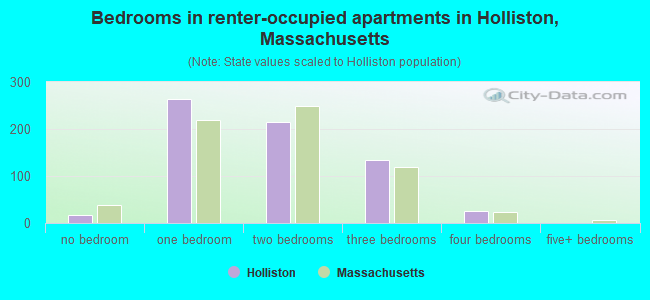
- Bedrooms in renter-occupied apartments in Holliston, Massachusetts
- 18no bedroom
- 2631 bedroom
- 2142 bedrooms
- 1353 bedrooms
- 264 bedrooms
- 05+ bedrooms
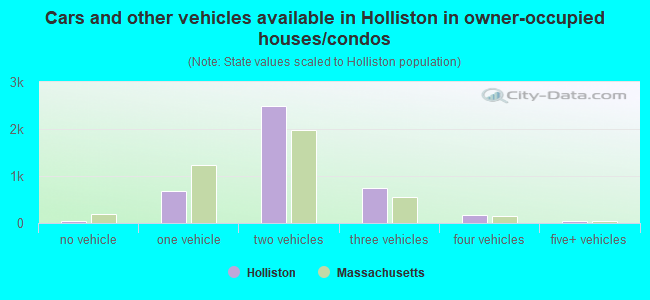
- Cars and other vehicles available in Holliston in owner-occupied houses/condos
- 33no vehicle
- 6741 vehicle
- 2,4852 vehicles
- 7363 vehicles
- 1774 vehicles
- 345+ vehicles
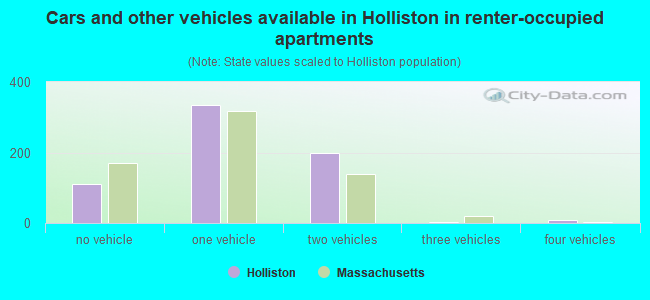
- Cars and other vehicles available in Holliston in renter-occupied apartments
- 110no vehicle
- 3361 vehicle
- 1992 vehicles
- 23 vehicles
- 94 vehicles
- 05+ vehicles
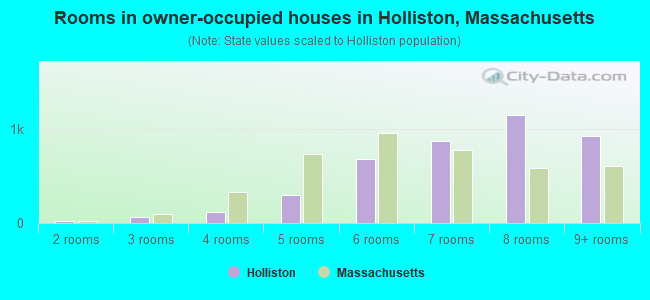
- Rooms in owner-occupied houses in Holliston, Massachusetts
- 01 room
- 172 rooms
- 663 rooms
- 1174 rooms
- 2965 rooms
- 6866 rooms
- 8717 rooms
- 1,1548 rooms
- 9329+ rooms
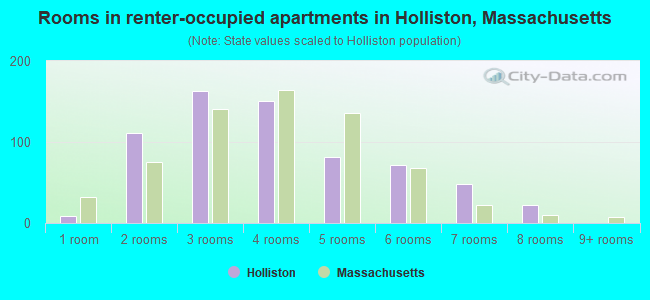
- Rooms in renter-occupied apartments in Holliston, Massachusetts
- 91 room
- 1112 rooms
- 1633 rooms
- 1504 rooms
- 825 rooms
- 716 rooms
- 487 rooms
- 228 rooms
- 09+ rooms
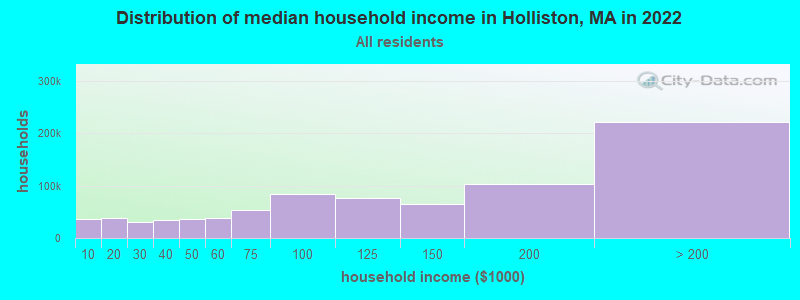
Holliston, MA household income distribution

- 36,658Less than $10,000
- 38,777$10,000 to $19,999
- 31,042$20,000 to $29,999
- 34,412$30,000 to $39,999
- 36,661$40,000 to $49,999
- 38,080$50,000 to $59,999
- 53,282$60,000 to $74,999
- 83,405$75,000 to $99,999
- 77,368$100,000 to $124,999
- 64,443$125,000 to $149,999
- 103,520$150,000 to $199,999
- 221,800$200,000 or more
Percentage of workers working in this county: 70.2%
Number of people working at home: 1,984 (24.7% of all workers)
Travel time to work (commute)
- Less than 5 minutes: 158
- 5 to 9 minutes: 557
- 10 to 14 minutes: 460
- 15 to 19 minutes: 630
- 20 to 24 minutes: 812
- 25 to 29 minutes: 511
- 30 to 34 minutes: 872
- 35 to 39 minutes: 397
- 40 to 44 minutes: 294
- 45 to 59 minutes: 998
- 60 to 89 minutes: 718
- 90 or more minutes: 202
Means of transportation to work:
- Drove a car alone: 5,921 (85.3%)
- Carpooled: 376 (5.4%)
- Bus or trolley bus: 23 (0.3%)
- Streetcar or trolley car: 13 (0.2%)
- Subway or elevated: 9 (0.1%)
- Railroad: 180 (2.6%)
- Bicycle: 22 (0.3%)
- Walked: 42 (0.6%)
- Other means: 23 (0.3%)
- Worked at home: 333 (4.8%)
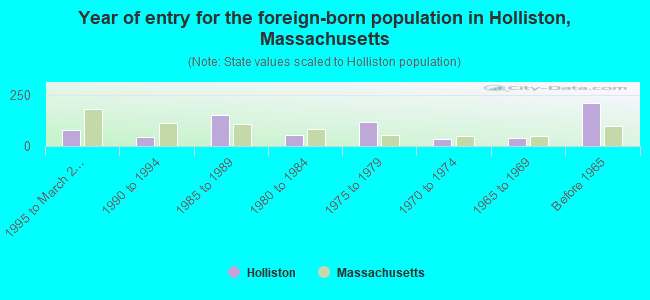
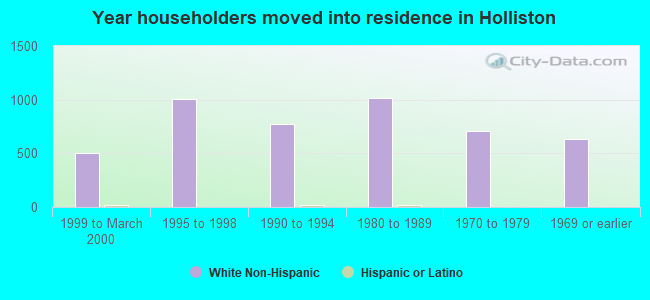
- Year of entry for the foreign-born population in Holliston, Massachusetts
- 781995 to March 2000
- 441990 to 1994
- 1531985 to 1989
- 551980 to 1984
- 1191975 to 1979
- 361970 to 1974
- 371965 to 1969
- 209Before 1965
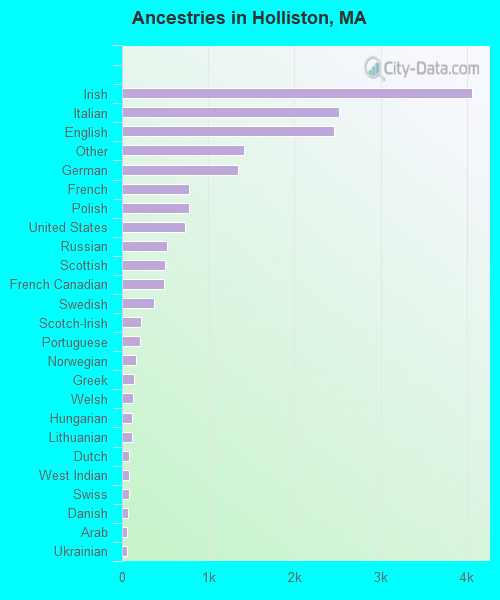
First ancestries reported:
- Irish: 4,055 (23.1%)
- Italian: 2,521 (14.4%)
- English: 2,459 (14.0%)
- Other: 1,418 (8.1%)
- German: 1,340 (7.6%)
- French: 775 (4.4%)
- Polish: 772 (4.4%)
- United States: 730 (4.2%)
- Russian: 518 (3.0%)
- Scottish: 498 (2.8%)
- French Canadian: 491 (2.8%)
- Swedish: 369 (2.1%)
- Scotch-Irish: 222 (1.3%)
- Portuguese: 205 (1.2%)
- Norwegian: 163 (0.9%)
- Greek: 141 (0.8%)
- Welsh: 122 (0.7%)
- Hungarian: 118 (0.7%)
- Lithuanian: 116 (0.7%)
- Dutch: 87 (0.5%)
- West Indian: 83 (0.5%)
- Swiss: 79 (0.5%)
- Danish: 68 (0.4%)
- Arab: 60 (0.3%)
- Ukrainian: 57 (0.3%)
- Czech: 42 (0.2%)
- Slovak: 30 (0.2%)
Most common places of birth for foreign-born residents (%):
| Holliston: | 23.4% (171) |
| Massachusetts: | 5.2% (40,247) |
| Holliston: | 16.1% (118) |
| Massachusetts: | 3.3% (25,403) |
| Holliston: | 5.1% (37) |
| Massachusetts: | 3.7% (28,319) |
| Holliston: | 4.9% (36) |
| Massachusetts: | 4.4% (33,862) |
| Holliston: | 4.8% (35) |
| Massachusetts: | 4.7% (36,669) |
| Holliston: | 4.1% (30) |
| Massachusetts: | 8.6% (66,627) |
| Holliston: | 4.0% (29) |
| Massachusetts: | 1.7% (13,456) |
| Holliston: | 3.4% (25) |
| Massachusetts: | 0.6% (4,416) |
| Holliston: | 3.1% (23) |
| Massachusetts: | 1.0% (7,414) |
| Holliston: | 3.0% (22) |
| Massachusetts: | 2.0% (15,286) |
| Holliston: | 2.5% (18) |
| Massachusetts: | 0.2% (1,700) |
| Holliston: | 2.3% (17) |
| Massachusetts: | 5.1% (39,255) |
| Holliston: | 2.2% (16) |
| Massachusetts: | 0.2% (1,206) |
| Holliston: | 2.1% (15) |
| Massachusetts: | 0.3% (2,511) |
| Holliston: | 1.9% (14) |
| Massachusetts: | 2.3% (17,449) |
| Holliston: | 1.8% (13) |
| Massachusetts: | 1.0% (7,867) |
| Holliston: | 1.6% (12) |
| Massachusetts: | 1.9% (14,883) |
| Holliston: | 1.5% (11) |
| Massachusetts: | 0.9% (6,691) |
Place of birth for U.S.-born residents:
- This state: 9,286
- Other state: 3,696
- Northeast: 2,178
- Midwest: 624
- South: 516
- West: 378
70% of Holliston residents lived in the same house 5 years ago.
Out of people who lived in different houses, 61% lived in this county.
Out of people who lived in different counties, 48% lived in Massachusetts.
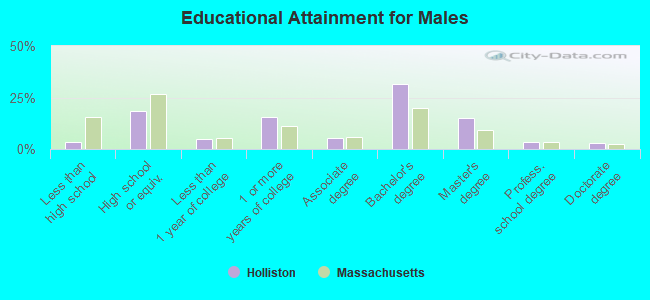
Education attainment for males 25 years and older:
- No schooling: 0
- Nursery to 4th grade: 8
- 5th and 6th grade: 7
- 7th and 8th grade: 37
- 9th grade: 25
- 10th grade: 16
- 11th grade: 27
- 12th grade, no diploma: 23
- High school graduate (or equivalency): 788
- Less than 1 year of college: 202
- Some college more than 1 year, no degree: 664
- Associate degree: 234
- Bachelor's degree: 1,363
- Master's degree: 644
- Professional school degree: 140
- Doctorate degree: 125
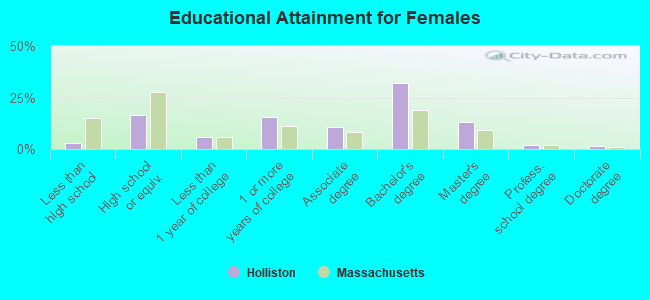
Education attainment for females 25 years and older:
- No schooling: 14
- Nursery to 4th grade: 0
- 5th and 6th grade: 26
- 7th and 8th grade: 9
- 9th grade: 23
- 10th grade: 43
- 11th grade: 13
- 12th grade, no diploma: 12
- High school graduate (or equivalency): 768
- Less than 1 year of college: 271
- Some college more than 1 year, no degree: 735
- Associate degree: 492
- Bachelor's degree: 1,521
- Master's degree: 626
- Professional school degree: 93
- Doctorate degree: 68
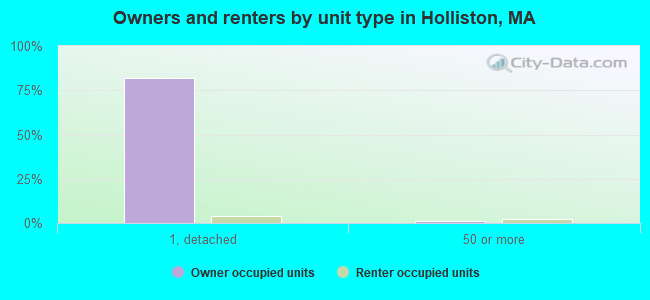
Housing units in structures:
- One, detached: 4,178
- One, attached: 22
- Two: 90
- 3 or 4: 203
- 5 to 9: 119
- 10 to 19: 26
- 20 to 49: 49
- 50 or more: 181
Housing units lacking complete kitchen facilities: 0.4%

- 54.0%Utility gas
- 38.9%Fuel oil, kerosene, etc.
- 4.5%Electricity
- 1.4%Bottled, tank, or LP gas
- 0.7%Wood
- 0.4%Coal or coke
- 0.2%Other fuel
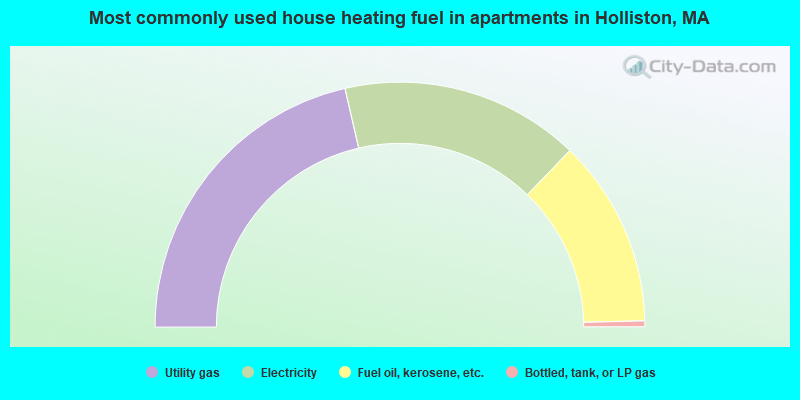
- 42.8%Utility gas
- 31.6%Electricity
- 24.8%Fuel oil, kerosene, etc.
- 0.8%Bottled, tank, or LP gas
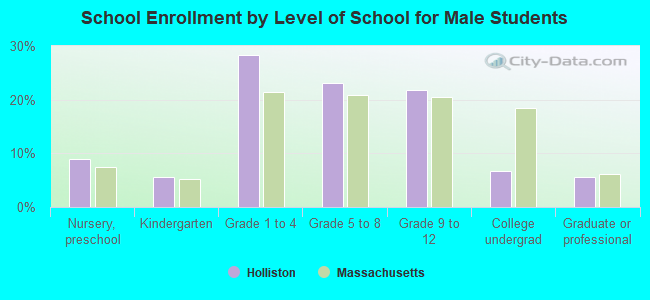
Private vs. public school enrollment:
| Here: | 2.1% |
| Massachusetts: | 10.8% |
| Here: | 9.2% |
| Massachusetts: | 12.2% |
| Here: | 37.3% |
| Massachusetts: | 48.2% |